
Small-Cap Growth Korea: Marginal Alpha Against a Strong Benchmark (+0.19%/yr)

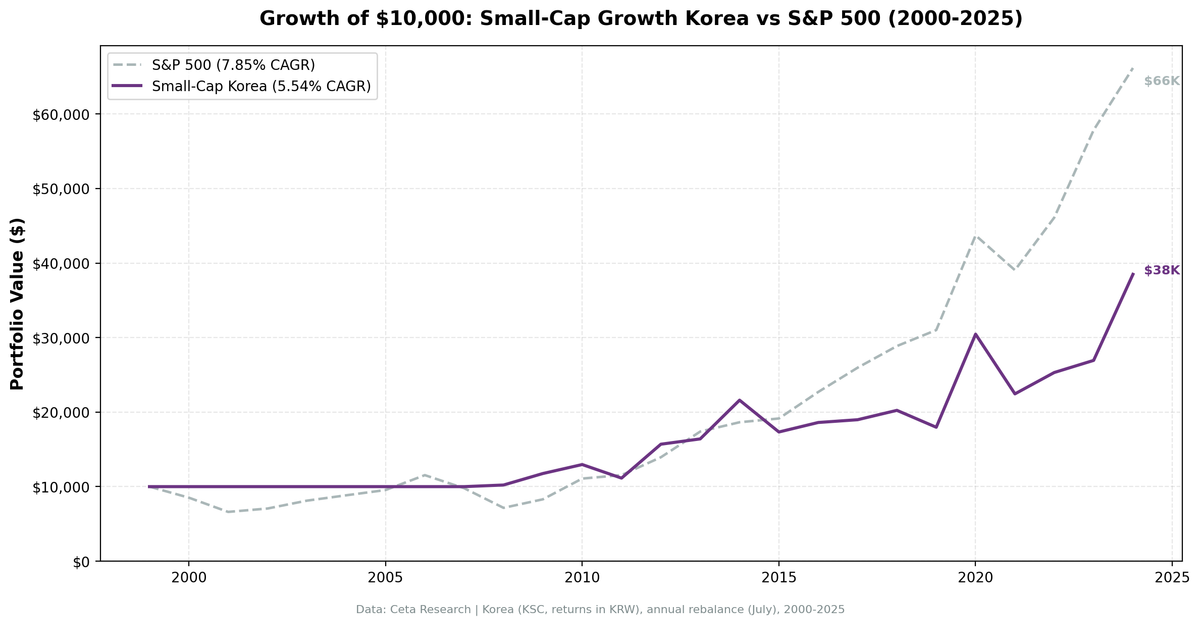
Korea's small-cap growth screen returned 5.54% CAGR over 25 years. The KOSPI benchmark returned 5.35%. The strategy beat the local market by +0.19% per year. That's not a rounding error, but it's close.
Contents
- Executive Summary
- The Method
- What We Found
- The strong benchmark makes alpha hard
- 2012: the outlier year
- Win rate vs. magnitude
- Annual Returns
- When It Works and When It Fails
- Limitations
- Run It Yourself
- Takeaway
- References
The KOSPI's 5.35% CAGR is the strongest local benchmark of all the markets we tested. Korean large-caps actually grew. Against that strong baseline, small-cap growth delivered barely any excess return. The Sharpe and Sortino ratios are nearly identical (0.124 vs 0.116, 0.288 vs 0.211), and the win rate is 44%.
Executive Summary
| Metric | Korea (KSC) | KOSPI Benchmark |
|---|---|---|
| CAGR | 5.54% | 5.35% |
| Excess Return | +0.19%/yr | — |
| Sharpe Ratio | 0.124 | 0.116 |
| Sortino Ratio | 0.288 | 0.211 |
| Max Drawdown | -26.30% | -29.91% |
| Win Rate | 44% | — |
| $10K → | $38,490 | — |
| Up Capture | 77% | — |
| Down Capture | 42% | — |
$10,000 invested in 2000 became $38,490 by end of 2024. The same in the KOSPI would have grown to $36,818. The strategy won 44% of years, captured 77% of the benchmark's gains, and 42% of its losses. That down capture is genuinely protective, but the lower up capture means the strategy didn't fully participate in Korean equity bull markets.
The Method
We screened the Korea Stock Exchange annually each July (with a 45-day filing lag). The filter:
- Market cap between KRW 50B and KRW 2T (small-cap bounds for Korea)
- Revenue growth >15% year-over-year (fiscal year)
- Positive net income
- Debt-to-equity <2.0
Top 30 by revenue growth, equal weight. Annual rebalance.
Eight cash years (2000-2007) held no positions. The Korean small-cap growth universe was thin in the early 2000s. The strategy deployed in 2008 and ran for 17 consecutive years through 2024, averaging 27.2 stocks when invested.
Full methodology: METHODOLOGY.md
For the US flagship results, see our US small-cap growth backtest.
What We Found
The strong benchmark makes alpha hard
The KOSPI's 5.35% CAGR is the strongest local benchmark we tested. Most developed market indexes in our sample returned 1-3% (SMI 1.74%, OMX 2.55%). Korea's large-cap index actually delivered mid-single-digit returns over 25 years. That's a high bar.
Against that backdrop, +0.19%/yr excess is marginal. The strategy didn't fail, it just didn't outperform by much. The Sortino ratio of 0.288 vs the KOSPI's 0.211 suggests slightly better risk-adjusted behavior, but the difference is small.
The 42% down capture is the one genuinely defensive feature. When the KOSPI fell, the small-cap growth portfolio fell only 42% as much. But the 77% up capture means you give back some gains during bull markets. That asymmetry delivered a slightly lower MaxDD (-26.30% vs -29.91%), but the absolute return premium is tiny.
2012: the outlier year
The strategy's best single year was 2012: +40.83%, against the KOSPI's +0.18%. That's 40.65 percentage points of excess return in one year.
This is a concentrated portfolio (27.2 average stocks). Single-year spikes of this magnitude reflect a few holdings having exceptional years. The 2012 Korean small-cap rally was real, but the concentration means replicating it in future years isn't guaranteed.
Remove 2012 and the strategy likely underperforms the KOSPI. That's an honest limitation of thin-universe small-cap investing.
Win rate vs. magnitude
44% win rate means the strategy beat the KOSPI in 11 of 25 years. The years it won, it sometimes won big (2012: +40.65%, 2014: +27.12%, 2024: +32.30%). The years it lost were often modest negative gaps.
This is the same pattern as quality-growth strategies globally: skewed return distribution with large wins and moderate losses. But in Korea's case, the large wins barely offset the losses, leaving a near-zero excess return.
Annual Returns
| Year | Korea | KOSPI | Excess |
|---|---|---|---|
| 2000 | 0.0% | -28.6% | +28.6% |
| 2001 | 0.0% | +25.1% | -25.1% |
| 2002 | 0.0% | -8.1% | +8.1% |
| 2003 | 0.0% | +10.2% | -10.2% |
| 2004 | 0.0% | +35.3% | -35.3% |
| 2005 | 0.0% | +26.7% | -26.7% |
| 2006 | 0.0% | +36.8% | -36.8% |
| 2007 | 0.0% | -8.3% | +8.3% |
| 2008 | +2.2% | -13.1% | +15.2% |
| 2009 | +15.1% | +18.4% | -3.4% |
| 2010 | +10.2% | +28.3% | -18.1% |
| 2011 | -14.0% | -13.7% | -0.4% |
| 2012 | +40.8% | +0.2% | +40.7% |
| 2013 | +4.5% | +8.6% | -4.1% |
| 2014 | +31.7% | +4.6% | +27.1% |
| 2015 | -19.8% | -5.3% | -14.4% |
| 2016 | +7.4% | +20.0% | -12.6% |
| 2017 | +2.0% | -5.1% | +7.1% |
| 2018 | +6.6% | -6.6% | +13.2% |
| 2019 | -11.2% | +0.6% | -11.8% |
| 2020 | +69.5% | +53.7% | +15.8% |
| 2021 | -26.3% | -29.9% | +3.6% |
| 2022 | +12.8% | +13.1% | -0.4% |
| 2023 | +6.4% | +6.9% | -0.4% |
| 2024 | +42.9% | +10.6% | +32.3% |
The excess return sequence shows a few big wins (2012, 2014, 2020, 2024) and many small losses. The cumulative effect is near-zero excess return. Eight cash years (2000-2007) mean the strategy couldn't deploy capital during the dot-com recovery.
When It Works and When It Fails
When it works: Specific years when Korean small-cap growth stocks rally hard (2012, 2014, 2020, 2024). These years appear to be episodic, not systematic.
When it fails: The strategy doesn't fail catastrophically, it just underperforms by a little in most years. The 77% up capture means it doesn't fully participate in Korean bull markets. The 44% win rate reflects this.
The thin-universe problem: With eight cash years and 27.2 average stocks, the strategy is concentrated. A bad quarter for a few companies has an outsized effect. The 2012 result likely reflects a handful of stocks having exceptional years.
Limitations
Universe concentration. 27.2 average stocks is concentrated. The 2012 result likely reflects a few holdings having exceptional years. This is hard to attribute to systematic alpha vs. luck.
Currency. Returns are in KRW. KRW/USD moves add a layer of volatility for non-Korean investors that isn't captured here.
Data completeness. KSC is a smaller exchange with fewer companies reporting in formats compatible with FMP's pipeline. Universe gaps may exist.
Eight cash years. The strategy held zero positions from 2000-2007. Low-universe years are a real risk with this screen in Korea.
Marginal excess. +0.19%/yr is near-zero. Transaction costs, slippage, and taxes could easily erase this thin margin in real-world execution.
Run It Yourself
Full backtest code is in our public repository: ceta-research/backtests.
The Korean screen uses KRW-denominated market cap bounds. The key constraint is the exchange filter: WHERE exchange = 'KSC' in the profile table. Revenue growth is computed from income_statement, and the D/E filter uses debtToEquity from financial_ratios.
Takeaway
Korea's small-cap growth screen beats the KOSPI by +0.19% per year over 25 years. That's marginal. The KOSPI's 5.35% CAGR is the strongest local benchmark we tested, which makes generating alpha harder.
The risk profile is slightly better: Sortino of 0.288 vs the KOSPI's 0.211, 42% down capture, lower MaxDD. But the return premium is so small that transaction costs and slippage could erase it in real-world execution.
The strategy doesn't fail. It just doesn't beat the benchmark by enough to justify the concentration risk (27.2 average stocks) and the thin universe (eight cash years). For investors seeking exposure to Korean small-cap growth, this screen delivers near-benchmark returns with slightly better downside protection. That's not alpha, it's tracking with marginal improvement.
Data: FMP financial data warehouse, 2000–2025. Updated March 2026.
Data: Ceta Research (FMP financial data warehouse), 2000-2025. Full methodology: METHODOLOGY.md. Past performance does not guarantee future results. This is educational content, not investment advice.
References
- Banz, R. (1981). "The Relationship Between Return and Market Value of Common Stocks." Journal of Financial Economics, 9(1), 3-18.
- Fama, E. & French, K. (1992). "The Cross-Section of Expected Stock Returns." Journal of Finance, 47(2), 427-465.
- Fama, E. & French, K. (1993). "Common Risk Factors in the Returns on Stocks and Bonds." Journal of Financial Economics, 33(1), 3-56.
- Van Dijk, M. (2011). "Is size dead? A review of the size effect in equity returns." Journal of Banking & Finance, 35(12), 3263-3274.


