
Sector Mean Reversion on German Stocks (XETRA): 4.50% CAGR, -0.59% vs DAX
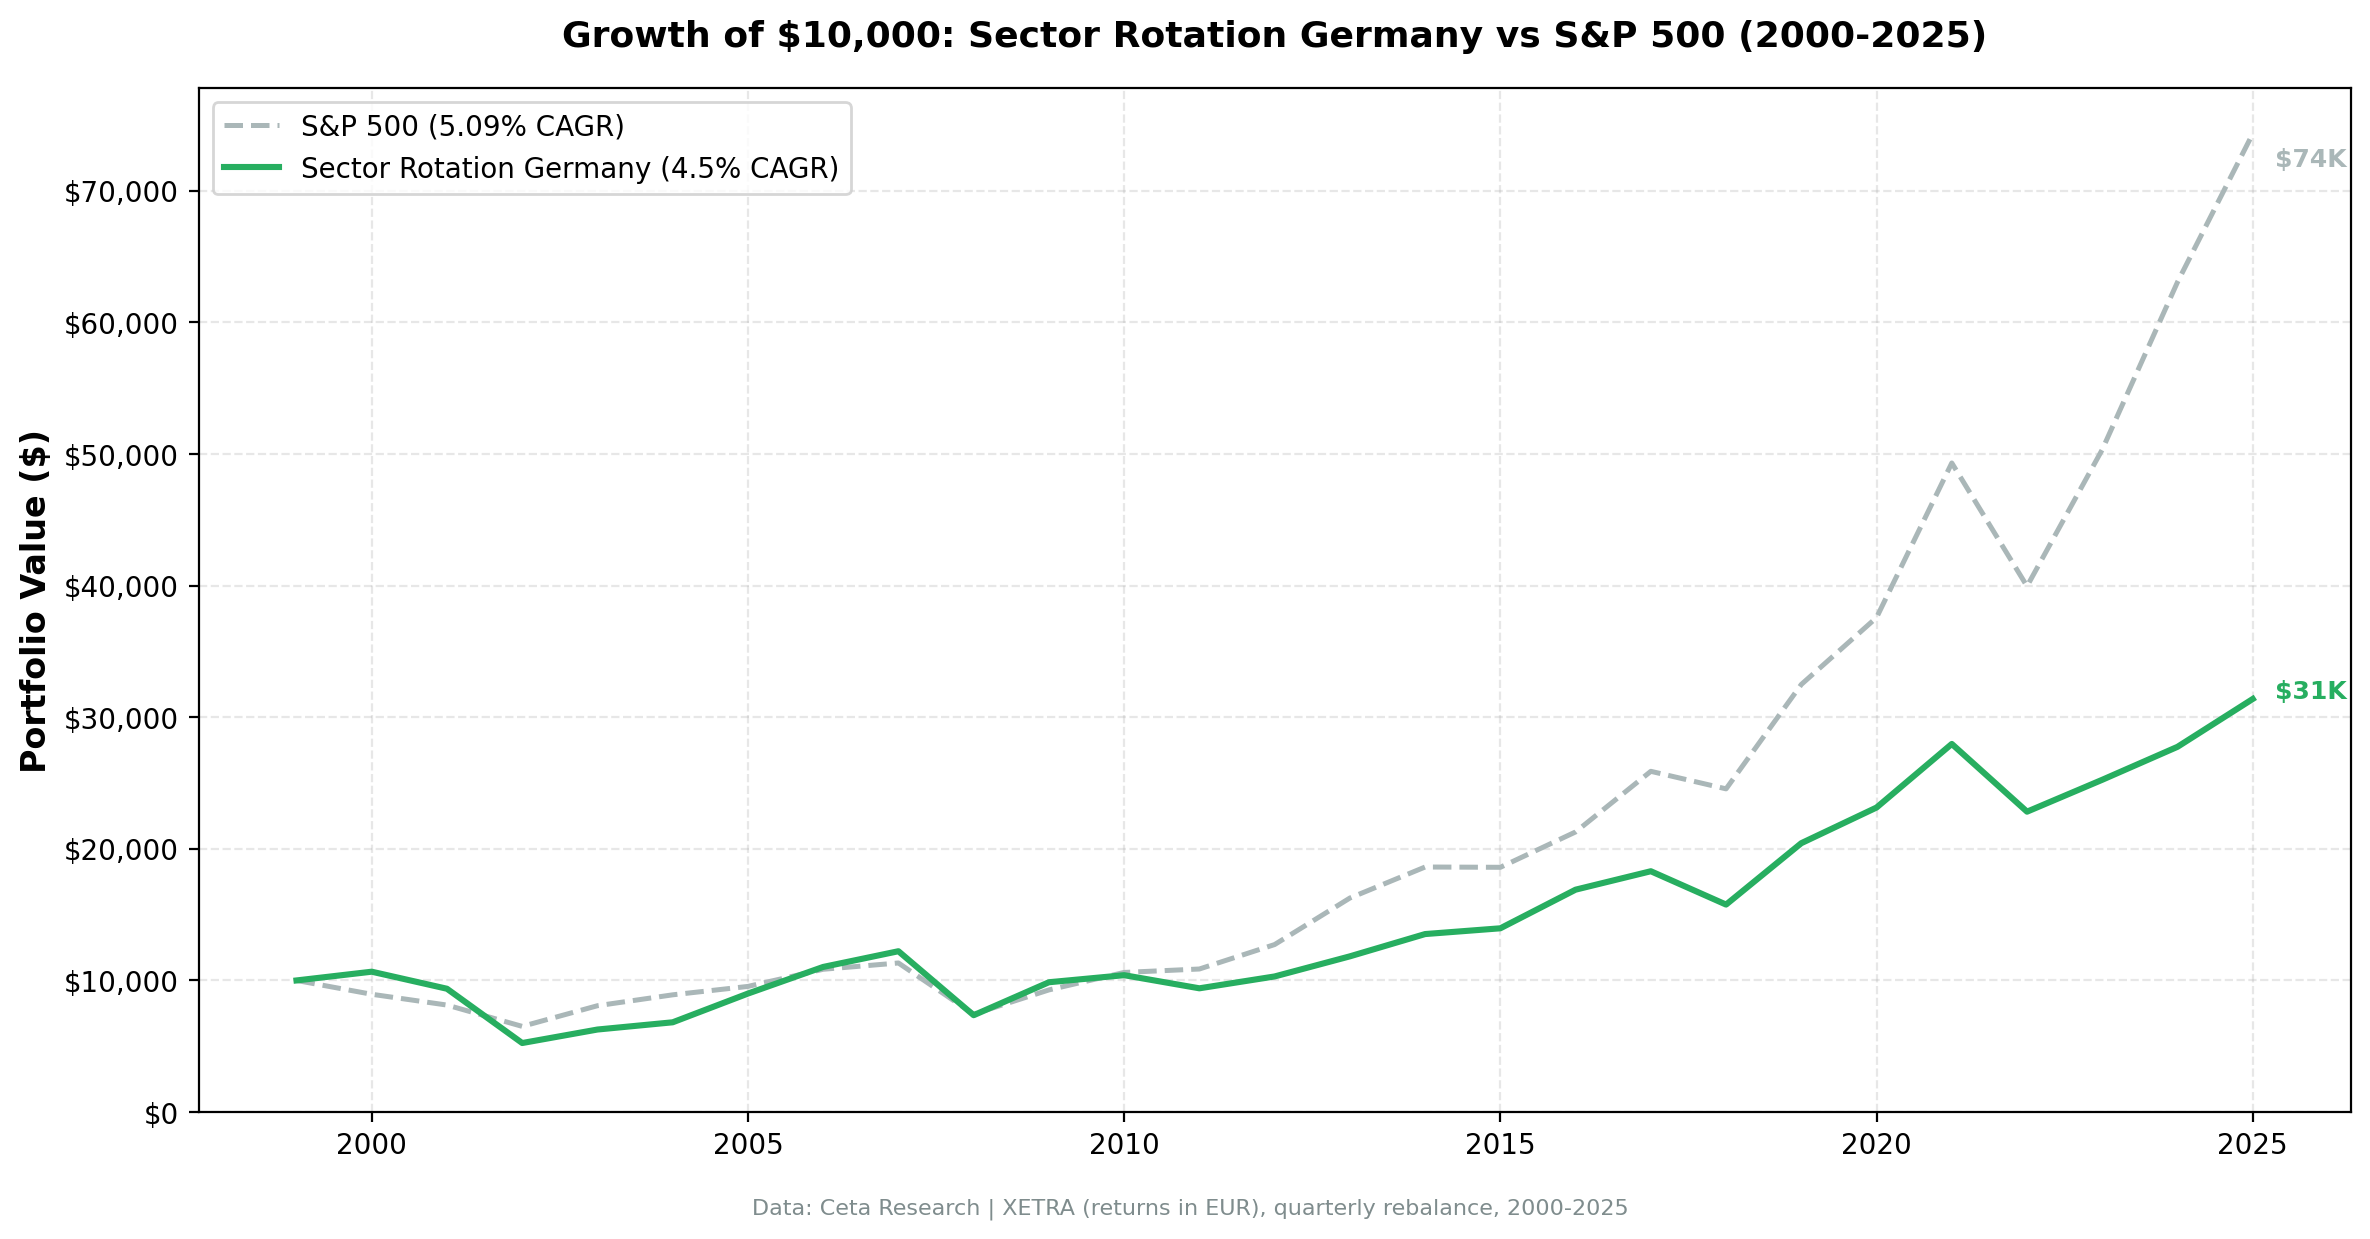
Sector mean reversion on XETRA large caps from 2000 to 2025: 4.82% CAGR vs 8.02% S&P 500. The strategy fires consistently (101 of 104 quarters) but underperforms by -3.20% annually. Consumer Defensive and Utilities dominate selection. Export-led sector structure explains the failure.

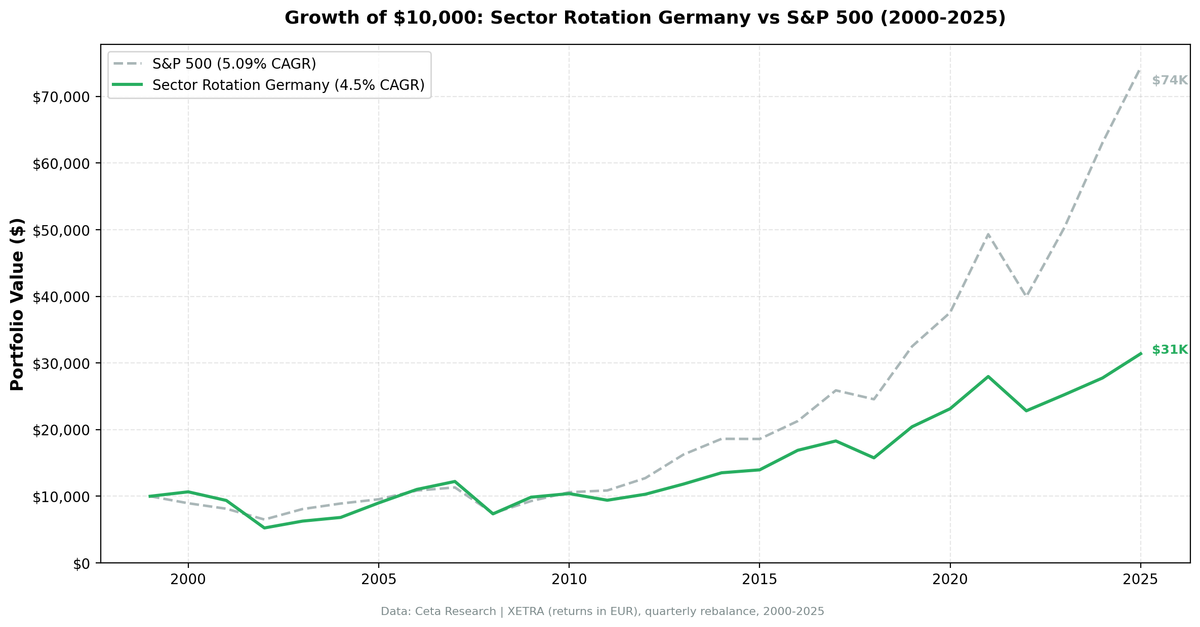
We tested sector mean reversion on XETRA large caps from 2000 to 2025. The strategy ran cleanly: 101 of 104 quarters invested, an average of 80 stocks per period, and the signal firing almost every quarter without interruption. The result was 4.50% annualized in EUR against the DAX's 5.09%. A -0.59% annual gap over 26 years.
Contents
- Method
- What is Sector Mean Reversion?
- The Screen
- What We Found
- 26 years. -0.59% annual gap vs the DAX.
- Year-by-year returns
- 2000: One year where Germany helped
- 2002: The deepest year
- 2005: The best year
- 2008-2009: Crisis and uneven recovery
- 2013-2024: Persistent underperformance
- Backtest Methodology
- Limitations
- Takeaway
- Part of a Series
- References
- Run This Screen Yourself
That's a very different story from comparing against the S&P 500. Against its local benchmark, the strategy nearly keeps pace. The strategy doesn't add alpha in Germany, but it doesn't destroy capital for a local investor either. The problem is structural: the sectors it keeps selecting don't mean-revert in Germany the way they do elsewhere. Consumer Defensive showed up in 31 of 101 invested quarters. The strategy kept finding "cheap" defensives that simply stayed cheap.
Data: FMP financial data warehouse, 2000–2025. Updated March 2026.
Method
Data source: Ceta Research (FMP financial data warehouse) Universe: XETRA (Frankfurt Stock Exchange), market cap > €500M Period: 2000-2025 (26 years, 104 quarterly periods) Rebalancing: Quarterly (January, April, July, October), equal weight all qualifying stocks in selected sectors Benchmark: DAX (^GDAXI) Cash rule: Hold cash if fewer than 5 stocks qualify across the bottom 2 sectors
What is Sector Mean Reversion?
The idea is straightforward. At each quarterly rebalance, rank all sectors by their equal-weighted 12-month trailing return. Buy every stock in the bottom 2. Re-rank and rotate each quarter.
The academic foundation is Moskowitz and Grinblatt (1999), who showed that much of the momentum anomaly operates at the industry level. The corollary: when industry-level momentum turns negative enough, mean reversion tends to follow. Sectors that underperform for a full year carry suppressed valuations and depressed sentiment. Both tend to normalize.
On US stocks, this works reliably. Beaten-down sectors recover as the dislocations that caused the underperformance resolve. The key word is "dislocation." The theory depends on the underperformance being cyclical, not structural.
Germany breaks that assumption. XETRA's largest sectors are export-led manufacturers: Volkswagen, BASF, Siemens, Deutsche Bank, Munich Re. When these sectors fall, it's rarely a sentiment dislocation. It's China slowing down. It's an energy crisis. It's a collapse in global trade. These are structural headwinds that the strategy can't distinguish from temporary weakness. The signal fires. The sector doesn't recover. The next quarter, it fires again.
The sectors that show up most often in XETRA's bottom two:
| Sector | Quarters Selected (of 101 invested) |
|---|---|
| Consumer Defensive | 31 (31%) |
| Utilities | 28 (28%) |
| Energy | 27 (27%) |
| Basic Materials | 23 (23%) |
| Real Estate | 22 (22%) |
| Technology | 18 (18%) |
Consumer Defensive at 31% is striking. In the US, Consumer Defensive rarely falls hard enough to hit the bottom two. In Germany, it does, repeatedly, and then stays there. That's a symptom of a broader problem: XETRA's defensive sectors have had persistent structural headwinds (margin pressure, weak domestic demand, Euro-driven competitiveness constraints) that the mean reversion signal mistakes for temporary underperformance.
The Screen
The screen below runs live. It ranks sectors by their current 12-month equal-weighted return across XETRA large caps. The bottom rows are what the backtest would buy today.
WITH prices AS (
    SELECT e.symbol, e.adjClose, CAST(e.date AS DATE) AS trade_date
    FROM stock_eod e
    JOIN profile p ON e.symbol = p.symbol
    WHERE p.sector IS NOT NULL AND p.sector != ''
      AND p.marketCap > 500000000
      AND p.exchange IN ('XETRA')
      AND CAST(e.date AS DATE) >= CURRENT_DATE - INTERVAL '400' DAY
      AND e.adjClose IS NOT NULL AND e.adjClose > 0
),
recent AS (
    SELECT symbol, adjClose AS recent_price
    FROM prices
    QUALIFY ROW_NUMBER() OVER (PARTITION BY symbol ORDER BY trade_date DESC) = 1
),
year_ago AS (
    SELECT symbol, adjClose AS old_price
    FROM prices
    WHERE trade_date <= CURRENT_DATE - INTERVAL '252' DAY
    QUALIFY ROW_NUMBER() OVER (PARTITION BY symbol ORDER BY trade_date DESC) = 1
),
stock_returns AS (
    SELECT r.symbol, pr.sector, (r.recent_price / ya.old_price - 1) * 100 AS return_12m
    FROM recent r
    JOIN year_ago ya ON r.symbol = ya.symbol
    JOIN profile pr ON r.symbol = pr.symbol
    WHERE ya.old_price > 0 AND r.recent_price > 0
      AND (r.recent_price / ya.old_price - 1) BETWEEN -0.99 AND 5.0
)
SELECT pr.sector,
    ROUND(AVG(sr.return_12m), 2) AS avg_return_12m_pct,
    COUNT(DISTINCT sr.symbol) AS n_stocks,
    ROW_NUMBER() OVER (ORDER BY AVG(sr.return_12m) ASC) AS rank_worst
FROM stock_returns sr
JOIN profile pr ON sr.symbol = pr.symbol
GROUP BY pr.sector
HAVING COUNT(DISTINCT sr.symbol) >= 5
ORDER BY avg_return_12m_pct ASC
What We Found
Germany's sector rotation ran without interruption. 101 of 104 quarters invested. Consistent signal. Nearly matching the local benchmark with a -0.59% annual gap vs the DAX.
26 years. -0.59% annual gap vs the DAX.
| Metric | Strategy | DAX |
|---|---|---|
| CAGR | 4.50% | 5.09% |
| Excess vs DAX | -0.59% | — |
| Volatility | 21.27% | — |
| Max Drawdown | -60.6% | — |
| Sharpe Ratio | 0.121 | — |
| Sortino Ratio | 0.189 | — |
| Calmar Ratio | 0.074 | — |
| Up Capture | 75.61% | — |
| Down Capture | 68.87% | — |
| Win Rate vs DAX | 47.12% | — |
| Avg Stocks per Period | 80.3 | — |
| Cash Periods | 3 of 104 | — |
| Total Return | 213.9% | — |
The down capture of 68.87% is a genuine positive: the strategy absorbs less downside than the DAX in bad years. The up capture of 75.61% explains why it still slightly trails over time. You protect on the downside but don't fully capture the upside. The Calmar of 0.074 means you're earning 4.50% against a -60.6% max drawdown potential. For a local German investor comparing against the DAX, the gap is narrow enough to be within noise. For a global investor comparing against SPY (8.02%), Germany at 4.50% lags by -3.52%.
The win rate of 47.12% against the DAX means the strategy beats its local benchmark in slightly fewer than half of individual years.
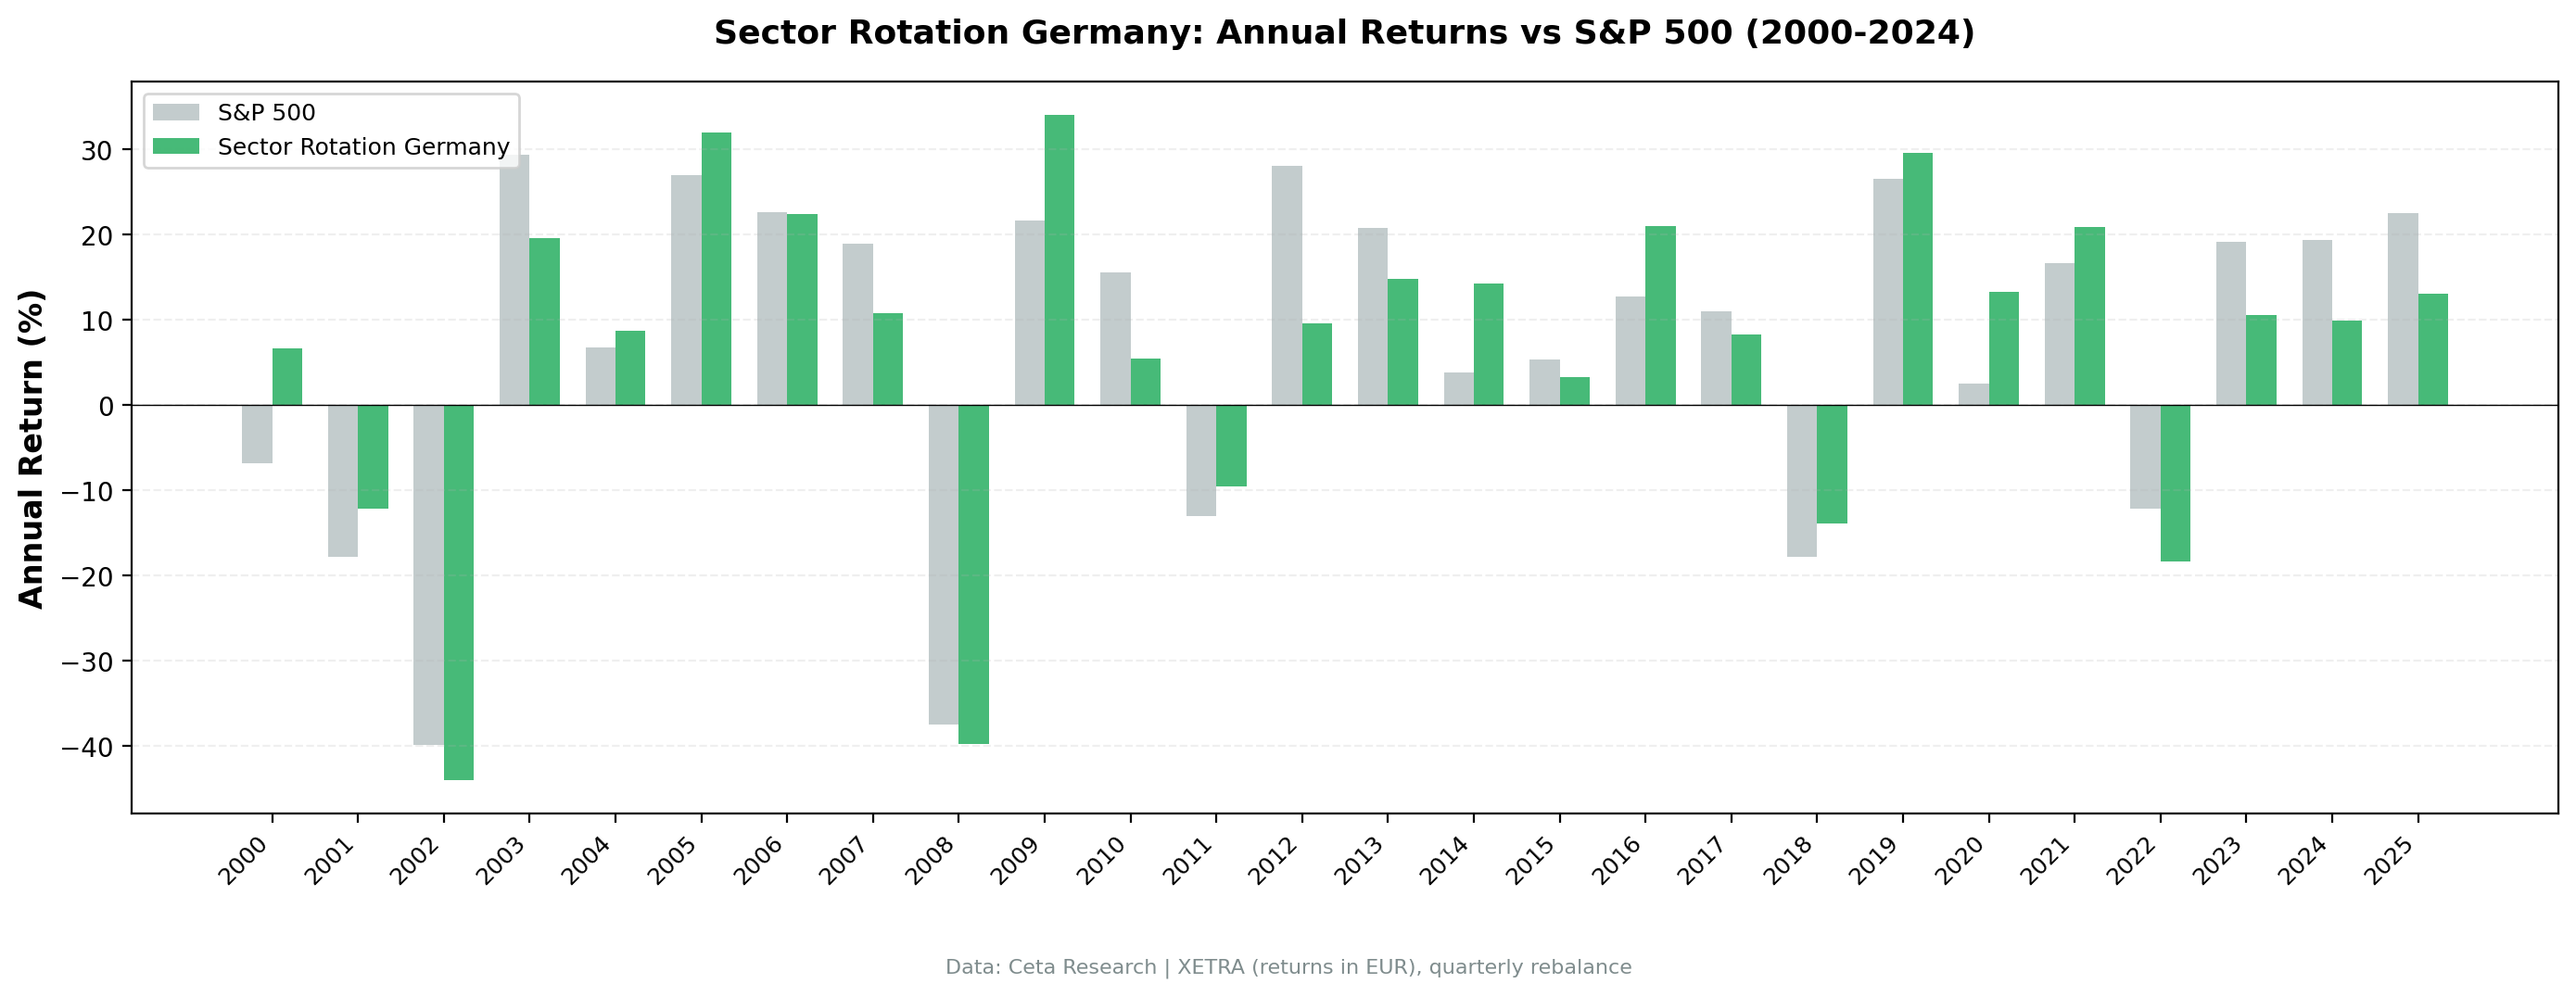
Year-by-year returns
| Year | Strategy | DAX | Excess |
|---|---|---|---|
| 2000 | +7.10% | -10.50% | +17.60% |
| 2001 | -11.19% | -9.17% | -2.02% |
| 2002 | -45.64% | -19.92% | -25.72% |
| 2003 | +19.66% | +24.12% | -4.46% |
| 2004 | +9.74% | +10.24% | -0.50% |
| 2005 | +37.43% | +7.17% | +30.26% |
| 2006 | +22.47% | +13.65% | +8.82% |
| 2007 | +10.97% | +4.40% | +6.57% |
| 2008 | -39.71% | -34.31% | -5.40% |
| 2009 | +36.90% | +24.73% | +12.17% |
| 2010 | +7.15% | +14.31% | -7.16% |
| 2011 | -8.35% | +2.46% | -10.81% |
| 2012 | +9.69% | +17.09% | -7.40% |
| 2013 | +12.25% | +27.77% | -15.52% |
| 2014 | +12.37% | +14.50% | -2.13% |
| 2015 | +5.68% | -0.12% | +5.80% |
| 2016 | +20.91% | +14.45% | +6.46% |
| 2017 | +8.30% | +21.64% | -13.34% |
| 2018 | -13.55% | -5.15% | -8.40% |
| 2019 | +26.89% | +32.31% | -5.42% |
| 2020 | +17.61% | +15.64% | +1.97% |
| 2021 | +21.89% | +31.26% | -9.37% |
| 2022 | -17.70% | -18.99% | +1.29% |
| 2023 | +10.86% | +26.00% | -15.14% |
| 2024 | +9.41% | +25.28% | -15.87% |
| 2025 | +10.12% | +17.88% | -7.76% |
2000: One year where Germany helped
The strategy's best early moment came from circumstance. In 2000, XETRA returned +7.10% while the DAX fell -10.50%. The dot-com crash burned heavily tech-weighted markets. XETRA's industrial and financial structure meant less direct exposure to tech valuations, and the beaten-down sectors the strategy selected held up better.
The +17.60% excess was real, but it wasn't a signal that Germany would systematically outperform. It was a one-year rotation pattern that happened to work.
2002: The deepest year
2002 was -45.64% vs the DAX at -19.92%. The -25.72% gap is the worst single-year miss in the record. The tech bubble's unwind hit XETRA hard. German industrial and financial stocks that had been caught up in the late-1990s expansion cycle collapsed as global demand evaporated. The strategy bought beaten-down sectors throughout 2001 and into 2002, and those sectors kept falling.
The 2003 partial recovery (+19.66%) still trailed the DAX (+24.12%). Germany didn't catch the post-crash bounce as cleanly.
2005: The best year
2005 was +37.43% vs the DAX's +7.17%, a +30.26% excess. German industrial stocks had been cheap after years of underperformance, and global demand came back. XETRA's manufacturing base, which had been a drag in prior years, led the recovery as export demand accelerated and German companies repriced off multi-year lows.
This is the strategy working correctly: structural cheapness meeting a genuine recovery in the underlying drivers. 2005 and 2006 (+22.47%) were the strongest two-year stretch in the record.
2008-2009: Crisis and uneven recovery
2008 was -39.71% vs DAX -34.31%. The financial crisis hit German banks and industrials hard. Deutsche Bank, Allianz, and the large manufacturers sold off as global trade contracted.
The 2009 recovery was strong in absolute terms (+36.90%) and beat the DAX by +12.17%. But the crisis had been deep enough that the two-year sequence still left a cumulative hole.
2013-2024: Persistent underperformance
The more damaging part of the record is quiet. It's not one catastrophic year. It's a stretch of consistent trailing.
From 2013 to 2024, Germany underperformed the DAX in 7 of 10 full years. The misses compound: -15.52% in 2013, -13.34% in 2017, -9.37% in 2021, -15.14% in 2023, -15.87% in 2024. In each of those years, the strategy was holding a portfolio of cheap German stocks in lagging sectors while the broader DAX was lifted by its large-cap constituents.
That structural divergence, XETRA's weight in old-economy sectors vs the concentration of DAX returns in specific names, is what mean reversion can't fix. You can't buy XETRA's Consumer Defensive sector and expect it to catch a broad index rally driven by industrial and tech leaders.
Backtest Methodology
| Parameter | Choice |
|---|---|
| Universe | XETRA (Frankfurt), market cap > €500M |
| Signal | Bottom 2 sectors by equal-weighted 12-month trailing return |
| Portfolio | All qualifying stocks in selected sectors, equal weight |
| Rebalancing | Quarterly (January, April, July, October) |
| Cash rule | Hold cash if < 5 stocks qualify |
| Benchmark | DAX (^GDAXI) |
| Period | 2000-2025 (26 years, 104 quarters) |
| Data | Ceta Research (FMP financial data warehouse) |
Limitations
Structural vs cyclical weakness. The core assumption of sector mean reversion is that underperformance is temporary. XETRA's most-selected sectors, Consumer Defensive, Utilities, and Energy, have faced persistent structural pressures over the study period: Euro-currency competitiveness constraints, Germany's energy transition costs, and a domestic economy structurally slower than the US post-2010. The strategy can't distinguish a cheap sector from a broken one.
EUR returns vs DAX benchmark. All XETRA returns are in EUR. The DAX is also EUR-denominated, so there's no currency mismatch vs the local benchmark. For global investors comparing in USD, EUR/USD movements add a separate layer of performance drag.
Down capture of 68.87%. The strategy falls less than the DAX during down markets, which is a genuine feature. But the 75.61% up capture means it doesn't fully recover those gains in good years. The asymmetry is modest, not decisive.
Calmar of 0.074. You're taking on a -60.6% max drawdown to earn 4.50% annualized. That's not a viable risk budget for most investors regardless of the local benchmark comparison.
No transaction costs. The backtest doesn't include costs. With 80 stocks on average and quarterly rebalancing, real-world execution would reduce already thin returns further.
Survivorship bias. Exchange membership uses current profiles, not historical. Delisted companies aren't tracked over time.
Takeaway
Germany's sector mean reversion nearly matches its local benchmark. The -0.59% annual gap vs the DAX over 26 years is narrow enough that a local German investor wouldn't have been severely penalized. The strategy ran cleanly: 101 of 104 quarters invested, 80 stocks on average, clear signal throughout.
What it kept buying were sectors that, in Germany specifically, don't mean-revert reliably. Consumer Defensive in 31% of quarters. Utilities in 28%. These aren't sentiment dislocations. They're sectors facing structural headwinds that a 12-month trailing return signal will keep identifying as cheap.
The result is 4.50% CAGR in EUR over 26 years. Against the DAX (5.09%), it's a small shortfall. Against a global benchmark like SPY (8.02%), the -3.52% annual gap reflects Germany's broader structural lag: export dependence, energy costs, and a market weighted toward old-economy sectors with no equivalent of US tech-driven multiple expansion.
The one period where Germany shone was 2005-2007, when the global industrial cycle turned in its favor. That's when mean reversion on XETRA actually worked, because the underperformance had been sentiment-driven and the structural tailwinds were real. Those conditions aren't the norm. They were the exception.
Part of a Series
This analysis is part of our Sector Mean Reversion global exchange comparison. We tested the same strategy across multiple exchanges:
- Sector Mean Reversion on US Stocks (NYSE + NASDAQ + AMEX)
- Sector Mean Reversion on Indian Stocks (BSE + NSE)
- Sector Mean Reversion on Korean Stocks (KSC)
- Sector Mean Reversion on Taiwanese Stocks (TAI + TWO)
- Sector Mean Reversion on Swedish Stocks (STO)
- Sector Mean Reversion: Global Exchange Comparison
References
- Moskowitz, T. & Grinblatt, M. (1999). "Do Industries Explain Momentum?" Journal of Finance, 54(4), 1249-1290.
Run This Screen Yourself
Via Python:
import requests, time

API_KEY = "your_api_key"  # get one at cetaresearch.com
BASE = "https://tradingstudio.finance/api/v1"

query = """
WITH prices AS (
    SELECT e.symbol, e.adjClose, CAST(e.date AS DATE) AS trade_date
    FROM stock_eod e
    JOIN profile p ON e.symbol = p.symbol
    WHERE p.sector IS NOT NULL AND p.sector != ''
      AND p.marketCap > 500000000
      AND p.exchange IN ('XETRA')
      AND CAST(e.date AS DATE) >= CURRENT_DATE - INTERVAL '400' DAY
      AND e.adjClose IS NOT NULL AND e.adjClose > 0
),
recent AS (
    SELECT symbol, adjClose AS recent_price
    FROM prices
    QUALIFY ROW_NUMBER() OVER (PARTITION BY symbol ORDER BY trade_date DESC) = 1
),
year_ago AS (
    SELECT symbol, adjClose AS old_price
    FROM prices
    WHERE trade_date <= CURRENT_DATE - INTERVAL '252' DAY
    QUALIFY ROW_NUMBER() OVER (PARTITION BY symbol ORDER BY trade_date DESC) = 1
),
stock_returns AS (
    SELECT r.symbol, pr.sector,
        (r.recent_price / ya.old_price - 1) * 100 AS return_12m
    FROM recent r
    JOIN year_ago ya ON r.symbol = ya.symbol
    JOIN profile pr ON r.symbol = pr.symbol
    WHERE ya.old_price > 0 AND r.recent_price > 0
      AND (r.recent_price / ya.old_price - 1) BETWEEN -0.99 AND 5.0
)
SELECT pr.sector,
    ROUND(AVG(sr.return_12m), 2) AS avg_return_12m_pct,
    COUNT(DISTINCT sr.symbol) AS n_stocks,
    ROW_NUMBER() OVER (ORDER BY AVG(sr.return_12m) ASC) AS rank_worst
FROM stock_returns sr
JOIN profile pr ON sr.symbol = pr.symbol
GROUP BY pr.sector
HAVING COUNT(DISTINCT sr.symbol) >= 5
ORDER BY avg_return_12m_pct ASC
"""

resp = requests.post(f"{BASE}/data-explorer/execute", headers={
    "X-API-Key": API_KEY, "Content-Type": "application/json"
}, json={
    "query": query,
    "options": {"format": "json", "limit": 100},
    "resources": {"memoryMb": 16384, "threads": 6}
})
task_id = resp.json()["taskId"]

while True:
    result = requests.get(f"{BASE}/tasks/data-query/{task_id}",
                          headers={"X-API-Key": API_KEY}).json()
    if result["status"] in ("completed", "failed"):
        break
    time.sleep(2)

print("Sector rankings (worst to best, 12-month return):")
for r in result["result"]["rows"]:
    flag = " <-- BUY" if r["rank_worst"] <= 2 else ""
    print(f"#{r['rank_worst']} {r['sector']:30s} {r['avg_return_12m_pct']:+.1f}%  ({r['n_stocks']} stocks){flag}")
Get your API key at cetaresearch.com. The full backtest code (Python + DuckDB) is on GitHub.
Data: Ceta Research, FMP financial data warehouse. Universe: XETRA (Frankfurt Stock Exchange), market cap > €500M. Returns in EUR. Quarterly rebalance, equal weight, 2000-2025. Benchmark: DAX (^GDAXI). Past performance does not guarantee future results.


