
Revenue Acceleration in Germany: -1.30% Behind the Index. The Drawdown Protection is Real.
Revenue acceleration underperforms in Germany by 1.3% annually. But it produced the lowest max drawdown in our 12-exchange study (-29.91%) and captured only 58.5% of market declines.

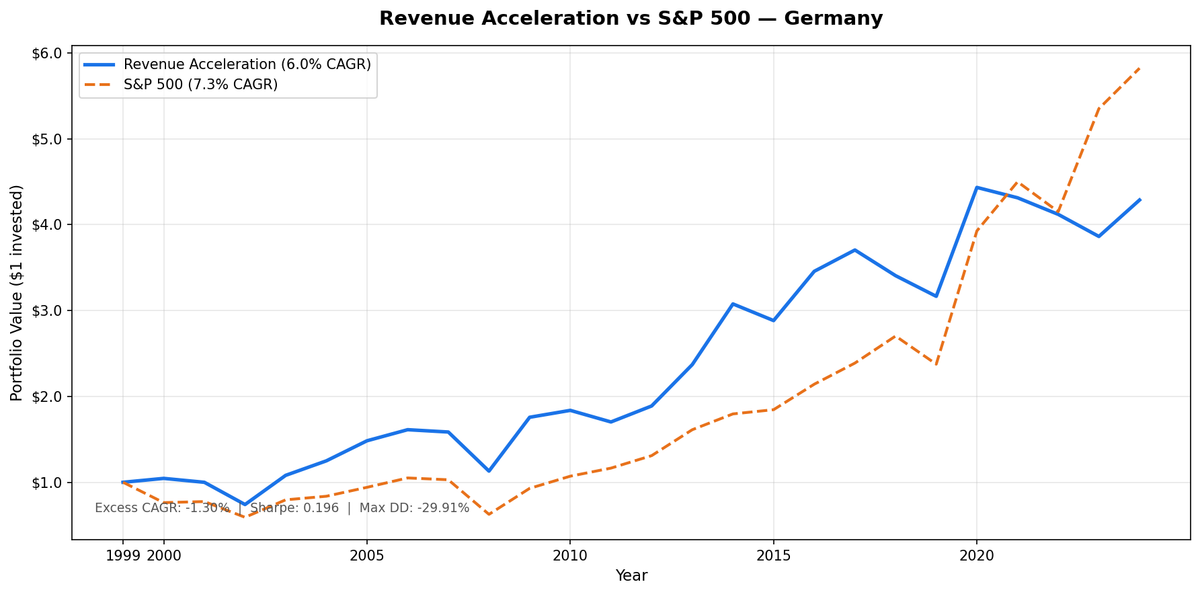
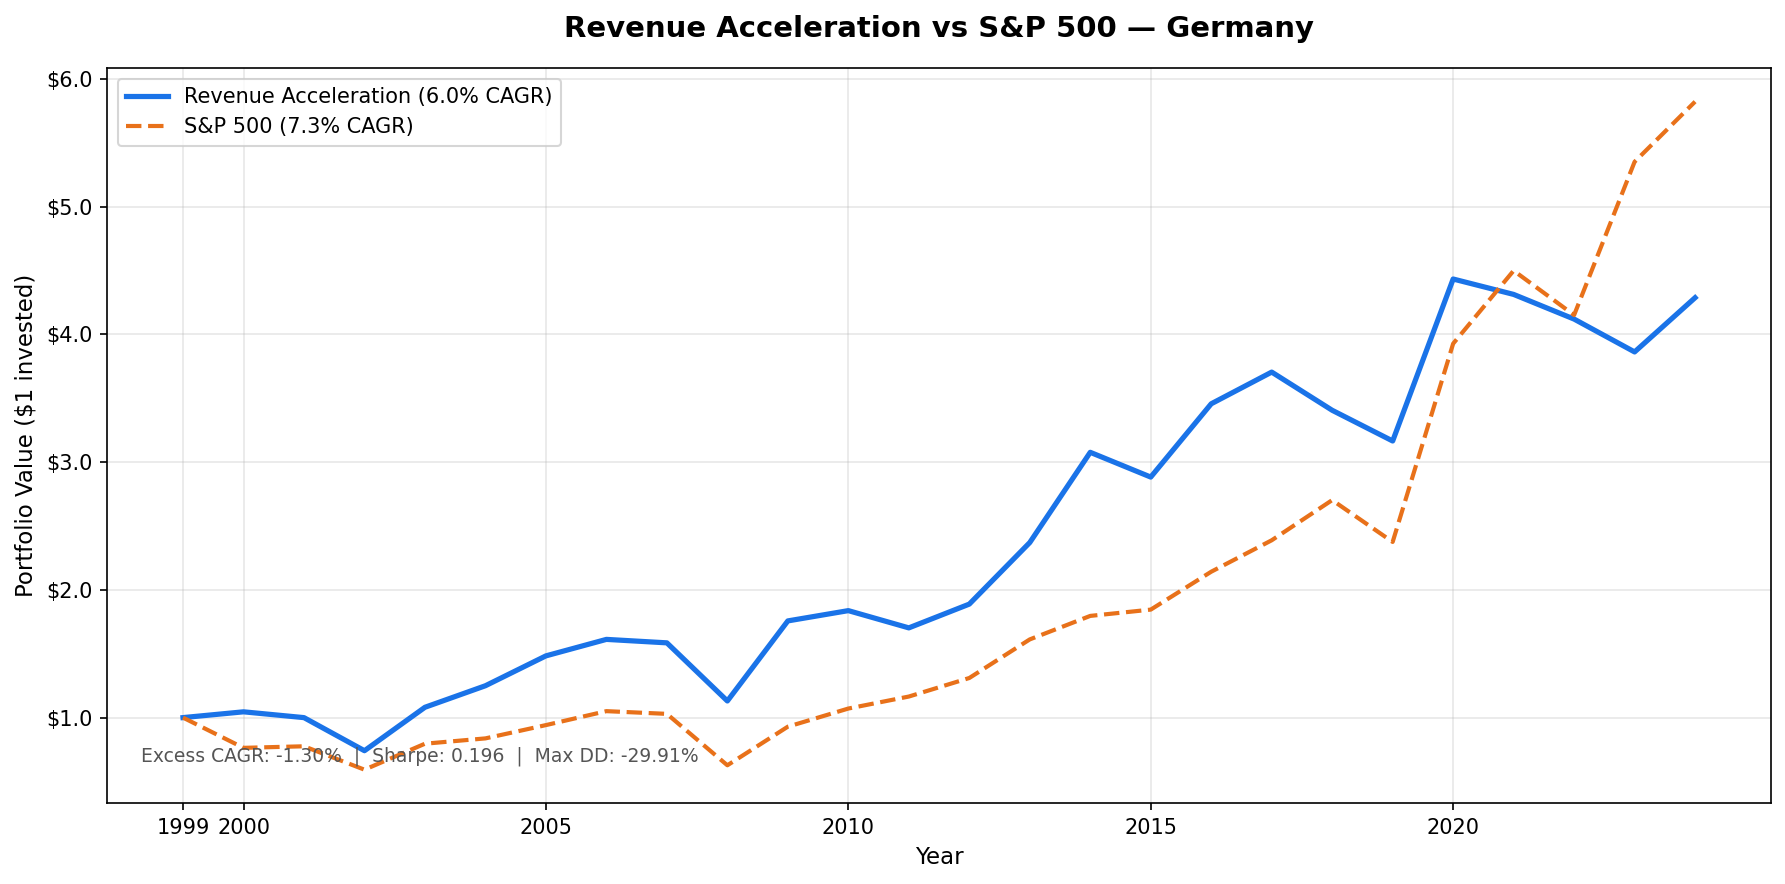
The revenue acceleration strategy underperforms in Germany. Over 25 years, it returned 6.00% annualized vs 7.30% for the S&P 500 — a -1.30% annual gap. That's not a good result.
Contents
- Method
- What We Found
- Lower return. Better crash protection.
- Year-by-Year Returns
- The crash resilience is consistent.
- 2023 was the notable failure.
- Why Germany may be structurally different.
- Limitations
- Takeaway
- Part of a Series
- Run This Screen Yourself
- References
But the max drawdown tells a different story: -29.91% for the strategy vs -40.77% for the benchmark. That's the smallest maximum drawdown in our 12-exchange global study. And the down capture of 58.5% means the strategy absorbed less than 60% of every market decline. A portfolio that trails by 1.3% per year but draws down 10 percentage points less in crises is a real trade-off worth understanding.
Data: FMP financial data warehouse, 2000–2025. Updated March 2026.
Method
Data source: Ceta Research (FMP financial data warehouse) Universe: XETRA (Germany), market cap > EUR 500M Period: 2000–2025 (25 years) Rebalancing: Annual (April 1), equal weight Benchmark: S&P 500 Total Return (SPY, in USD) Cash rule: Hold cash if fewer than 10 stocks qualify Transaction costs: Size-tiered model (0.1–0.5% one-way)
Note on returns: German portfolio returns are computed in EUR. SPY returns are in USD. Currency effects are not hedged.
Signal: revenue growth acceleration across 3 consecutive annual filings, filtered for ROE > 10%, debt/equity < 1.5, minimum market cap. Top 30 by acceleration magnitude.
What We Found
Lower return. Better crash protection.
| Metric | Revenue Accel (XETRA) | S&P 500 |
|---|---|---|
| CAGR | 6.00% | 7.30% |
| Max Drawdown | -29.91% | -40.77% |
| Sharpe Ratio | 0.196 | 0.242 |
| Up Capture | 74.6% | — |
| Down Capture | 58.5% | — |
| Cash Periods | 0 of 25 | — |
| Avg Stocks | 18.4 | — |
Zero cash periods means the German market consistently produced enough qualifying companies to stay invested every year. The smaller average stock count (18.4 vs 24.7 for the US) reflects the narrower universe of XETRA listings, but the strategy never fell below the 10-stock minimum.
The key comparison: Germany's -29.91% max drawdown vs -40.77% for SPY. That 11-point gap in peak-to-trough decline matters enormously for long-term compounding. A portfolio that loses less in crashes needs smaller subsequent gains to recover.
Year-by-Year Returns
| Year | Rev Accel (XETRA) | S&P 500 | Excess |
|---|---|---|---|
| 2000 | +4.53% | -23.68% | +28.2% |
| 2001 | -4.35% | +1.61% | -6.0% |
| 2002 | -25.91% | -23.62% | -2.3% |
| 2003 | +45.90% | +34.33% | +11.6% |
| 2004 | +15.61% | +5.23% | +10.4% |
| 2005 | +18.71% | +12.43% | +6.3% |
| 2006 | +8.70% | +11.60% | -2.9% |
| 2007 | -1.68% | -2.03% | +0.3% |
| 2008 | -28.71% | -39.11% | +10.4% |
| 2009 | +55.47% | +48.25% | +7.2% |
| 2010 | +4.58% | +15.27% | -10.7% |
| 2011 | -7.35% | +8.77% | -16.1% |
| 2012 | +10.93% | +12.46% | -1.5% |
| 2013 | +25.52% | +23.07% | +2.4% |
| 2014 | +29.80% | +11.41% | +18.4% |
| 2015 | -6.30% | +2.74% | -9.0% |
| 2016 | +19.90% | +16.08% | +3.8% |
| 2017 | +7.18% | +11.49% | -4.3% |
| 2018 | -8.07% | +13.17% | -21.2% |
| 2019 | -7.06% | -12.12% | +5.1% |
| 2020 | +40.06% | +65.36% | -25.3% |
| 2021 | -2.72% | +14.55% | -17.3% |
| 2022 | -4.48% | -7.73% | +3.2% |
| 2023 | -6.24% | +28.90% | -35.1% |
| 2024 | +10.99% | +8.80% | +2.2% |
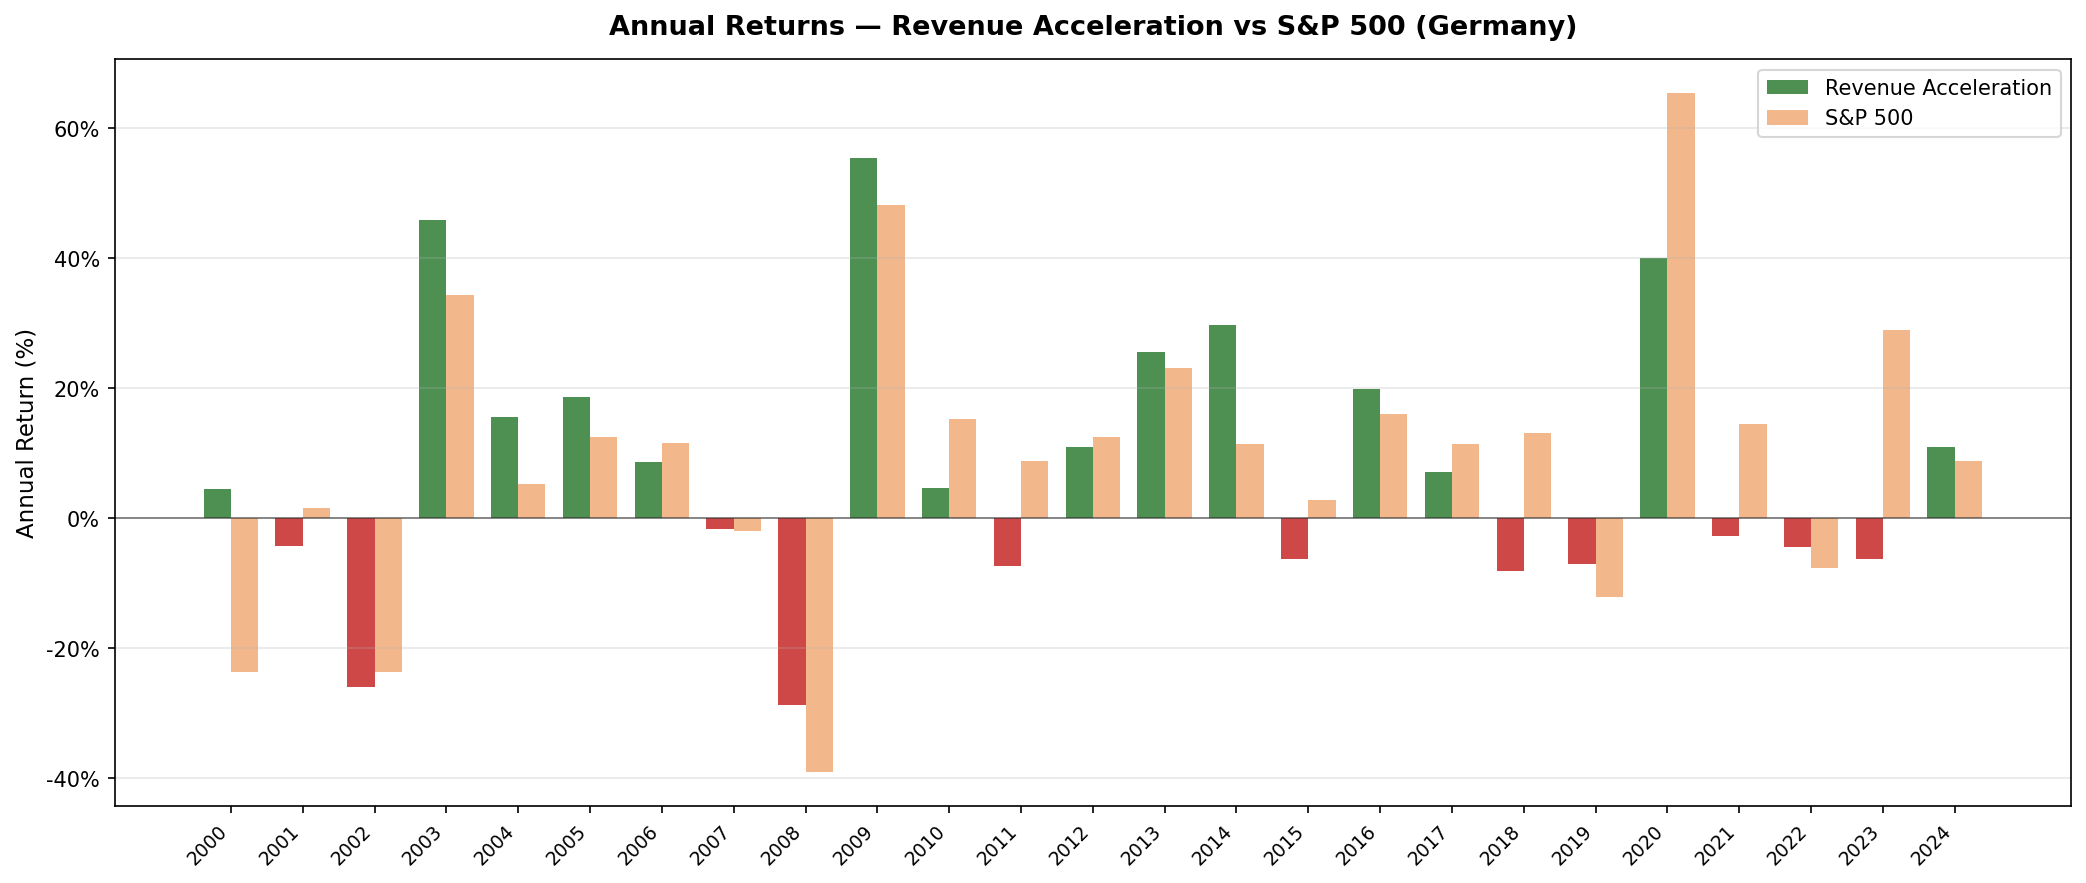
The crash resilience is consistent.
2000: +4.53% when the S&P 500 fell 23.68%. 2008: -28.71% when SPY fell -39.11%. 2019: -7.06% when SPY fell -12.12%. 2022: -4.48% when SPY fell -7.73%.
In every major market downturn except 2002 (where the portfolio fell roughly inline with SPY), German revenue accelerators held up materially better. This isn't selective pattern-picking — it's consistent across different types of crises: the tech crash, the financial crisis, the growth deceleration of 2019.
2023 was the notable failure.
The strategy fell -6.24% in a year the S&P 500 gained +28.90%. That -35.1% gap is the single largest underperformance in the study. German industrial and manufacturing names that had accelerated revenue through the post-COVID inventory rebuild saw that cycle reverse sharply in 2023. The portfolio was holding exactly those names.
This illustrates the limits of the signal: it captures acceleration that has already happened and often holds through the deceleration. The 2023 gap is the cost of lagging indicators.
Why Germany may be structurally different.
German XETRA listings skew toward industrials, capital goods, chemicals, and specialty manufacturing — sectors where revenue cycles are driven by multi-year capex orders rather than quarterly software subscriptions. Revenue acceleration in these sectors tends to be stickier and less prone to the violent reversals that plague tech-heavy portfolios.
The quality filter (ROE > 10%, D/E < 1.5) also does more work in Germany, where the full listing universe includes more capital-intensive businesses with weaker balance sheets. The filter concentrates the portfolio in German exporters and precision manufacturers with durable franchises.
This is consistent with the -29.91% max drawdown: these companies don't participate as much in risk-on surges, and they don't collapse as much in risk-off selloffs.
Limitations
Currency effects not hedged. EUR/USD moves can materially affect the comparison, especially in 2002–2008 when the euro strengthened significantly against the dollar. A hedged comparison would show different numbers.
Small average stock count. With 18.4 average stocks, idiosyncratic risk is higher than a more diversified portfolio. Any single company failure has a larger impact.
Survivorship bias. Current listings only. Companies that delisted aren't tracked through failure.
2023 is a large outlier. A -35.1% excess in a single year can substantially impact the 25-year CAGR. The strategy's track record excludes one more year of data that would change the final number.
Takeaway
Revenue acceleration in Germany underperforms by 1.3% annually over 25 years. That's the honest headline. The trade-off is a max drawdown of -29.91% — the lowest in our 12-exchange study — and a consistent pattern of outperforming in down markets.
Whether that trade-off is worth it depends on what you're optimizing for. If you're focused purely on return maximization, Germany doesn't deliver. If you're managing a portfolio where drawdown control matters as much as return, the historical record here is interesting.
Revenue acceleration as a standalone signal doesn't generate alpha in Germany. As a crash-resilience screen, it has a 25-year track record worth knowing about.
Part of a Series
This post is part of our Revenue Acceleration global exchange comparison:
- [US] — Flagship result: 3.76% CAGR, -3.54% excess, 109.6% down capture
- Canada — Only outperformer (+0.29%) with exceptional downside protection (44% down capture)
- [Revenue Acceleration: 12-Exchange Global Comparison] — Ranges from Canada +0.29% to Hong Kong -12.55%
Run This Screen Yourself
The current revenue acceleration screen for German stocks:
WITH inc AS (
    SELECT symbol, revenue, dateEpoch,
           ROW_NUMBER() OVER (PARTITION BY symbol ORDER BY dateEpoch DESC) AS rn
    FROM income_statement
    WHERE period = 'FY' AND revenue > 0
),
rev_calc AS (
    SELECT r1.symbol,
           (r1.revenue - r2.revenue) / NULLIF(r2.revenue, 0) AS growth_current,
           (r2.revenue - r3.revenue) / NULLIF(r3.revenue, 0) AS growth_prior,
           (r1.revenue - r2.revenue) / NULLIF(r2.revenue, 0)
             - (r2.revenue - r3.revenue) / NULLIF(r3.revenue, 0) AS acceleration
    FROM inc r1
    JOIN inc r2 ON r1.symbol = r2.symbol AND r2.rn = 2
    JOIN inc r3 ON r1.symbol = r3.symbol AND r3.rn = 3
    WHERE r1.rn = 1
),
met AS (
    SELECT symbol, returnOnEquity, marketCap,
           ROW_NUMBER() OVER (PARTITION BY symbol ORDER BY dateEpoch DESC) AS rn
    FROM key_metrics WHERE period = 'FY'
),
rat AS (
    SELECT symbol, debtToEquityRatio,
           ROW_NUMBER() OVER (PARTITION BY symbol ORDER BY dateEpoch DESC) AS rn
    FROM financial_ratios WHERE period = 'FY'
)
SELECT rc.symbol,
       p.companyName,
       p.sector,
       ROUND(rc.growth_current * 100, 1) AS current_growth_pct,
       ROUND(rc.growth_prior * 100, 1) AS prior_growth_pct,
       ROUND(rc.acceleration * 100, 1) AS acceleration_ppt,
       ROUND(m.returnOnEquity * 100, 1) AS roe_pct,
       ROUND(r.debtToEquityRatio, 2) AS de_ratio,
       ROUND(m.marketCap / 1e9, 1) AS mktcap_b
FROM rev_calc rc
JOIN met m ON rc.symbol = m.symbol AND m.rn = 1
JOIN rat r ON rc.symbol = r.symbol AND r.rn = 1
JOIN profile p ON rc.symbol = p.symbol
WHERE rc.growth_current > rc.growth_prior
  AND rc.growth_current > 0.05
  AND m.returnOnEquity > 0.10
  AND r.debtToEquityRatio >= 0
  AND r.debtToEquityRatio < 1.5
  AND m.marketCap > 500000000
  AND p.exchange IN ('XETRA')
ORDER BY rc.acceleration DESC
LIMIT 30
Run this screen on Ceta Research
References
- Chan, L., Karceski, J., & Lakonishok, J. (1996). "Momentum Strategies." Journal of Finance, 51(5), 1681–1713.
- Lakonishok, J., Shleifer, A., & Vishny, R. (1994). "Contrarian Investment, Extrapolation, and Risk." Journal of Finance, 49(5), 1541–1578.
Data: Ceta Research, FMP financial data warehouse. Universe: XETRA. Annual rebalance (April), equal weight, transaction costs included, 2000–2025.
Past performance does not guarantee future results. This is educational content, not investment advice.


