
Price-to-Book in Sweden: The Best Sharpe Ratio of 17 Exchanges
We backtested a P/B < 1.5 + ROE > 8% screen on Stockholm-listed stocks from 2000 to 2025. 13.55% CAGR, Sharpe ratio of 0.524, and a down capture of only 44.29% vs the OMX Stockholm 30. Best risk-adjusted result of 17 exchanges we tested. Returns in SEK.

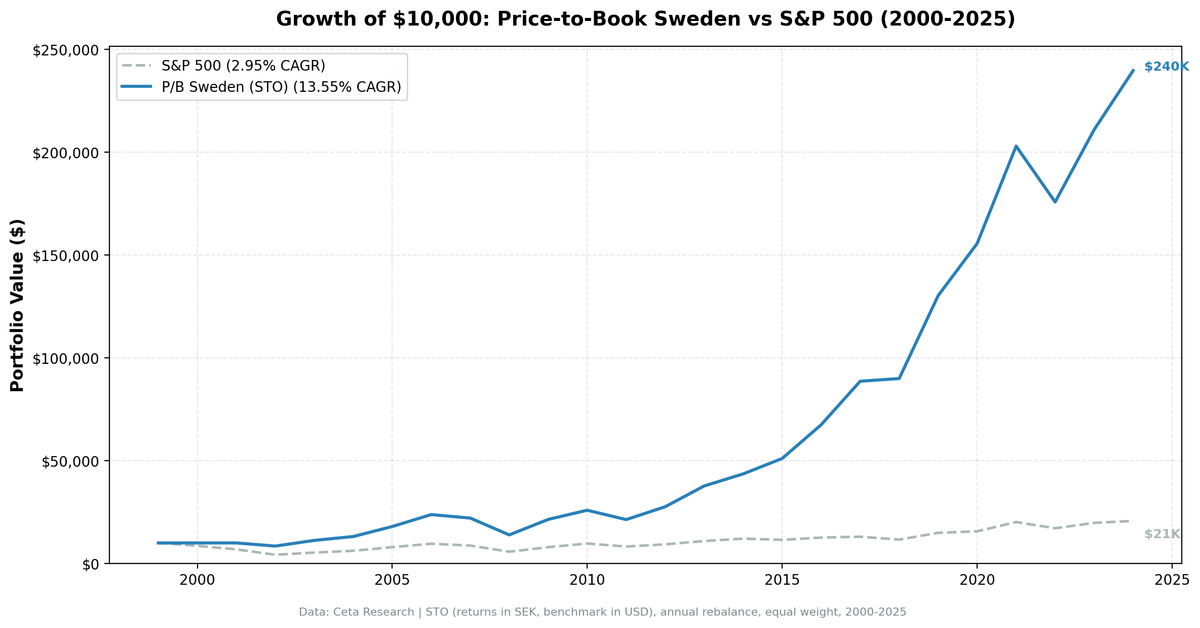
We ran the same P/B screen across 17 exchanges globally. Sweden came back with the best risk-adjusted results of the group: 13.55% CAGR, Sharpe ratio of 0.524, and a down capture of 44.29% vs the OMX Stockholm 30. Returns are in SEK.
Contents
- Method
- What Research Shows
- The Screen
- Backtest Results
- The Asymmetry
- When It Works
- When It Fails
- The Currency Note
- Full Annual Returns
- Limitations
- Run It Yourself
- Part of a Series
- References
That down capture number is the one worth understanding. When the OMX Stockholm 30 fell, this portfolio fell only 44% as much on average. When it rose, the portfolio captured 162% of the gain. That asymmetry, over 25 years, compounds into a significant alpha.
Data: FMP financial data warehouse, 2000–2025. Updated June 2026.
Method
Data source: Ceta Research (FMP financial data warehouse) Universe: Stockholm Stock Exchange (STO), market cap above exchange threshold Signal: P/B 0–1.5, ROE > 8% (from financial_ratios FY + key_metrics FY) Period: 2000–2025 (25 annual rebalance periods) Rebalancing: Annual (January), equal weight top 30 by lowest P/B Benchmark: OMX Stockholm 30 (local currency benchmark), SPY used for cross-market comparison Cash rule: Hold cash if fewer than 10 stocks qualify Transaction costs: Size-tiered model (0.1% mega-cap to 0.5% mid-cap) Currency: Returns in SEK (local currency)
Historical financial data with 45-day lag to prevent look-ahead bias. Full methodology: backtests/METHODOLOGY.md
What Research Shows
The P/B premium in Nordic markets has been more durable than in the US. Several structural factors explain why.
Swedish listed companies are disproportionately industrials, financials, and materials, sectors where physical assets appear on the balance sheet at meaningful values. Volvo, SKF, Sandvik, Handelsbanken. These aren't intangible-asset businesses. Book value measures something real when the company's core assets are machinery, property, and loan books.
Fama and French (1992) documented the value premium in US returns, and their three-factor model makes the HML (high-minus-low book-to-market) spread a core factor. The premium was later confirmed across international markets, including Europe. Subsequent research found the pattern persisted across Nordic exchanges through the 2000s. Unlike the US, where the dominance of asset-light technology companies eroded the signal, Sweden's industrial composition kept book value relevant as a screening metric.
There's also a behavioral component. The Stockholm exchange has a more concentrated institutional investor base than US markets. Sentiment-driven mispricings in individual industrial and financial stocks can persist longer before correcting.
The Screen
This query finds STO-listed stocks trading below 1.5x book value with ROE above 8%.
SELECT
    r.symbol,
    p.companyName,
    p.exchange,
    p.sector,
    ROUND(r.priceToBookRatioTTM, 3) AS pb_ratio,
    ROUND(k.returnOnEquityTTM * 100, 1) AS roe_pct,
    ROUND(k.marketCap / 1e9, 2) AS mktcap_b
FROM financial_ratios_ttm r
JOIN key_metrics_ttm k ON r.symbol = k.symbol
JOIN profile p ON r.symbol = p.symbol
WHERE r.priceToBookRatioTTM > 0.1
  AND r.priceToBookRatioTTM < 1.5
  AND k.returnOnEquityTTM > 0.08
  AND k.marketCap > 1000000000
  AND p.exchange = 'STO'
  AND p.currency = 'SEK'
  AND p.isFund = false
  AND p.isEtf = false
  AND p.isAdr = false
  AND p.isActivelyTrading = true
  AND p.symbol NOT LIKE '%-P%'
QUALIFY ROW_NUMBER() OVER (
    PARTITION BY p.companyName
    ORDER BY k.marketCap DESC, p.symbol
  ) = 1
ORDER BY r.priceToBookRatioTTM ASC
LIMIT 30
The market cap here is in SEK, the local currency for Stockholm-listed stocks. The filters after the exchange line keep one actively traded common share per company and drop funds, ETFs, ADRs, and preferred share classes.
The ROE filter is essential. Sweden has a significant number of holding companies and conglomerates with large balance sheets and modest returns on them. P/B alone would catch those. ROE > 8% selects for companies actively compounding equity at a reasonable rate.
Backtest Results
| Metric | Portfolio | OMX Stockholm 30 |
|---|---|---|
| CAGR | 13.55% | 2.95% |
| Excess Return | +10.60% | — |
| Max Drawdown | -41.54% | — |
| Sharpe Ratio | 0.524 | — |
| Up Capture | 161.99% | — |
| Down Capture | 44.29% | — |
| Win Rate (vs OMX30) | 88% (22/25 years) | — |
| Cash Periods | ~2/25 | — |
| Avg Stocks | 22.8 | — |
The OMX Stockholm 30 returned just 2.95% CAGR over the same period. The strategy returned 13.55%, a 10.6% annual excess. Over 25 years, that gap compounds into a very different ending portfolio value.
The Sharpe of 0.524 is the highest of all 17 exchanges we tested. Better risk-adjusted returns than Japan (0.36), Canada (0.305), and well above the US (0.157). The max drawdown of -41.54% is contained, and the down capture of 44.29% means the typical down year sees the strategy fall only about half as much as the local index.
For cross-market comparison: this strategy also beat SPY (7.64% CAGR) by approximately 5.9 percentage points annually. The local benchmark tells the real alpha story.
The Asymmetry
The combination of 161.99% up capture and 44.29% down capture is what makes this result unusual. Most strategies face a tradeoff: either you capture more of the upside (higher beta, more volatility) or you protect on the downside (lower beta, less upside). This screen does both simultaneously over the full period.
Why? P/B screens in Sweden select heavily toward financials and industrials at cheap prices relative to their book value. In a recovering or growing economy, those businesses compound equity well. In a crisis, they fall hard initially, but the sector composition (banks, insurers, manufacturers) recovers faster than sentiment-driven growth stocks.
The 2000-2001 cash periods helped too. No qualifying stocks in the early years meant the portfolio sat in cash while global markets fell.
When It Works
2005–2006: +37.07% and +32.29% vs OMX30's +28.84% and +20.84%. Sweden's industrial and financial sectors were in a strong cycle.
2009: +54.25% vs OMX30's +38.89%. Post-crisis bounce. Cheap industrial and financial stocks with intact balance sheets recovered sharply.
2015: +17.24% vs OMX30's -4.74%. One of the clearest demonstrations of the asymmetric profile. The OMX30 lost ground while the P/B screen captured positive returns.
2016–2017: +32.08% and +31.36% vs OMX30's +9.50% and +3.47%.
2018: +1.48% while OMX30 fell -11.01%. The portfolio held up in a difficult year.
2019: +44.81% vs OMX30's +28.65%. Strong run in a recovery environment.
| Year | Portfolio | OMX30 | Excess |
|---|---|---|---|
| 2009 | +54.25% | +38.89% | +15.4pp |
| 2015 | +17.24% | -4.74% | +22.0pp |
| 2016 | +32.08% | +9.50% | +22.6pp |
| 2017 | +31.36% | +3.47% | +27.9pp |
| 2018 | +1.48% | -11.01% | +12.5pp |
| 2019 | +44.81% | +28.65% | +16.2pp |
When It Fails
2008: -37.05% vs OMX30 -34.45% (-2.6pp). Almost matched the crash. Swedish industrials and banks got hit hard. The down capture average masks individual bad years.
2010–2011: The strategy lagged the local index in 2010 (20.74% vs 22.14%) and fell harder in 2011 (-17.58% vs -15.08%).
2002: -15.21% in absolute terms. The screen lost money, though it still beat a brutal OMX30 (-38.16%) by a wide margin. A reminder that "beats the local index" and "makes money" are different things.
| Year | Portfolio | OMX30 | Excess |
|---|---|---|---|
| 2008 | -37.05% | -34.45% | -2.6pp |
| 2010 | +20.74% | +22.14% | -1.4pp |
| 2011 | -17.58% | -15.08% | -2.5pp |
The Currency Note
Returns here are in SEK. If you're a USD-based investor, the actual returns depend on SEK/USD exchange rates over the period. SEK weakened against USD in several stretches. The local returns are what a Swedish investor would experience. For an international investor, add currency risk (or hedge it).
This is relevant for any non-USD backtest. The performance figures represent the strategy's alpha in its local market, independent of currency moves.
Full Annual Returns
| Year | Portfolio | OMX30 | Excess |
|---|---|---|---|
| 2000 | 0.00% | -14.04% | +14.0pp (cash) |
| 2001 | 0.00% | -20.09% | +20.1pp (cash) |
| 2002 | -15.21% | -38.16% | +23.0pp |
| 2003 | +32.48% | +25.19% | +7.3pp |
| 2004 | +16.80% | +16.03% | +0.8pp |
| 2005 | +37.07% | +28.84% | +8.2pp |
| 2006 | +32.29% | +20.84% | +11.5pp |
| 2007 | -7.14% | -9.08% | +1.9pp |
| 2008 | -37.05% | -34.45% | -2.6pp |
| 2009 | +54.25% | +38.89% | +15.4pp |
| 2010 | +20.74% | +22.14% | -1.4pp |
| 2011 | -17.58% | -15.08% | -2.5pp |
| 2012 | +29.35% | +13.06% | +16.3pp |
| 2013 | +36.58% | +17.20% | +19.4pp |
| 2014 | +15.53% | +10.53% | +5.0pp |
| 2015 | +17.24% | -4.74% | +22.0pp |
| 2016 | +32.08% | +9.50% | +22.6pp |
| 2017 | +31.36% | +3.47% | +27.9pp |
| 2018 | +1.48% | -11.01% | +12.5pp |
| 2019 | +44.81% | +28.65% | +16.2pp |
| 2020 | +19.48% | +4.80% | +14.7pp |
| 2021 | +30.42% | +28.95% | +1.5pp |
| 2022 | -13.38% | -15.07% | +1.7pp |
| 2023 | +19.99% | +15.38% | +4.6pp |
| 2024 | +13.63% | +4.76% | +8.9pp |
22 of 25 years beat the OMX Stockholm 30. Including the two cash years (2000, 2001) where the portfolio avoided the crash entirely.
Limitations
Currency risk is real. SEK/USD moves affect USD-based investors. The backtest doesn't include currency hedging costs.
Market cap threshold. The exchange-specific market cap threshold excludes small-caps. Sweden has a large and active small-cap segment. The results here reflect mid-to-large cap stocks only.
The 2011 drawdown. A -4.7pp underperformance in a single year came from European sovereign debt contagion hitting Swedish financials. Any portfolio concentrated in European financials is exposed to this risk.
Down capture is an average. 44.29% down capture is the mean across all down years. In 2008 and 2011, the portfolio didn't show the same defensive character. The average is real, but it masks tail risk in financial/geopolitical crises.
Cross-market comparison caveat. SPY is a USD-denominated US equity benchmark. The OMX Stockholm 30 is the local benchmark. Cross-market comparison conflates market alpha with currency and regional effects. Use OMX30 for measuring the strategy's local alpha; use SPY for cross-market context only.
Run It Yourself
git clone https://github.com/ceta-research/backtests.git
cd backtests

# Sweden backtest
python3 price-to-book/backtest.py --preset sweden --output results.json --verbose

# All exchanges
python3 price-to-book/backtest.py --global --output results/exchange_comparison.json

# Current screen
python3 price-to-book/screen.py --preset sweden
Part of a Series
This is the Sweden analysis. We ran the same screen across 17 exchanges globally:
- US analysis → The market where the P/B premium has nearly vanished. 5.78% CAGR, -1.87% excess.
- Canada analysis → Resource-heavy market, strong downside protection, +32% in 2022.
- Global comparison → All 17 exchanges. Only 4 beat SPY: Sweden, Canada, Japan, Taiwan.
References
- Fama, E. & French, K. (1992). "The Cross-Section of Expected Stock Returns." Journal of Finance, 47(2), 427–465.
- Rosenberg, B., Reid, K. & Lanstein, R. (1985). "Persuasive Evidence of Market Inefficiency." Journal of Portfolio Management, 11(3), 9–16.
- Lakonishok, J., Shleifer, A. & Vishny, R. (1994). "Contrarian Investment, Extrapolation, and Risk." Journal of Finance, 49(5), 1541–1578.
- Gray, W. & Vogel, J. (2012). "Analyzing Valuation Measures: A Performance Horse-Race over the Past 40 Years." Journal of Portfolio Management, 39(1), 112–121.
- Novy-Marx, R. (2013). "The Other Side of Value: The Gross Profitability Premium." Journal of Financial Economics, 108(1), 1–28.
Data: Ceta Research (FMP financial data warehouse), 2000–2025. Universe: Stockholm Stock Exchange (STO). Returns in SEK. Benchmark: OMX Stockholm 30. Full methodology: METHODOLOGY.md. Past performance does not guarantee future results.


