
Piotroski F-Score Across 15 Markets: Where It Works, Where It Doesn't
We ran the Piotroski F-Score on 15 exchanges with MOC execution and data quality guards. Spread is positive on 9, negative on 6. Score 8-9 beats the local benchmark on 10 of 15. Range: +12.0% (Thailand) to -7.2% (India). Avoidance works on 12 of 15.

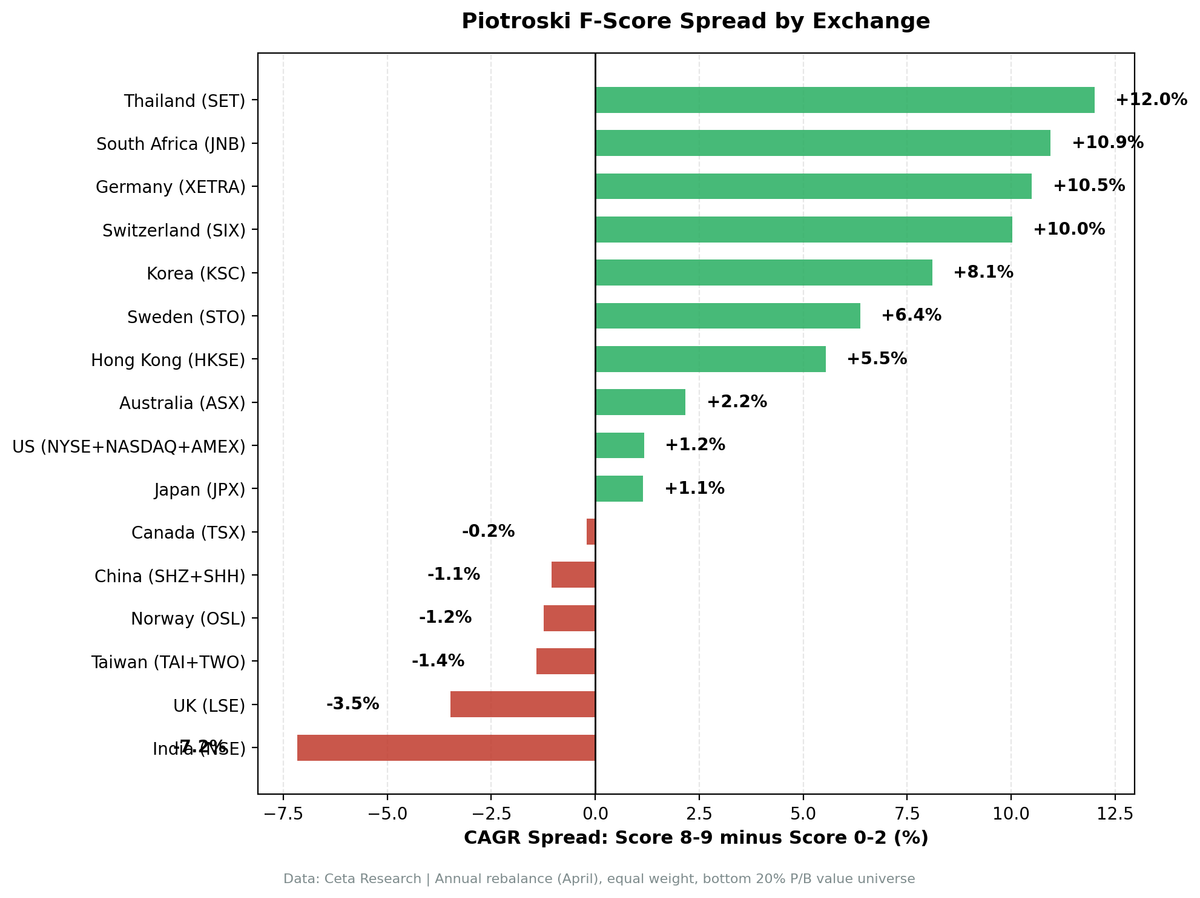
We ran the same Piotroski F-Score backtest on fifteen exchanges using next-day close (MOC) execution and data quality guards. The spread between Score 8-9 and Score 0-2 value stocks is positive on nine of fifteen markets. On the other six, the signal inverts: low-scoring stocks beat high-scoring stocks.
Contents
- Method
- Global Results
- Three Patterns in the Data
- 1. The F-Score works best in mid-sized European and Asian markets
- 2. Large efficient markets compress the signal
- 3. Growth-driven or commodity-heavy markets invert the signal
- Avoidance vs Selection: A Global Pattern
- Why the Signal Varies
- Portfolio Construction Implications
- Limitations
- Individual Exchange Write-Ups
- Reproduce the Backtests
Measured against local benchmarks, the picture shifts. Score 8-9 beats the local market on ten of fifteen exchanges. The F-Score is not a universal quality signal, but it produces alpha vs the local index more often than the H-vs-L spread suggests.
Data: FMP financial data warehouse, 1997–2024. Updated May 2026.
Method
Same design applied to each exchange independently:
- Signal: Piotroski F-Score (9 binary tests on profitability, leverage, efficiency)
- Universe: Exchange-specific value stocks (bottom quintile by P/B, exchange-appropriate market cap filters)
- Period: 25-28 years depending on exchange data availability
- Rebalancing: Annual (April)
- Portfolios: Equal weight, all qualifying stocks at Score 8-9 (long) and Score 0-2 (weak)
- Execution: Next-day close (MOC)
- Benchmark: Local index where available (Nikkei 225, FTSE 100, Hang Seng, Sensex, KOSPI, TAIEX, SSE Composite, DAX, OMX Stockholm, SMI, SET, Oslo All-Share, TSX Composite). SPY fallback for South Africa.
- Data quality: Phantom adjClose oscillations removed, individual stock returns filtered for adjClose artifacts
ASX (Australia) and SAO (Brazil) excluded due to fatal adjClose data errors. SGX (Singapore) excluded due to 0 symbols in the profile table.
Full methodology and individual exchange write-ups linked at the end.
Global Results
All fifteen exchanges, sorted by spread (Score 8-9 minus Score 0-2):
| Exchange | Score 8-9 CAGR | Score 0-2 CAGR | Spread | Sharpe (8-9) | Benchmark | Bench CAGR | Excess vs Bench |
|---|---|---|---|---|---|---|---|
| Thailand (SET) | 10.9% | -1.1% | +12.0% | 0.282 | SET Index | 2.5% | +8.41% |
| South Africa (JNB) | 14.7% | 3.7% | +10.9% | 0.184 | (SPY) | 7.2% | +7.45% |
| Germany (XETRA) | 15.4% | 4.9% | +10.5% | 0.340 | DAX | 5.6% | +9.82% |
| Switzerland (SIX) | 7.6% | -2.4% | +10.0% | 0.326 | SMI | 1.9% | +5.74% |
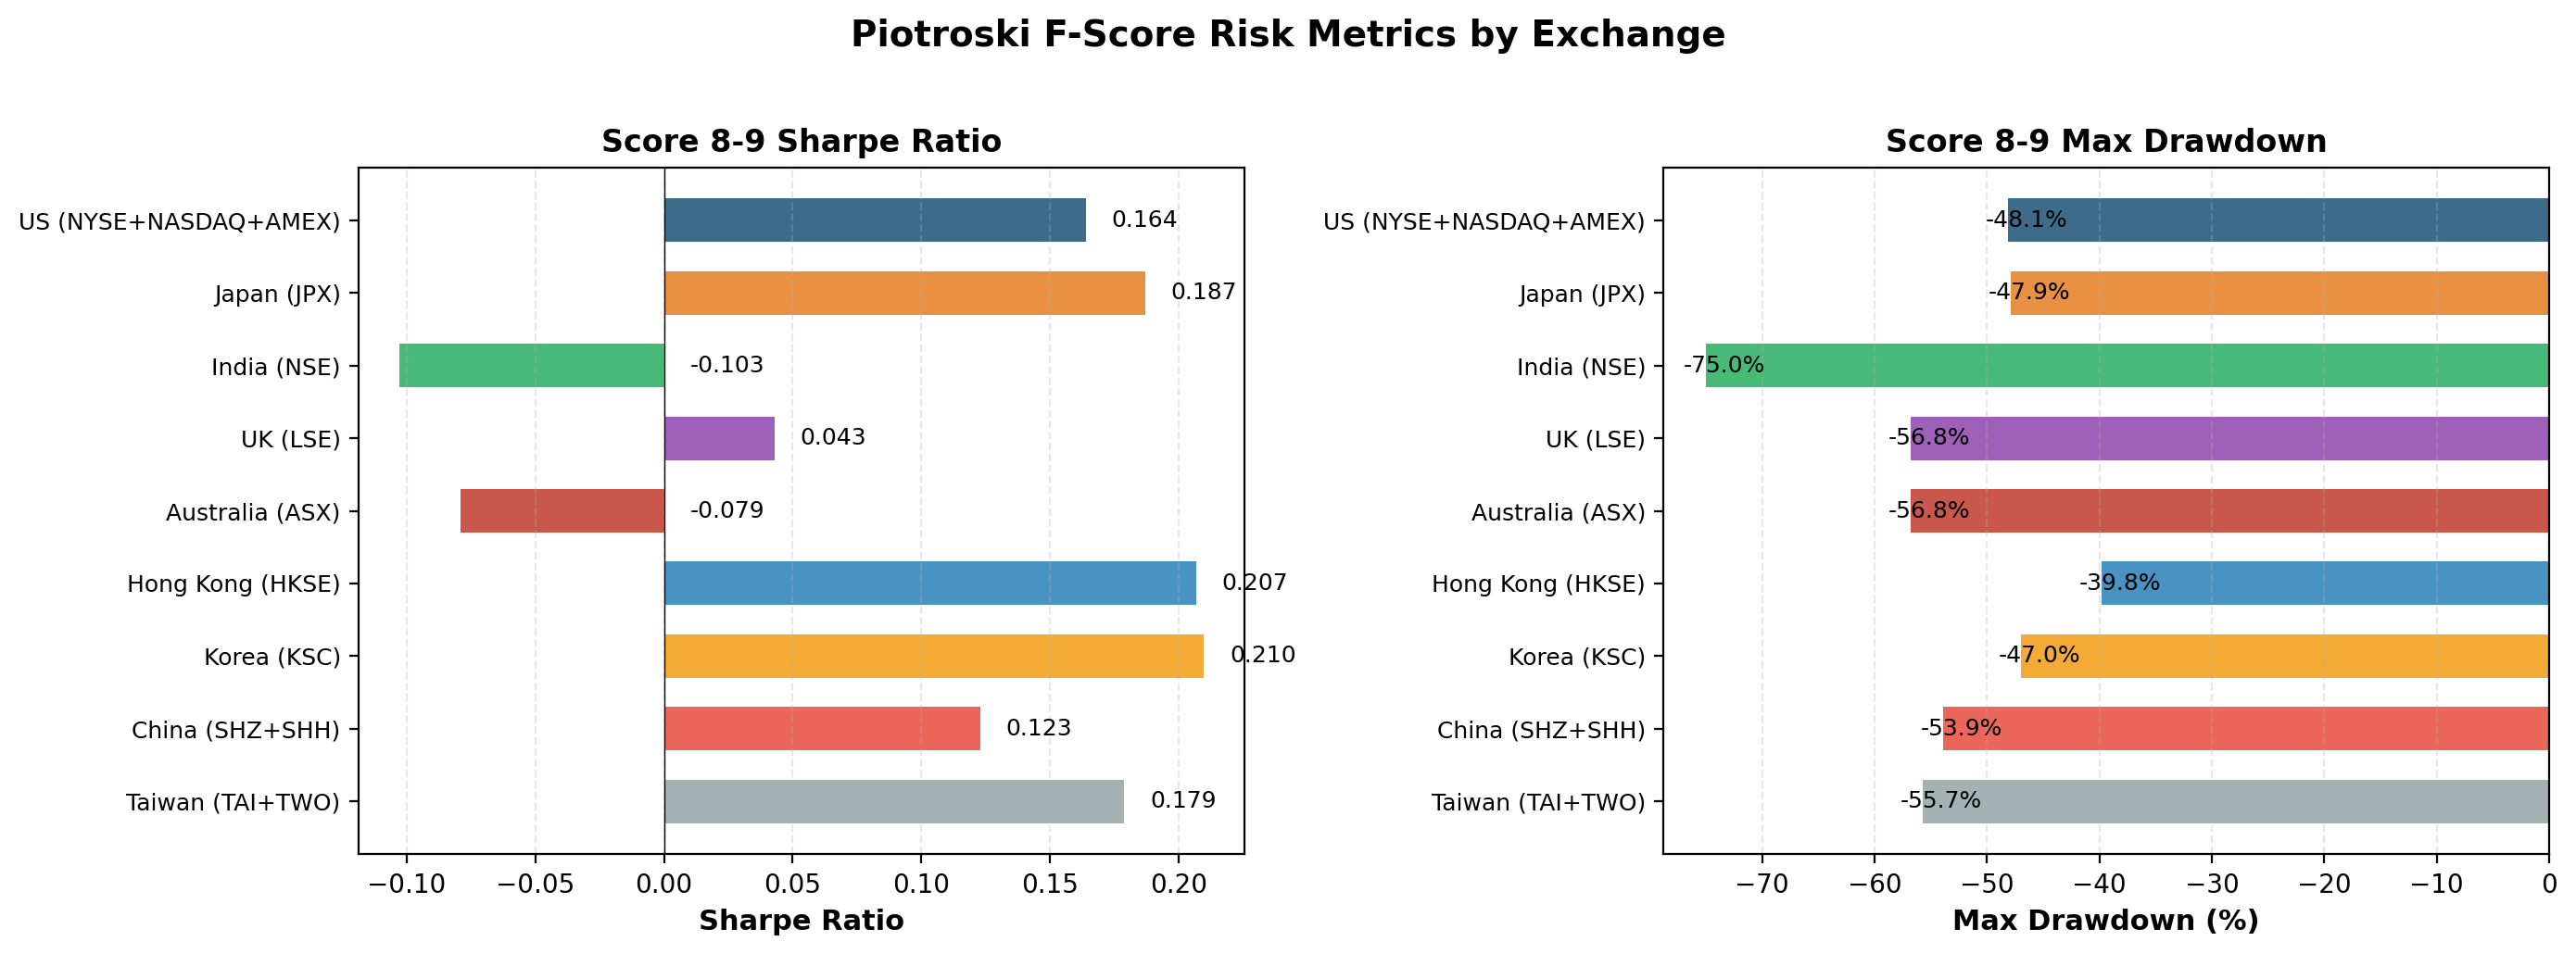
| Korea (KSC) | 10.0% | 1.9% | +8.1% | 0.210 | KOSPI | 4.4% | +5.60% |
| Sweden (STO) | 5.9% | -0.5% | +6.4% | 0.113 | OMX | 4.6% | +1.26% |
| Hong Kong (HKSE) | 7.6% | 2.1% | +5.5% | 0.207 | Hang Seng | 2.7% | +4.87% |
| US | 6.1% | 4.9% | +1.2% | 0.164 | S&P 500 | 9.4% | -3.31% |
| Japan (JPX) | 4.4% | 3.2% | +1.1% | 0.187 | Nikkei 225 | 3.1% | +1.31% |
| Canada (TSX) | -1.8% | -1.6% | -0.2% | -0.135 | TSX Comp. | 4.6% | -6.40% |
| China (SHH+SHZ) | 6.6% | 7.7% | -1.1% | 0.123 | SSE Comp. | 3.7% | +2.95% |
| Norway (OSL) | 4.2% | 5.4% | -1.2% | 0.043 | Oslo All-Share | 10.5% | -6.35% |
| Taiwan (TAI+TWO) | 5.0% | 6.4% | -1.4% | 0.179 | TAIEX | 9.0% | -4.02% |
| UK (LSE) | 4.8% | 8.3% | -3.5% | 0.043 | FTSE 100 | 1.3% | +3.48% |
| India (NSE) | 2.2% | 9.4% | -7.2% | -0.103 | Sensex | 10.9% | -8.67% |

Nine markets show a positive spread. Six show a negative spread. The range spans +12.0% (Thailand) to -7.2% (India).
Ten exchanges (Thailand, South Africa, Germany, Switzerland, Korea, Sweden, Hong Kong, Japan, UK, China) show positive excess returns for Score 8-9 vs their local benchmark. Five exchanges (US, Canada, Norway, Taiwan, India) show negative excess returns.
Three Patterns in the Data
1. The F-Score works best in mid-sized European and Asian markets
The clearest positive spreads come from Thailand (+12.0%), South Africa (+10.9%), Germany (+10.5%), Switzerland (+10.0%), and Korea (+8.1%). What these markets share: medium-sized value universes, less institutional crowding than the US or UK, and lower analyst coverage of small/mid-cap value names. The nine-question checklist captures information the market hasn't fully arbitraged.
Hong Kong (+5.5%) and Sweden (+6.4%) also produce positive spreads with the same structural story.
2. Large efficient markets compress the signal
The US (+1.2%) and Japan (+1.1%) show small positive spreads with positive avoidance alpha and negative selection alpha. Pattern: Score 0-2 is correctly identified as a value trap, but Score 8-9 is already priced. The F-Score works as a floor, not a ceiling.
In the US specifically, Score 8-9 underperforms the S&P 500 by 3.31% per year. The selection signal doesn't produce alpha vs an index fund in this universe.
3. Growth-driven or commodity-heavy markets invert the signal
India (-7.2%), UK (-3.5%), Taiwan (-1.4%), Norway (-1.2%), China (-1.1%), Canada (-0.2%) all show negative spreads. Two common mechanisms:
- Commodity cycles (UK, Norway, Canada): mining and energy stocks score high near peaks, low near troughs. The F-Score systematically buys at the wrong end of the cycle.
- Growth/turnaround dynamics (India, China, Taiwan): companies with deteriorating current fundamentals catch tailwinds (capex cycles, sector rotation, macro recovery) that lift them more than improving fundamentals can lift Score 8-9 names.
India is the most extreme. Score 8-9 returned 2.2% with a negative Sharpe ratio (-0.103) and trails the Sensex by -8.67%. Both selection and avoidance alphas are negative.
Avoidance vs Selection: A Global Pattern
We decomposed the F-Score alpha into selection (Score 8-9 vs All Value) and avoidance (All Value vs Score 0-2) for each exchange.
| Exchange | Selection Alpha | Avoidance Alpha |
|---|---|---|
| Switzerland | -1.8% | +11.8% |
| Thailand | +0.8% | +11.2% |
| Norway | -12.5% | +11.3% |
| Sweden | -3.9% | +10.2% |
| South Africa | +1.3% | +9.6% |
| Germany | +5.5% | +5.0% |
| Taiwan | -10.3% | +8.9% |
| Canada | -9.0% | +8.8% |
| Korea | +0.1% | +8.0% |
| Japan | -5.5% | +6.7% |
| Hong Kong | +1.6% | +4.0% |
| US | -1.6% | +2.8% |
| China | +1.0% | -2.1% |
| India | -4.1% | -3.0% |
| UK | -2.1% | -1.3% |
The avoidance signal is positive on 12 of 15 exchanges. Even in markets where Score 8-9 doesn't beat the broad value universe, filtering out Score 0-2 stocks usually helps. The exceptions are India, UK, and China.
The selection signal is positive on only 6 of 15 markets (Germany, Hong Kong, South Africa, Korea, Thailand, China). In the rest, Score 8-9 underperforms the unfiltered value universe.
The most important cross-market finding: the F-Score's value is overwhelmingly in telling you what NOT to buy. Use it as a floor (skip Score 0-2). Don't use it as a ceiling (restrict to Score 8-9) unless you're in one of the markets where selection actually adds alpha.
Why the Signal Varies
Three structural factors explain most of the cross-market variation.
Market structure and cyclicality. UK, Norway, and Canada have value universes dominated by mining, energy, and financials. These cyclical sectors produce financial statements that lag the business cycle. The F-Score's backward-looking criteria systematically buy at the top and avoid at the bottom of commodity cycles.
Information efficiency. The US has a Sharpe of 0.164 on Score 8-9 despite a small positive spread vs Score 0-2. High analyst coverage and efficient pricing mean the F-Score's information is already priced in. There's less alpha to capture. Markets with thinner coverage (Thailand, South Africa, Korea, Switzerland) show wider spreads and more selection alpha.
Growth vs value market character. India's market rewards growth and momentum. Companies with deteriorating fundamentals that catch a growth catalyst can produce multi-bagger returns. The F-Score explicitly avoids these stocks. In contrast, Korea and Japan have more value-oriented market structures where fundamental improvement is rewarded incrementally.
Portfolio Construction Implications
Based on fifteen markets and 25-28 years of data:
Use the F-Score as a floor, not a ceiling. Set a minimum threshold of 3-5 on any value screen. This captures the avoidance alpha (positive on 12 of 15 exchanges) without concentrating into Score 8-9 (where selection alpha is positive on only 6 of 15).
Don't apply it uniformly across geographies. A Score 8 in Germany means something different than a Score 8 in India. The same nine binary tests interact with different market structures, sector compositions, and information environments.
Weight the local benchmark, not just the spread. UK's -3.5% spread looks disappointing until you see Score 8-9 still beats the FTSE 100 by +3.48%. The US's +1.2% spread is positive but Score 8-9 trails SPY by -3.31%. Cross-market comparisons need both numbers.
The avoidance signal scales better than the selection signal. Removing Score 0-2 stocks works on 12 of 15 exchanges (India, UK, China are the exceptions). Restricting to Score 8-9 works on 6. A simple "avoid the bottom" rule has near-universal application. A "buy the top" rule does not.
Best markets for selection alpha: Germany, South Africa, Thailand, Korea, Hong Kong, China. These are where Score 8-9 actually adds value beyond just avoiding the worst.
Limitations
Different time periods. Backtests range from 25 years (Korea) to 28 years (US). Different start dates mean different market cycles covered.
Local currency returns. All returns are in exchange-local currency. Cross-market comparisons don't account for currency movements, which can be substantial over 25+ years.
Varying portfolio depth. Average holdings post-2010 range from 5 (Korea) to 50 (US). Thin portfolios produce more volatile results that are harder to interpret.
Transaction costs may underestimate emerging markets. The backtest applies 0.1-0.5% size-tiered costs everywhere. Real-world trading in Thailand, Korea, Hong Kong small caps may incur higher slippage.
Value universe definition. Bottom P/B quintile means different things in different markets. Japan's P/B distribution has a structural downward bias. India's includes many growth companies that happen to have negative book equity.
Data quality. Backtests in this run use phantom-oscillation removal and per-stock return filtering to suppress FMP adjClose artifacts. ASX, SAO, SGX are excluded entirely due to severity of data issues. Other markets may have residual artifacts that affect specific years.
Individual Exchange Write-Ups
- US: 28 Years of US Data on a 9-Point Quality Checklist
- Japan: The Avoidance Signal Carries the Weight
- India: The Score That Doesn't Work
- UK: Beats the FTSE, Loses to Score 0-2
- Hong Kong: A Modest But Real Signal
Reproduce the Backtests
Full backtest code is on GitHub: ceta-research/backtests
git clone https://github.com/ceta-research/backtests.git
cd backtests
pip install -r requirements.txt
export CR_API_KEY="your_key_here"

# Run on any supported exchange
python3 piotroski/backtest.py --preset japan --verbose
python3 piotroski/backtest.py --preset india --verbose
python3 piotroski/backtest.py --preset germany --verbose
python3 piotroski/backtest.py --preset thailand --verbose
Data: Ceta Research, FMP financial data. 15 exchanges (US, JPX, NSE, LSE, HKSE, KSC, SHH+SHZ, TAI+TWO, TSX, XETRA, STO, SIX, OSL, SET, JNB), 25-28 years, annual rebalance, equal weight, value universe (bottom P/B quintile, exchange-specific market cap filters). Next-day close (MOC) execution. Data quality guards: phantom holiday rows removed, individual stock returns filtered for adjClose artifacts. ASX, SAO, SGX excluded for fatal data quality. Past performance does not guarantee future results. Educational content only, not investment advice.


