
Piotroski F-Score Backtest: What 28 Years of US Data Actually Show
We ran the Piotroski F-Score on US value stocks from 1997 to 2024. Score 8-9 returned 6.1% vs 9.4% for SPY. Selection alpha is -1.6% per year. Avoidance alpha is +2.8%. The F-Score works as a floor (skip Score 0-2) but not as a ceiling in large-cap US.


An accounting professor created a nine-point checklist to separate winning value stocks from future bankruptcies. We ran it on US equities from 1997 to 2024. The high-quality basket (Score 8-9) returned 6.1% annually with a Sharpe of 0.164. The S&P 500 returned 9.4% over the same window. The F-Score in large-cap US value doesn't beat the market on raw returns or on risk-adjusted returns. The avoidance signal still works: skipping Score 0-2 stocks saves you from a -71.9% max drawdown. But the selection signal does not deliver alpha here.
Contents
- Method
- What is the Piotroski F-Score?
- The Screens
- Simple F-Score Screen
- Advanced Screen (Value + Quality)
- What We Found
- The headline: the F-Score loses to the S&P 500 in large-cap US value.
- Avoidance vs selection alpha
- Score 8-9 vs the S&P 500
- The All Value baseline tells you the universe is the problem
- Decade breakdown
- Portfolio concentration
- When It Works and When It Struggles
- Run This Screen Yourself
- Reproduce the backtest
- Limitations
- References
Data: FMP financial data warehouse, 1997–2024. Updated May 2026.
Method
| Parameter | Value |
|---|---|
| Data source | FMP via Ceta Research warehouse |
| Universe | US-listed (NYSE, NASDAQ, AMEX), bottom 20% by price-to-book, market cap > $1B |
| Period | 1997-2024 (28 years) |
| Rebalancing | Annual (April 1, after annual reports) |
| Weighting | Equal weight |
| Transaction costs | 0.1-0.5% per trade (size-tiered) |
| Execution | Next-day close (MOC) |
| Benchmark | S&P 500 (SPY) |
| Data quality | Phantom holiday rows and 3-5x adjClose oscillations removed before backtest. Individual stock returns filtered: entry price > $1, single-period return < 200%. |
Piotroski scores computed from raw financial statements (income statement, balance sheet, cash flow statement) at each rebalance date. No pre-computed scores used in the backtest. Point-in-time data to avoid look-ahead bias.
What is the Piotroski F-Score?
Joseph Piotroski published his research in 2000 while at the University of Chicago. He wanted to answer a specific question: among cheap stocks, which ones recover and which ones fail?
His answer: a nine-point binary checklist using only financial statement data. One point for each criterion met.
Profitability (4 points): 1. Positive net income 2. Positive operating cash flow 3. Return on assets improved from last year 4. Cash flow exceeds net income (quality earnings)
Leverage and Liquidity (3 points): 5. Long-term debt decreased 6. Current ratio improved 7. No new shares issued (no dilution)
Operating Efficiency (2 points): 8. Gross margin improved 9. Asset turnover improved
Score 9 = fundamentally strong. Score 0 = red flags across the board.
The Screens
Simple F-Score Screen
-- Piotroski F-Score: Simple Screen
-- Run at: cetaresearch.com/data-explorer

SELECT
    s.symbol,
    p.companyName,
    s.piotroskiScore,
    f.priceToBookRatioTTM as price_to_book,
    k.marketCap / 1000000000 as market_cap_billions
FROM scores s
JOIN key_metrics_ttm k ON s.symbol = k.symbol
JOIN financial_ratios_ttm f ON s.symbol = f.symbol
JOIN profile p ON s.symbol = p.symbol
WHERE
    s.piotroskiScore >= 8
    AND k.marketCap > 1000000000
    AND p.exchange IN ('NYSE', 'NASDAQ', 'AMEX')
ORDER BY s.piotroskiScore DESC, f.priceToBookRatioTTM ASC
LIMIT 50
Finds all US-listed stocks scoring 8 or 9 with market cap above $1B. The pre-calculated score saves you from running nine separate queries.
Run this query on Ceta Research
Advanced Screen (Value + Quality)
-- Piotroski F-Score: Value + Quality Screen
-- Run at: cetaresearch.com/data-explorer

SELECT
    s.symbol,
    p.companyName,
    s.piotroskiScore,
    f.priceToBookRatioTTM as price_to_book,
    f.priceToEarningsRatioTTM as pe_ratio,
    k.currentRatioTTM,
    f.debtToEquityRatioTTM as debt_to_equity,
    k.returnOnEquityTTM * 100 as roe_pct,
    k.marketCap / 1000000000 as market_cap_billions
FROM scores s
JOIN key_metrics_ttm k ON s.symbol = k.symbol
JOIN financial_ratios_ttm f ON s.symbol = f.symbol
JOIN profile p ON s.symbol = p.symbol
WHERE
    s.piotroskiScore >= 7
    AND f.priceToBookRatioTTM > 0
    AND f.priceToBookRatioTTM < 1.5
    AND f.priceToEarningsRatioTTM > 0
    AND f.priceToEarningsRatioTTM < 20
    AND k.marketCap > 1000000000
    AND p.exchange IN ('NYSE', 'NASDAQ', 'AMEX')
    AND p.sector NOT IN ('Financial Services')
ORDER BY s.piotroskiScore DESC, f.priceToBookRatioTTM ASC
LIMIT 30
Adds price-to-book and P/E filters to match Piotroski's original value stock focus. Excludes financials where book value comparisons are less meaningful.
Run this query on Ceta Research
What We Found
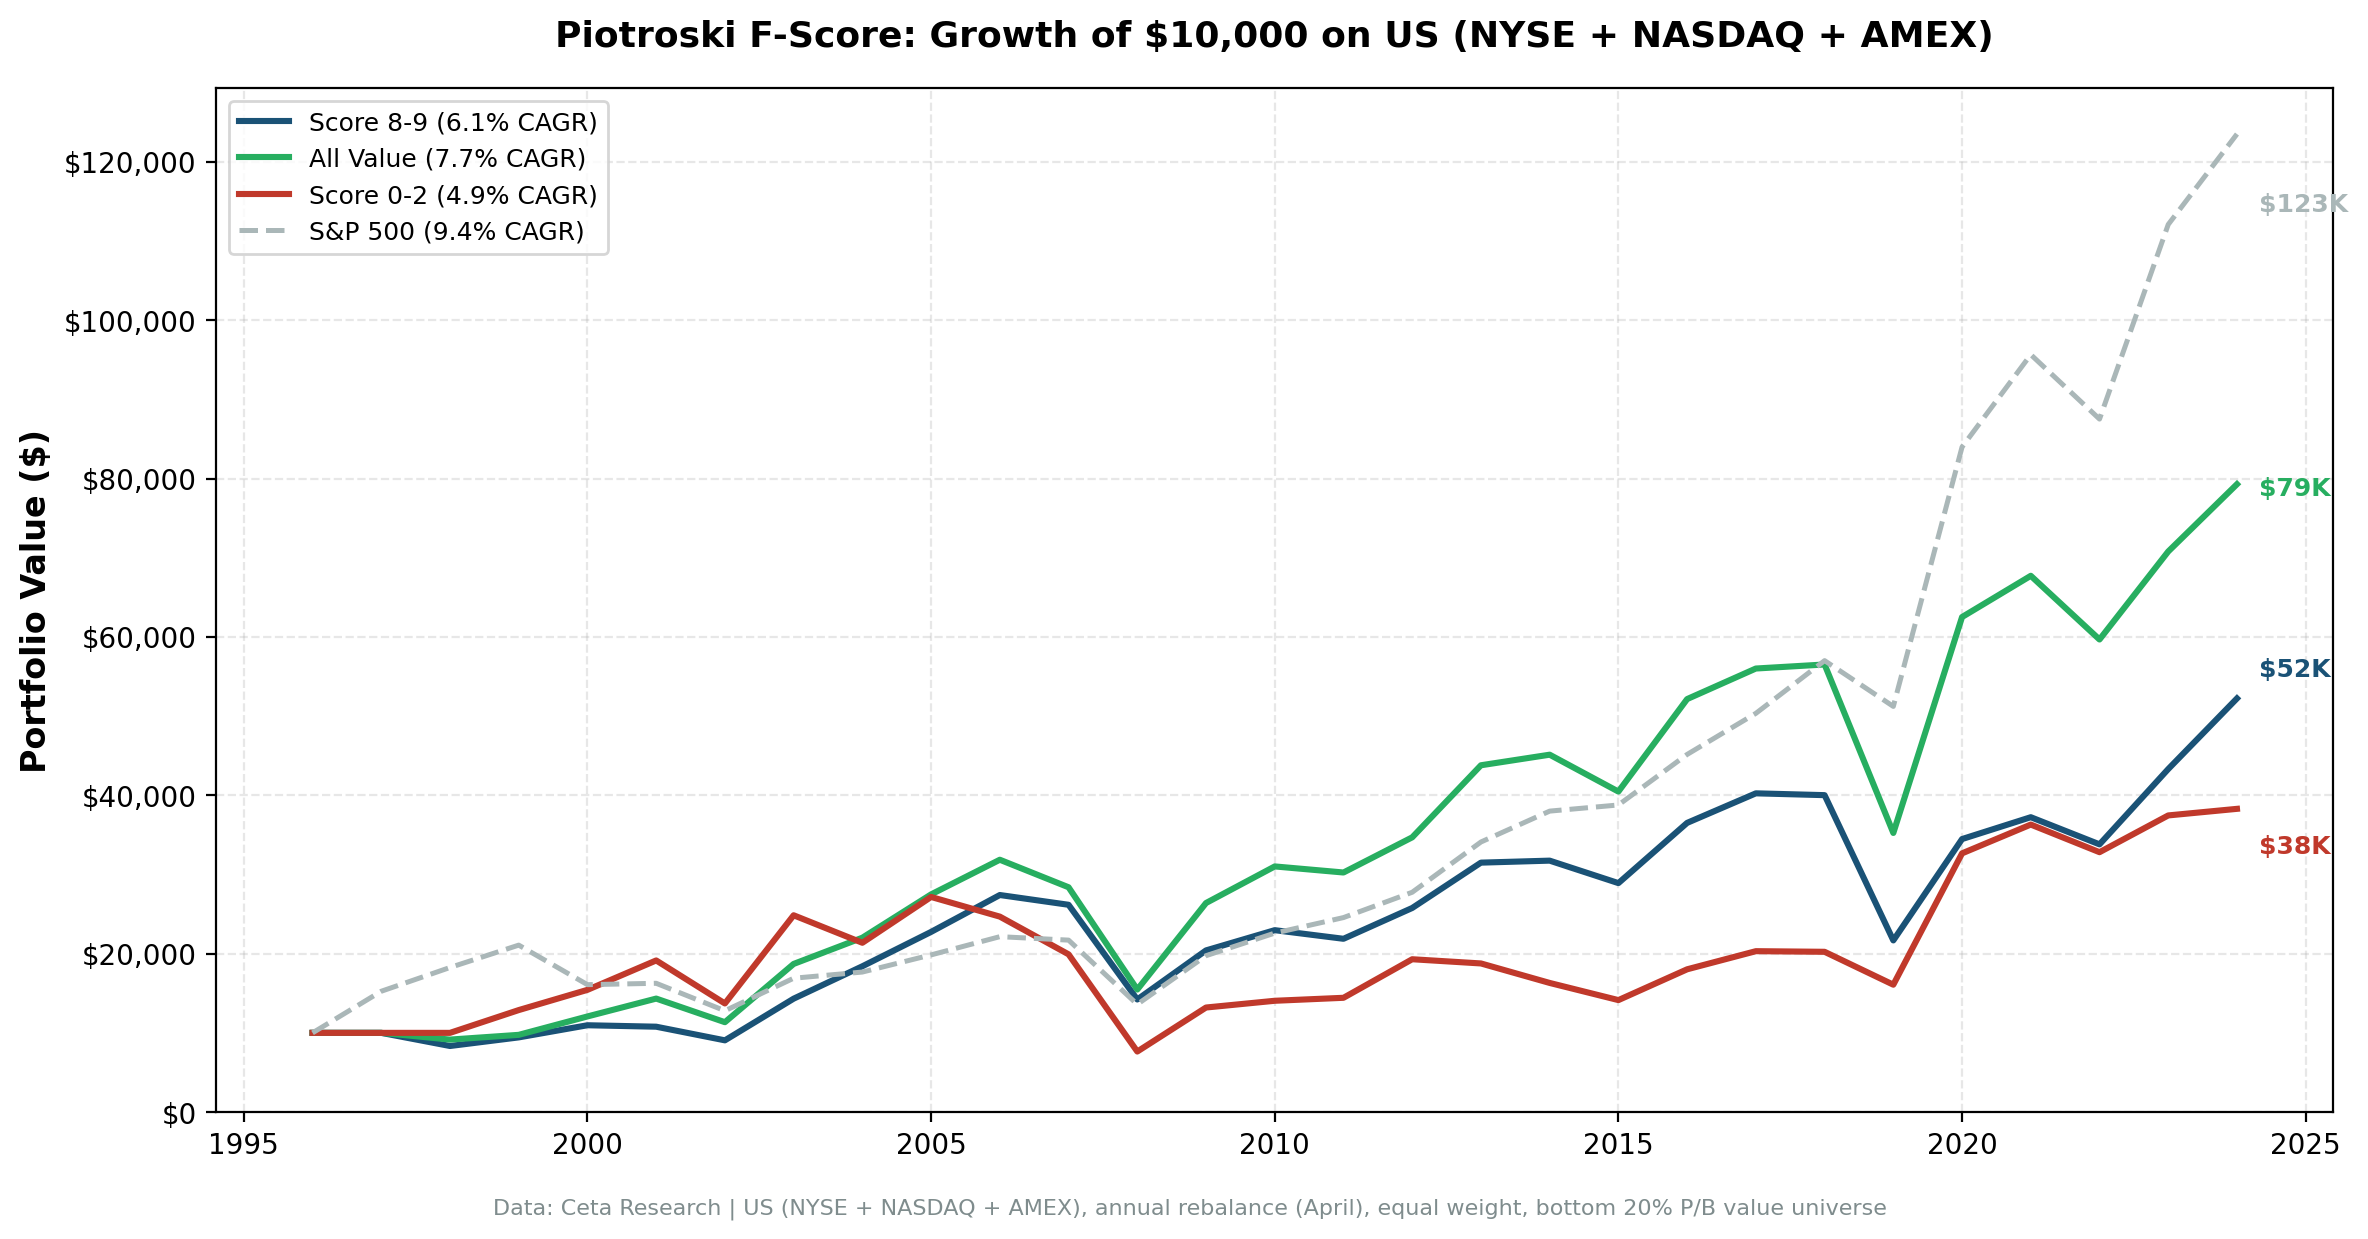
Growth of $1: Score 8-9 (high quality value), Score 0-2 (low quality value), All Value (bottom 20% P/B), and S&P 500. 1997-2024.
The headline: the F-Score loses to the S&P 500 in large-cap US value.
Score 8-9 stocks returned 6.1% annually. The S&P 500 returned 9.4%. That's -3.3 percentage points per year over 28 years. Compounded, $1 in Score 8-9 grew to $5.22 vs $12.35 in SPY. The selection signal does not produce alpha in this universe.
| Portfolio | CAGR | Volatility | Sharpe | Sortino | Max Drawdown | % Negative Years |
|---|---|---|---|---|---|---|
| Score 8-9 | 6.1% | 24.8% | 0.164 | 0.289 | -48.1% | 36% |
| All Value | 7.7% | 27.8% | 0.204 | 0.425 | -51.4% | 29% |
| Score 0-2 | 4.9% | 33.8% | 0.086 | 0.185 | -71.9% | 39% |
| S&P 500 | 9.4% | 21.5% | 0.343 | 0.711 | -39.3% | 21% |
The Score 8-9 vs Score 0-2 spread is +1.2% per year. Score 8-9 wins, but the gap is small.
Three observations matter more than the headline:
First: Score 8-9 still beats Score 0-2 on risk-adjusted returns. Sharpe of 0.164 vs 0.086. Sortino of 0.289 vs 0.185. The high-quality basket runs at lower volatility (24.8% vs 33.8%) and has a much smaller max drawdown (-48.1% vs -71.9%). The F-Score is sorting cheap stocks correctly within the value universe.
Second: the avoidance signal is +2.8%. Removing Score 0-2 stocks from the value universe lifted CAGR from 4.9% to 7.7%. The F-Score's most reliable role is telling you what to skip.
Third: the selection signal is -1.6%. Restricting to Score 8-9 stocks dropped CAGR from 7.7% (all value) to 6.1%. The top tier of F-Score winners isn't where the value-universe alpha lives.
Avoidance vs selection alpha
- Selection alpha (Score 8-9 vs All Value): -1.6% per year
- Avoidance alpha (All Value vs Score 0-2): +2.8% per year
The pattern is clear. The F-Score's value in large-cap US is in the floor it sets, not the ceiling. Buying only Score 8-9 stocks costs you alpha. Avoiding Score 0-2 stocks captures alpha.
Score 8-9 vs the S&P 500
| Metric | Value |
|---|---|
| Excess CAGR | -3.31% |
| Up Capture | 85.0% |
| Down Capture | 101.9% |
| Beta | 0.794 |
| Alpha | -1.79% |
Score 8-9 captured 85% of the SPY upside but 102% of the downside. The negative alpha (-1.79%) means after adjusting for beta, the portfolio still underperformed. This is the opposite of what most readers expect from a quality-tilted value screen.
The All Value baseline tells you the universe is the problem
The unfiltered value universe (bottom 20% P/B, market cap > $1B) returned 7.7%. SPY returned 9.4%. The value premium isn't showing up in large-cap US over this window. The F-Score didn't break here. The universe did.
Decade breakdown
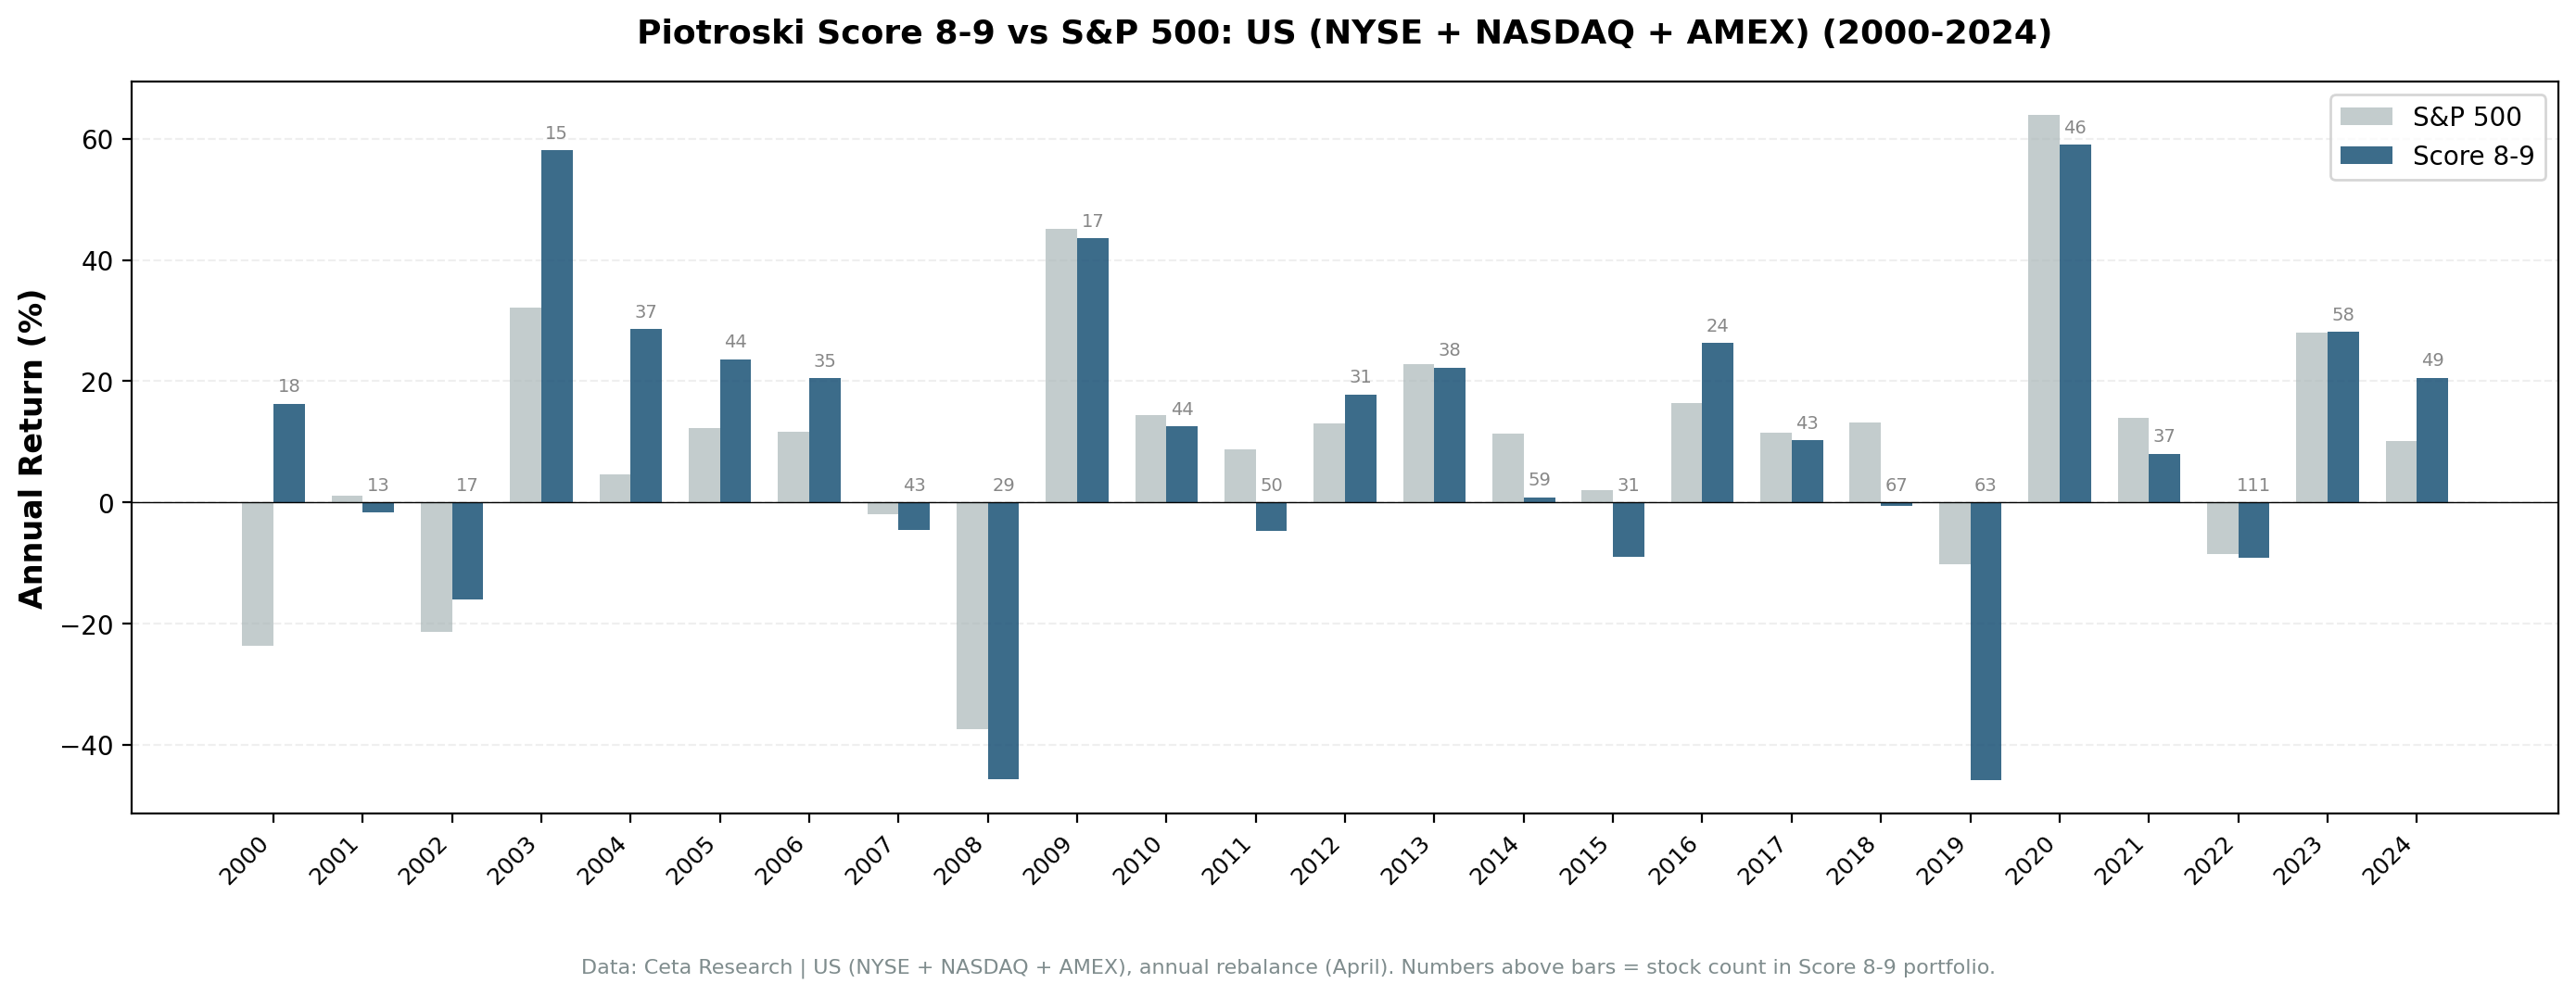
Annual returns by year. The spread between Score 8-9 and Score 0-2 varies widely. Two of four decades favor Score 0-2.
| Decade | Score 8-9 Avg | Score 0-2 Avg | Spread |
|---|---|---|---|
| 1990s | -1.2% | 9.6% | -10.8% |
| 2000s | 12.3% | 9.2% | +3.0% |
| 2010s | 3.0% | 3.3% | -0.3% |
| 2020-25 | 21.3% | 24.2% | -2.9% |
The 2000s is the only decade with a clear positive spread (+3.0%). In the 1990s, Score 0-2 beat Score 8-9 by 10.8 points. The 2010s were a wash. The 2020s favored Score 0-2 because beaten-down value stocks bounced harder coming out of COVID.
Portfolio concentration
Post-2010, the Score 8-9 basket averaged about 50 stocks per year. Earlier decades had thinner coverage. The portfolio carries meaningful concentration risk in the early sample, less so post-2010.
When It Works and When It Struggles
Works as an avoidance filter: - Removing Score 0-2 stocks lifts the value-universe CAGR by 2.8% per year. - Score 0-2 stocks experienced a -71.9% max drawdown. Avoiding that hole alone justifies the screen.
Struggles as a selector: - Score 8-9 stocks trail the unfiltered value universe by -1.6% per year. - Speculative recoveries (1990s, 2020-22) reward beaten-down low-score stocks more than improving high-score ones.
The market cap constraint matters. Piotroski's original research focused on small and micro-cap value stocks, where the F-Score effect was strongest. Our $1B market cap threshold restricts the universe to large-cap value, where the effect is documented to be weakest. Institutional coverage, analyst attention, and market efficiency all reduce the informational advantage of the F-Score in large caps.
Run This Screen Yourself
The current Piotroski screen for US stocks is live on Ceta Research:
cetaresearch.com/data-explorer
The screen runs on live FMP data. Results update as new annual filings come in.
Reproduce the backtest
Full backtest code is on GitHub: ceta-research/backtests
git clone https://github.com/ceta-research/backtests.git
cd backtests
pip install -r requirements.txt
export CR_API_KEY="your_key_here"

# Run the Piotroski screen on current data
python3 piotroski/screen.py

# Run the full backtest
python3 piotroski/backtest.py --preset us --verbose
Limitations
Large-cap bias. The $1B market cap floor puts this squarely in large-cap territory. Piotroski's original edge was strongest in small and micro caps where information asymmetry is greatest. Our results understate the effect as documented in the academic literature.
Backward-looking. The F-Score measures what happened last year. It doesn't predict disruption, regulatory changes, or competitive shifts.
Equal weighting of criteria. A 0.1% improvement in gross margin gets the same point as doubling cash flow. Not all improvements are equal.
Underperformance vs SPY. Score 8-9 trails the S&P 500 by 3.31% per year. If you can buy an index fund, the F-Score doesn't help your CAGR in large-cap US.
Concentration risk. With smaller stock counts in earlier years, single-stock outcomes can move the annual return substantially.
No sector balancing. The screen doesn't control for sector concentration. Some years may over-weight a single industry.
References
- Piotroski, J. (2000). "Value Investing: The Use of Historical Financial Statement Information to Separate Winners from Losers." Journal of Accounting Research, 38 (suppl.), 1-41.
- Asness, C., Frazzini, A. & Pedersen, L. (2019). "Quality Minus Junk." Review of Accounting Studies, 24(1), 34-112.
- Fama, E. & French, K. (1993). "Common Risk Factors in the Returns on Stocks and Bonds." Journal of Financial Economics, 33(1), 3-56.
Data: Ceta Research, FMP financial data. US exchanges (NYSE, NASDAQ, AMEX). Backtest: 1997-2024 (28 years), annual rebalance (April 1), equal weight, value universe (bottom 20% P/B, market cap > $1B). Transaction costs: 0.1-0.5% per trade (size-tiered). Next-day close (MOC) execution. Data quality guards: phantom holiday rows removed, individual stock returns filtered for adjClose artifacts.
Past performance does not guarantee future results. This is educational content, not investment advice.


