
P/E Mean Reversion Across 13 Global Markets: The West Works, The East Doesn't

We tested sector-relative P/E mean reversion on 13 global stock markets from 2000 to 2025. The signal: buy when a stock's P/E drops below 60% of its sector median, filtered for quality (ROE > 8%, D/E < 2). The result splits cleanly along geography. Western markets delivered positive excess returns. Asian markets — Japan, China, Hong Kong, Taiwan, Korea, Thailand — failed consistently, with some delivering catastrophic underperformance. The strategy also struggled in Canada and Sweden despite reasonable absolute returns. The dividing line comes down to a single question: are sector-relative discounts temporary or structural?
Contents
- Method
- Full Results: 13 Exchanges
- The Four That Beat SPY
- The Failures: Why Asia Doesn't Work
- Hong Kong: Worst of all 13 markets
- Taiwan: 60% cash, negative returns
- Korea: Chaebol discount is real
- China: Zero cash, still fails
- Japan: Structurally better, still negative
- The Middle Group: Canada, Sweden, Switzerland
- Key Patterns
- Why the West works
- Cash rate as a market quality signal
- The sector median anchor test
- Limitations
- Conclusion
Data: FMP financial data warehouse, 2000–2025. Updated March 2026.
Method
Data source: Ceta Research (FMP financial data warehouse) Signal: Stock P/E < 60% of sector median P/E, P/E 3-50, ROE > 8%, D/E < 2.0 Portfolio: Top 30 by discount depth, equal weight, annual rebalance (January) Period: 2000-2025 (25 years) Benchmark: S&P 500 Total Return (SPY, USD) Cash rule: Hold cash if fewer than 10 stocks qualify
Market cap thresholds vary by exchange (US $1B, UK £500M, India ₹50B, etc.) to reflect local liquidity conditions.
Explore the current global sector discount landscape: cetaresearch.com/data-explorer?q=jd4ZYBBDSu
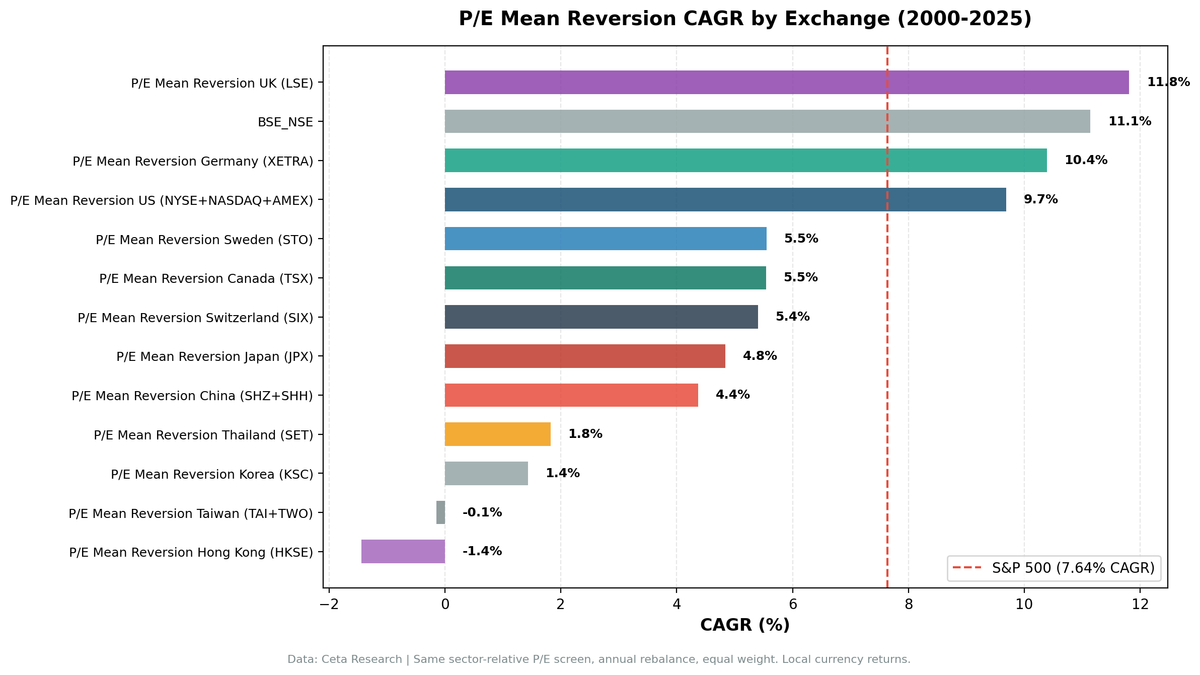
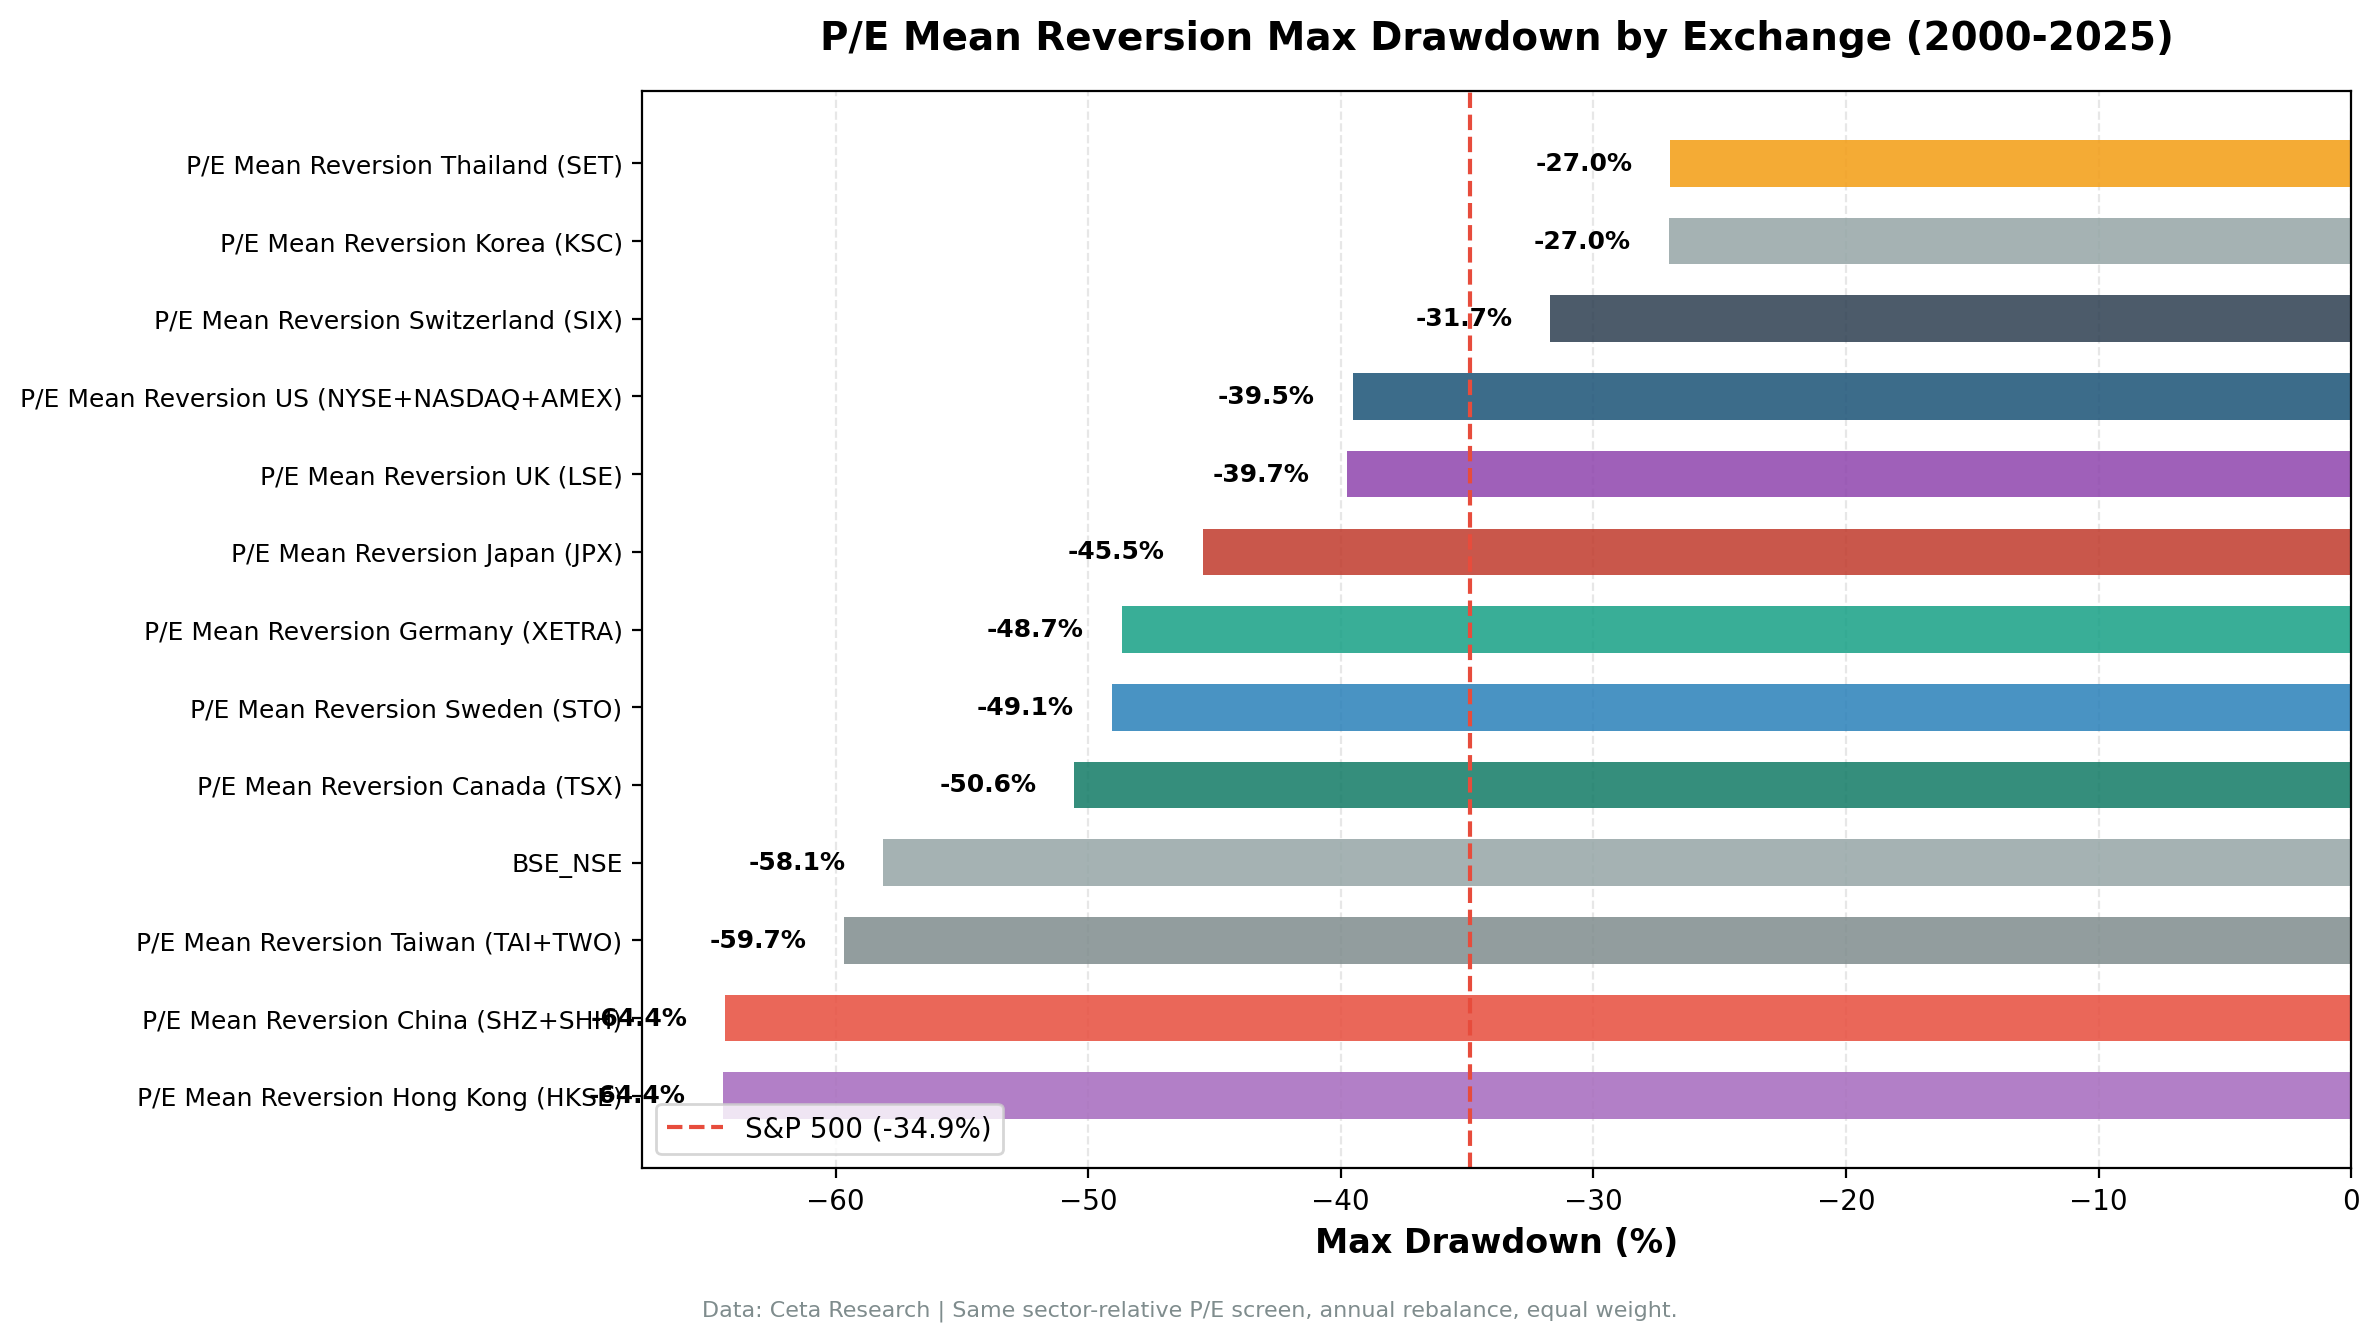
Full Results: 13 Exchanges

| Exchange | CAGR | Excess vs SPY | Sharpe | MaxDD | Cash% | Avg Stocks |
|---|---|---|---|---|---|---|
| UK (LSE) | 11.67% | +4.03% | 0.401 | -39.74% | 0% | 15.6 |
| India (NSE) | 9.96% | +2.32% | 0.099 | -62.16% | 24% | 25.3 |
| Germany (XETRA) | 10.20% | +2.56% | 0.403 | -48.68% | 0% | 18.7 |
| US (NYSE/NASDAQ/AMEX) | 9.87% | +2.23% | 0.349 | -38.82% | 0% | 21.8 |
| Switzerland (SIX) | 5.92% | -1.72% | 0.325 | -34.31% | 16% | 11.8 |
| Canada (TSX) | 5.68% | -1.96% | 0.160 | -50.56% | 16% | 17.3 |
| Sweden (STO) | 5.55% | -2.09% | 0.146 | -49.07% | 40% | 14.3 |
| Japan (JPX) | 4.66% | -2.98% | 0.259 | -45.11% | 32% | 23.5 |
| China (SHZ/SHH) | 4.07% | -3.57% | 0.035 | -63.99% | 0% | 22.5 |
| Thailand (SET) | 2.14% | -5.50% | -0.033 | -26.96% | 52% | 16.8 |
| Korea (KSC) | 1.60% | -6.04% | -0.093 | -27.01% | 44% | 22.4 |
| Taiwan (TAI/TWO) | -0.15% | -7.79% | -0.075 | -59.66% | 60% | 16.1 |
| Hong Kong (HKSE) | -1.51% | -9.15% | -0.193 | -63.88% | 20% | 22.1 |
SPY benchmark: 7.64% CAGR, -34.90% MaxDD
Note on local benchmarks: the table above uses SPY as a uniform cross-market benchmark. When benchmarked against local indices (Sensex, FTSE 100, DAX, Nikkei, etc.), the picture shifts. India, which beats SPY by +2.32%, trails the Sensex by 1.45%. This is because the Sensex itself returned 11.4% CAGR over 25 years. Markets where local indices underperformed SPY (UK, Germany, Japan, Sweden, Switzerland) show higher local excess. See individual regional blogs for local-benchmark results.
The Four That Beat SPY
All four outperformers are in the West (or India, which shares enough structural characteristics to qualify). Three of the four have zero cash periods, meaning the signal always finds qualifying stocks. The UK leads at +4.03% excess, Germany at +2.56%, the US at +2.23%.
Germany's result is worth noting. XETRA delivers the highest Sharpe (0.403) of any exchange tested, better than the US (0.349) and UK (0.401). That's a meaningful finding. German equities are widely considered difficult for quant strategies due to export-cycle sensitivity, but the sector-relative P/E signal cuts through that. When a German industrial or consumer stock trades at a 40%+ discount to its domestic sector peers with solid ROE, it tends to recover. The signal isn't asking whether Germany is cheap globally. It's asking whether a specific company is cheap relative to its own sector.
India is the outlier here. It beats SPY by +2.32% but carries significant volatility (Sharpe 0.099, MaxDD -62.16%) and 24% cash periods, largely because FMP data is sparse pre-2005. The effective test period for India starts around 2006. Post-2006, the signal often works. But note: benchmarked against the Sensex, India trails by 1.45%. The Sensex itself returned 11.4% CAGR over 25 years. A strategy at 9.96% beats SPY while losing to its own market index. India's corporate sector has enough depth for meaningful sector medians, but the local benchmark context matters.
The Failures: Why Asia Doesn't Work
Hong Kong: Worst of all 13 markets
HKSE delivers -9.15% excess and a -1.51% absolute CAGR. The drawdown hits -63.88%. That's not a case of a strategy that barely missed. That's the strategy actively destroying capital over 25 years.
Hong Kong's problem is structural. A large portion of HKSE-listed companies are mainland Chinese businesses that trade at persistent discounts to their sector peers for reasons that don't resolve. Governance concerns, opaque financials, related-party transactions, and limited institutional oversight mean that "cheap relative to sector" often stays cheap. The discount is a feature of the stock, not a temporary sentiment issue.
Taiwan: 60% cash, negative returns
Taiwan spends 60% of all periods in cash. The signal barely fires. When it does, absolute returns are negative (-0.15% CAGR, -7.79% excess). The Taiwanese market is dominated by the semiconductor ecosystem, which creates an unusual valuation hierarchy. TSMC trades at or above sector median by design. Smaller fabs and component suppliers trade at persistent discounts because TSMC's premium is structural and permanent. The sector median P/E gets anchored by TSMC, making everything else look cheap, but that relative cheapness doesn't revert.
Korea: Chaebol discount is real
Korea (KSC) delivers 1.60% CAGR and -6.04% excess, with 44% cash. Korean chaebols — Samsung, SK, Hyundai, LG group companies — structurally trade at a discount to their sector peers. Samsung Electronics is consistently cheaper than the global tech sector median. This is the "Korea discount" that institutional investors have discussed for decades. Buying into it doesn't generate alpha because the discount doesn't close. The signal reads it as an opportunity. The market says it's not.
China: Zero cash, still fails
China is the most interesting case in the underperformers. SHZ/SHH has 0% cash periods, meaning the signal always finds qualifying stocks. But absolute returns are 4.07% CAGR, -3.57% excess, with a Sharpe of 0.035. The market finds qualifying stocks regularly, but those stocks don't outperform. China's A-share market is heavily retail-driven and policy-sensitive. Sector-relative valuation plays a smaller role in price discovery than government announcements, retail sentiment, and liquidity cycles. The signal is measuring something real, but it's not the thing that drives Chinese stock prices.
Japan: Structurally better, still negative
Japan at -2.98% excess and Sharpe 0.259 is the best of the Asian underperformers vs SPY. The Sharpe isn't terrible. Japan's keiretsu system creates structural cross-holdings and sector discounts that sometimes do resolve, particularly post-2012 during the Abenomics corporate governance reform era. The 32% cash rate limits it. Japan sits at the boundary of the West/East divide. It has the corporate governance awareness that drives mean reversion, but decades of structural discounts mean the signal is noisier than in the US or UK. Benchmarked against the Nikkei 225 (2.95% CAGR over 25 years), Japan actually shows +1.71% excess, which illustrates how much the choice of benchmark changes interpretation.
The Middle Group: Canada, Sweden, Switzerland
These three markets sit between the outperformers and the Asian failures. All deliver roughly 5.6-5.9% CAGR, negative excess returns (-1.72% to -2.09% vs SPY), but positive Sharpe ratios. The strategy isn't destroying value here. It's just not beating the SPY benchmark.
Switzerland (SIX) is the most defensively interesting. MaxDD is -34.31%, and the Sharpe of 0.325 is the highest among the SPY-underperformers. Switzerland doesn't beat SPY, but the strategy running on SIX loses less in bad markets. Swiss quality companies getting sector discounts tend to be boring, stable businesses where the discount never becomes a deep hole. Benchmarked against the SMI (1.90% CAGR over 25 years), Switzerland shows +4.02% excess, though the SMI is a price-only index.
Canada (TSX) underperforms despite only 16% cash. Canadian sector composition is the likely culprit. Energy and materials dominate, and sector-relative P/E signals in resource-heavy sectors are noisy. When oil prices crash, the entire Energy sector compresses together. A stock at 60% of sector median during an oil crash isn't necessarily cheap relative to its peers. It might just be the one with worse reserve quality.
Sweden (STO) has 40% cash, which is the real constraint. When the signal does fire in Sweden, returns look reasonable, but 40% of periods generate no invested portfolio. That caps the compounded CAGR regardless of per-period performance.
Key Patterns
Why the West works
In developed markets with deep institutional participation, a quality stock trading at a 40%+ discount to sector peers is almost always a temporary situation. Analysts notice it. Fund managers look at it. The gap closes via either price appreciation or a catalyst (earnings beat, dividend increase, management change).
The key condition: sector median P/E functions as a genuine anchor. When it does, the discount signals an anomaly. When it doesn't — because the sector is structurally weird, dominated by one company, or not a real peer group — the signal misfires.
Western markets also have competitive corporate governance. Management teams are incentivized to close valuation gaps through buybacks, dividends, and investor relations. That mechanism is weaker in Asia.
Cash rate as a market quality signal
The cash rate tells you how well the strategy fits the market structure:
- 0% cash (US, UK, Germany, China): Broad, diversified exchanges with enough sector depth to always find qualifying stocks
- 16-32% cash (Canada, Switzerland, Japan): Moderate universe constraints
- 40-52% cash (Sweden, Korea, Thailand): Structural limitations — too few sectors, thin universes, or sectors without enough peer stocks for meaningful medians
- 60% cash (Taiwan): The signal barely applies. Too concentrated a market.
High cash periods aren't just a performance drag. They're a signal that the market's sector structure doesn't support the strategy's underlying logic.
The sector median anchor test
The strategy works when sector medians are stable, competitive anchors. It fails when:
- One dominant company skews the sector median (Taiwan: TSMC, Korea: Samsung)
- The sector has structural pricing hierarchy that doesn't normalize (HK: mainland listings)
- The market is policy- or sentiment-driven rather than fundamentals-driven (China A-shares)
- Resource concentration means sector-wide discounts, not stock-specific ones (Canada energy)
Limitations
Currency effects. All returns are local currency vs USD benchmark (SPY). FX volatility adds noise to the comparison.
Survivorship bias. Current exchange profiles are used. Delistings and bankruptcies aren't fully tracked, which slightly flatters all results.
Sector granularity varies. Markets with fewer listed companies have thinner sector peer groups. A sector median built from 5 stocks is less reliable than one built from 30.
Post-2020 data. Only 5 years of post-COVID data. Some regime shifts may not be fully reflected.
Conclusion
Sector-relative P/E mean reversion works where sector discounts are genuinely anomalous. That describes the US, UK, and Germany. It partly describes India (with caveats). It doesn't describe most of Asia, where structural discounts are real and persistent.
The results across 13 exchanges: - 4 markets beat SPY (UK +4.03%, Germany +2.56%, US +2.23%, India +2.32%) - 9 markets underperform vs SPY (-1.72% to -9.15% excess) - Best Sharpe: Germany (0.403), UK (0.401), US (0.349) - Worst results: HKSE (-9.15%), Taiwan (-7.79%), Korea (-6.04%)
If you're running a sector-relative value strategy globally, the evidence says concentrate it in Western markets. Testing every geography because the data is available isn't diversification. It's just adding underperforming markets to your portfolio.
Data: Ceta Research (FMP financial data warehouse). All local-currency returns vs USD benchmark (SPY). Past performance does not guarantee future results. Full methodology: github.com/ceta-research/backtests


