
Germany P/E Compression: Essentially Matches DAX at -0.19% Excess
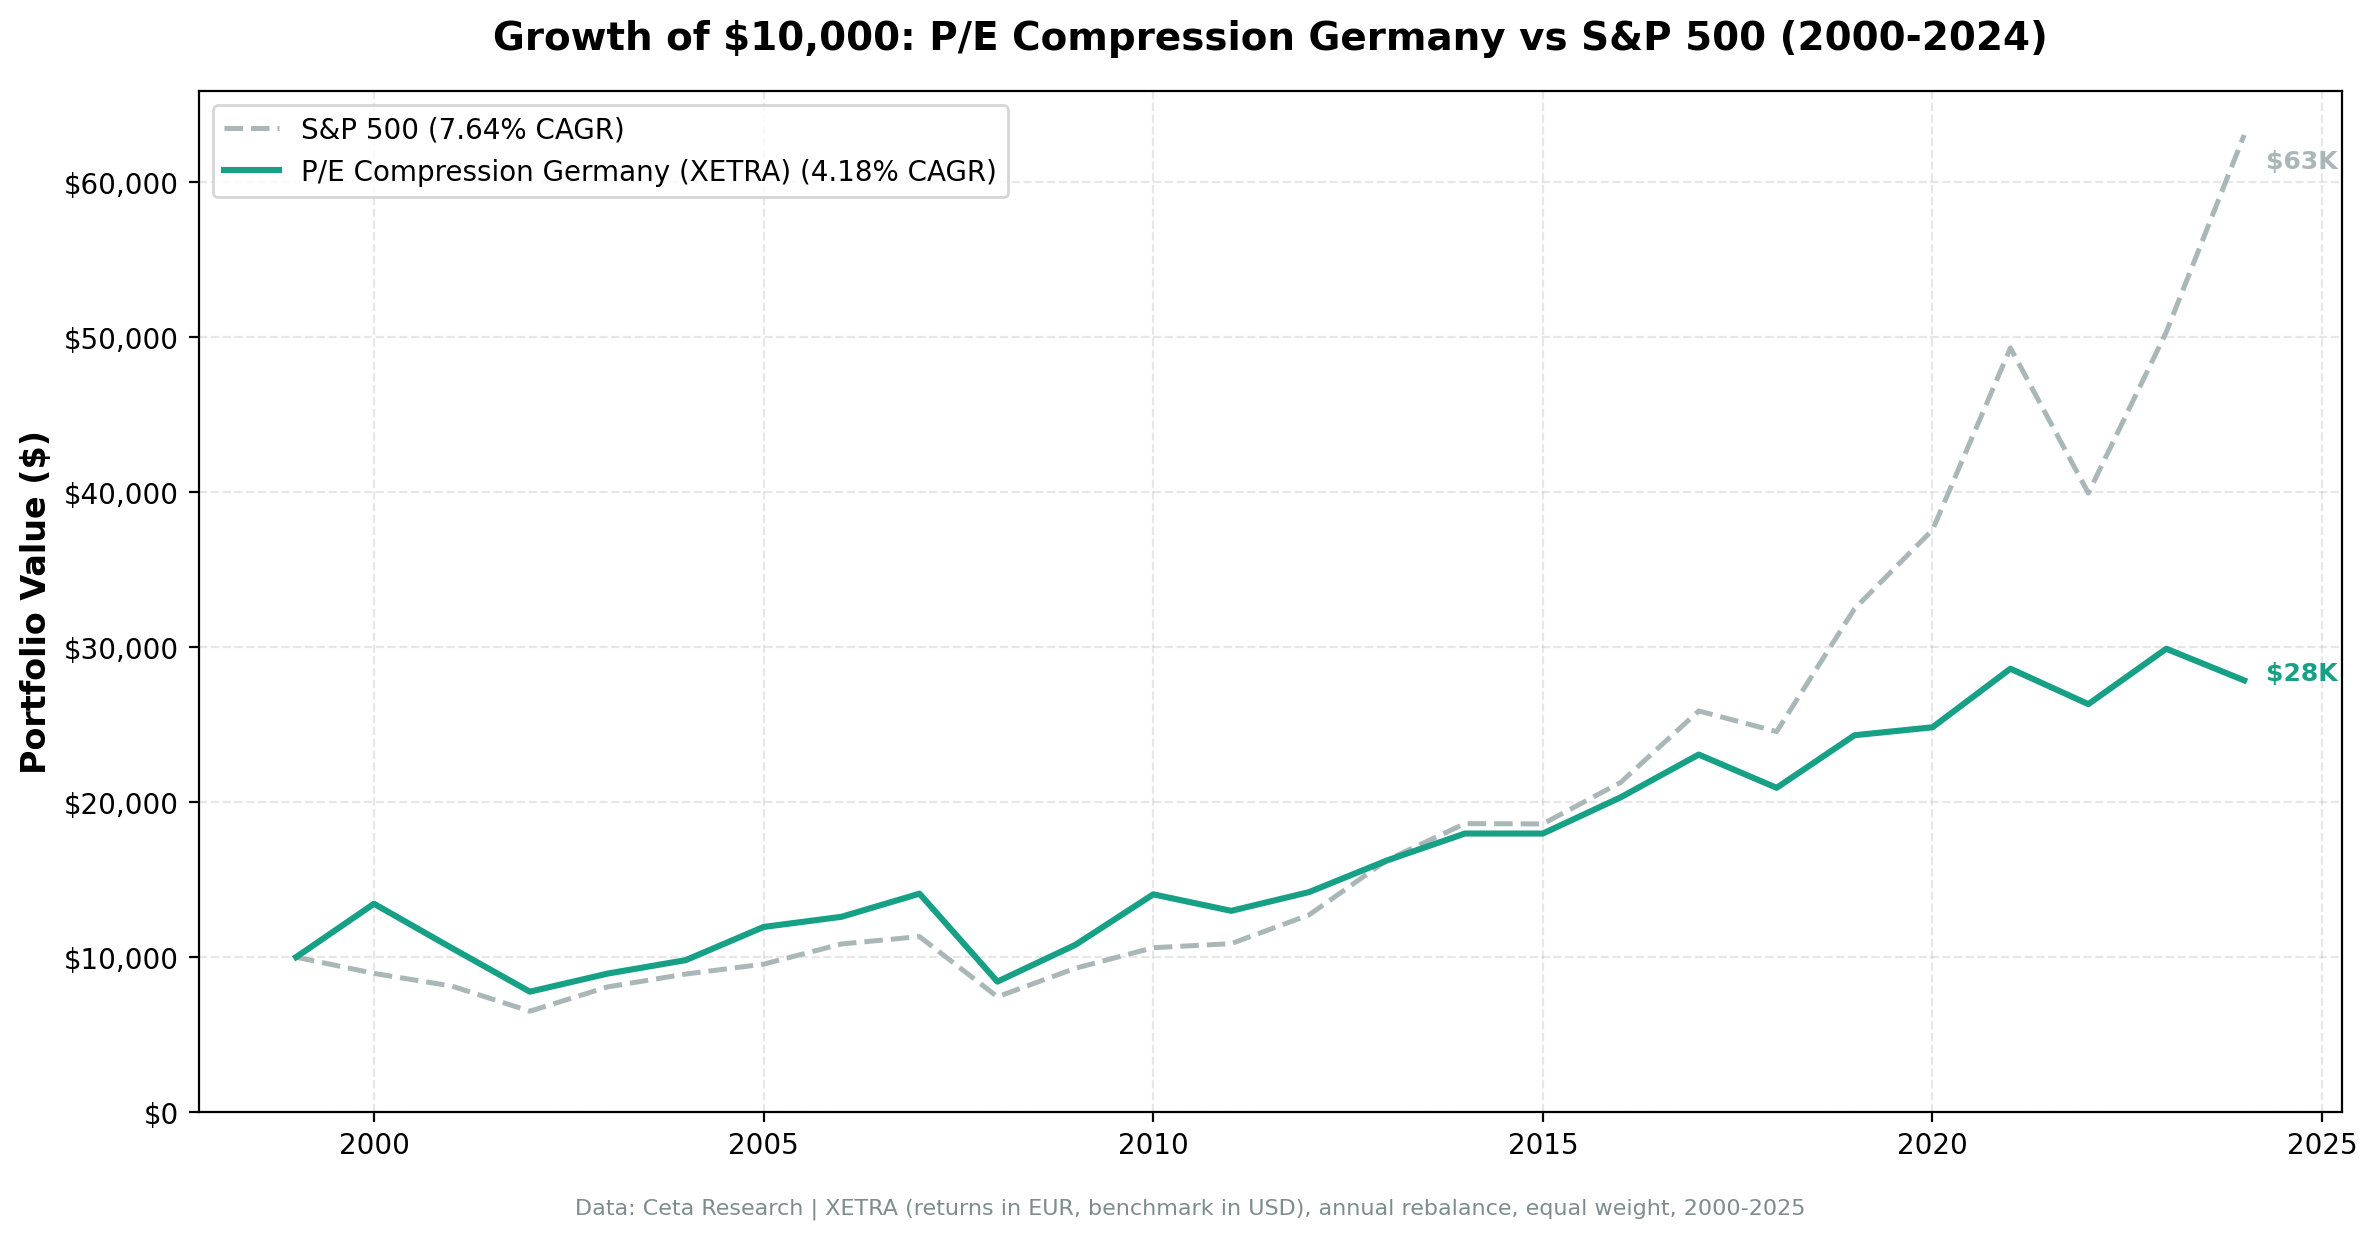
P/E compression on German stocks underperforms SPY by 3.46% annually. 4.18% CAGR despite zero cash periods and good diversification shows the strategy failed.

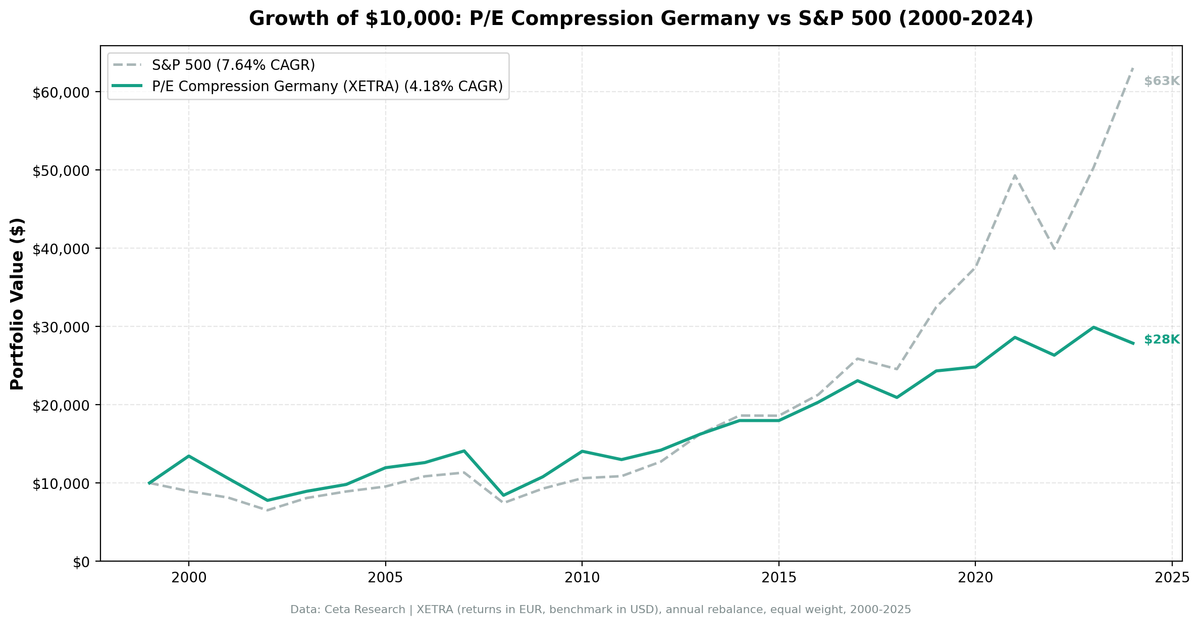
P/E compression on German stocks returns 4.26% annually vs 4.45% for the DAX. That's -0.19% excess: essentially breakeven with the local benchmark. The strategy doesn't beat the DAX, but it doesn't trail it meaningfully either. The bigger question is whether 4.26% CAGR over 25 years is worth a -41.76% max drawdown.
Contents
Data: FMP financial data warehouse, 2000–2025. Updated March 2026.
Method
Universe: XETRA, market cap > €500M Period: 2000-2025 (25 years) Benchmark: DAX (EUR)
Returns in EUR. Benchmark in EUR.
What We Found
| Metric | Germany | DAX |
|---|---|---|
| CAGR | 4.26% | 4.45% |
| Excess | -0.19% | - |
| Sharpe | 0.127 | - |
| MaxDD | -41.76% | - |
| Down-Cap | 55.17% | 100% |
| Up-Cap | 73.80% | 100% |
| Avg Stocks | 19.7 | - |
| Cash | 0/25 | - |
Zero cash periods mean the strategy always found qualifying stocks. The -0.19% excess vs DAX is nearly nothing. What changed with the local benchmark: the previous comparison used SPY as benchmark (7.64% CAGR in USD), which made Germany look like it was underperforming by 3.46%. Against the actual local market, it's a wash.
The down-capture of 55.17% is decent. In down years, the strategy captured about half the DAX's losses. Up-capture of 73.80% shows it gives up some upside in exchange.
Year-by-year returns
| Year | Portfolio | DAX | Excess |
|---|---|---|---|
| 2000 | +34.5% | -6.8% | +41.3% |
| 2001 | -21.8% | -17.8% | -4.0% |
| 2002 | -25.5% | -39.9% | +14.4% |
| 2003 | +17.3% | +29.4% | -12.1% |
| 2004 | +10.1% | +6.8% | +3.3% |
| 2005 | +21.9% | +27.0% | -5.2% |
| 2006 | +5.5% | +22.6% | -17.1% |
| 2007 | +11.8% | +19.0% | -7.1% |
| 2008 | -40.3% | -37.4% | -2.8% |
| 2009 | +29.3% | +21.6% | +7.7% |
| 2010 | +30.2% | +15.6% | +14.7% |
| 2011 | -9.6% | -13.1% | +3.5% |
| 2012 | +9.3% | +28.0% | -18.7% |
| 2013 | +14.4% | +20.8% | -6.5% |
| 2014 | +10.7% | +3.9% | +6.8% |
| 2015 | -0.0% | +5.3% | -5.3% |
| 2016 | +13.0% | +12.8% | +0.2% |
| 2017 | +13.6% | +11.0% | +2.6% |
| 2018 | -9.3% | -17.8% | +8.5% |
| 2019 | +16.2% | +26.5% | -10.3% |
| 2020 | +2.1% | +2.5% | -0.5% |
| 2021 | +15.2% | +16.7% | -1.5% |
| 2022 | -8.0% | -12.2% | +4.2% |
| 2023 | +13.6% | +19.2% | -5.6% |
| 2024 | -6.8% | +19.4% | -26.2% |
The pattern is mixed. Strong alpha in 2000 (+41.3%), 2002 (+14.4%), 2010 (+14.7%). But 2006 (-17.1%), 2012 (-18.7%), and 2024 (-26.2%) are brutal underperformance years. 2024 in particular was a disaster: the portfolio lost 6.8% while the DAX gained 19.4%. That's a 26.2% gap in a single year.
Why Germany Is a Mixed Result
German companies are heavily export-driven and cyclical. P/E compression often reflects real economic headwinds (eurozone crises, trade wars, energy shocks), not temporary sentiment. When a German industrial stock's P/E compresses, it's often because earnings forecasts have dropped, not because the market overreacted.
That said, against the local benchmark the strategy doesn't look like a failure. The DAX itself only returned 4.45% annually over 25 years. The strategy returned 4.26%, practically identical. The risk profile is different: 55% down-capture but also only 74% up-capture, so the strategy lowers volatility while essentially matching the market return.
The honest read: this is a low-conviction strategy in Germany. It doesn't fail badly, but it doesn't add value either. The year-to-year variation is large, with multi-year stretches of both outperformance and underperformance. 2024's -26.2% gap is a warning sign.
Conclusion
Germany's P/E compression strategy matches the DAX within rounding error (-0.19% excess) over 25 years. That sounds neutral, but the ride is rough: -41.76% max drawdown, inconsistent year-to-year results, and 2024's catastrophic -26.2% gap vs the DAX. For investors benchmarked to the local market, this isn't a clear win or a clear loss. It's mostly noise.
Data: Ceta Research. Returns in EUR. github.com/ceta-research/backtests
Past performance does not guarantee future results. This is educational content, not investment advice.


