
Canada P/E Compression: +4.37% Annual Alpha vs TSX Composite
P/E compression on Canadian stocks returns 8.81% annually vs 4.44% for the TSX Composite. +4.37% annual alpha, 17 wins in 25 years, 59% down-capture and 133% up-capture vs the local benchmark.


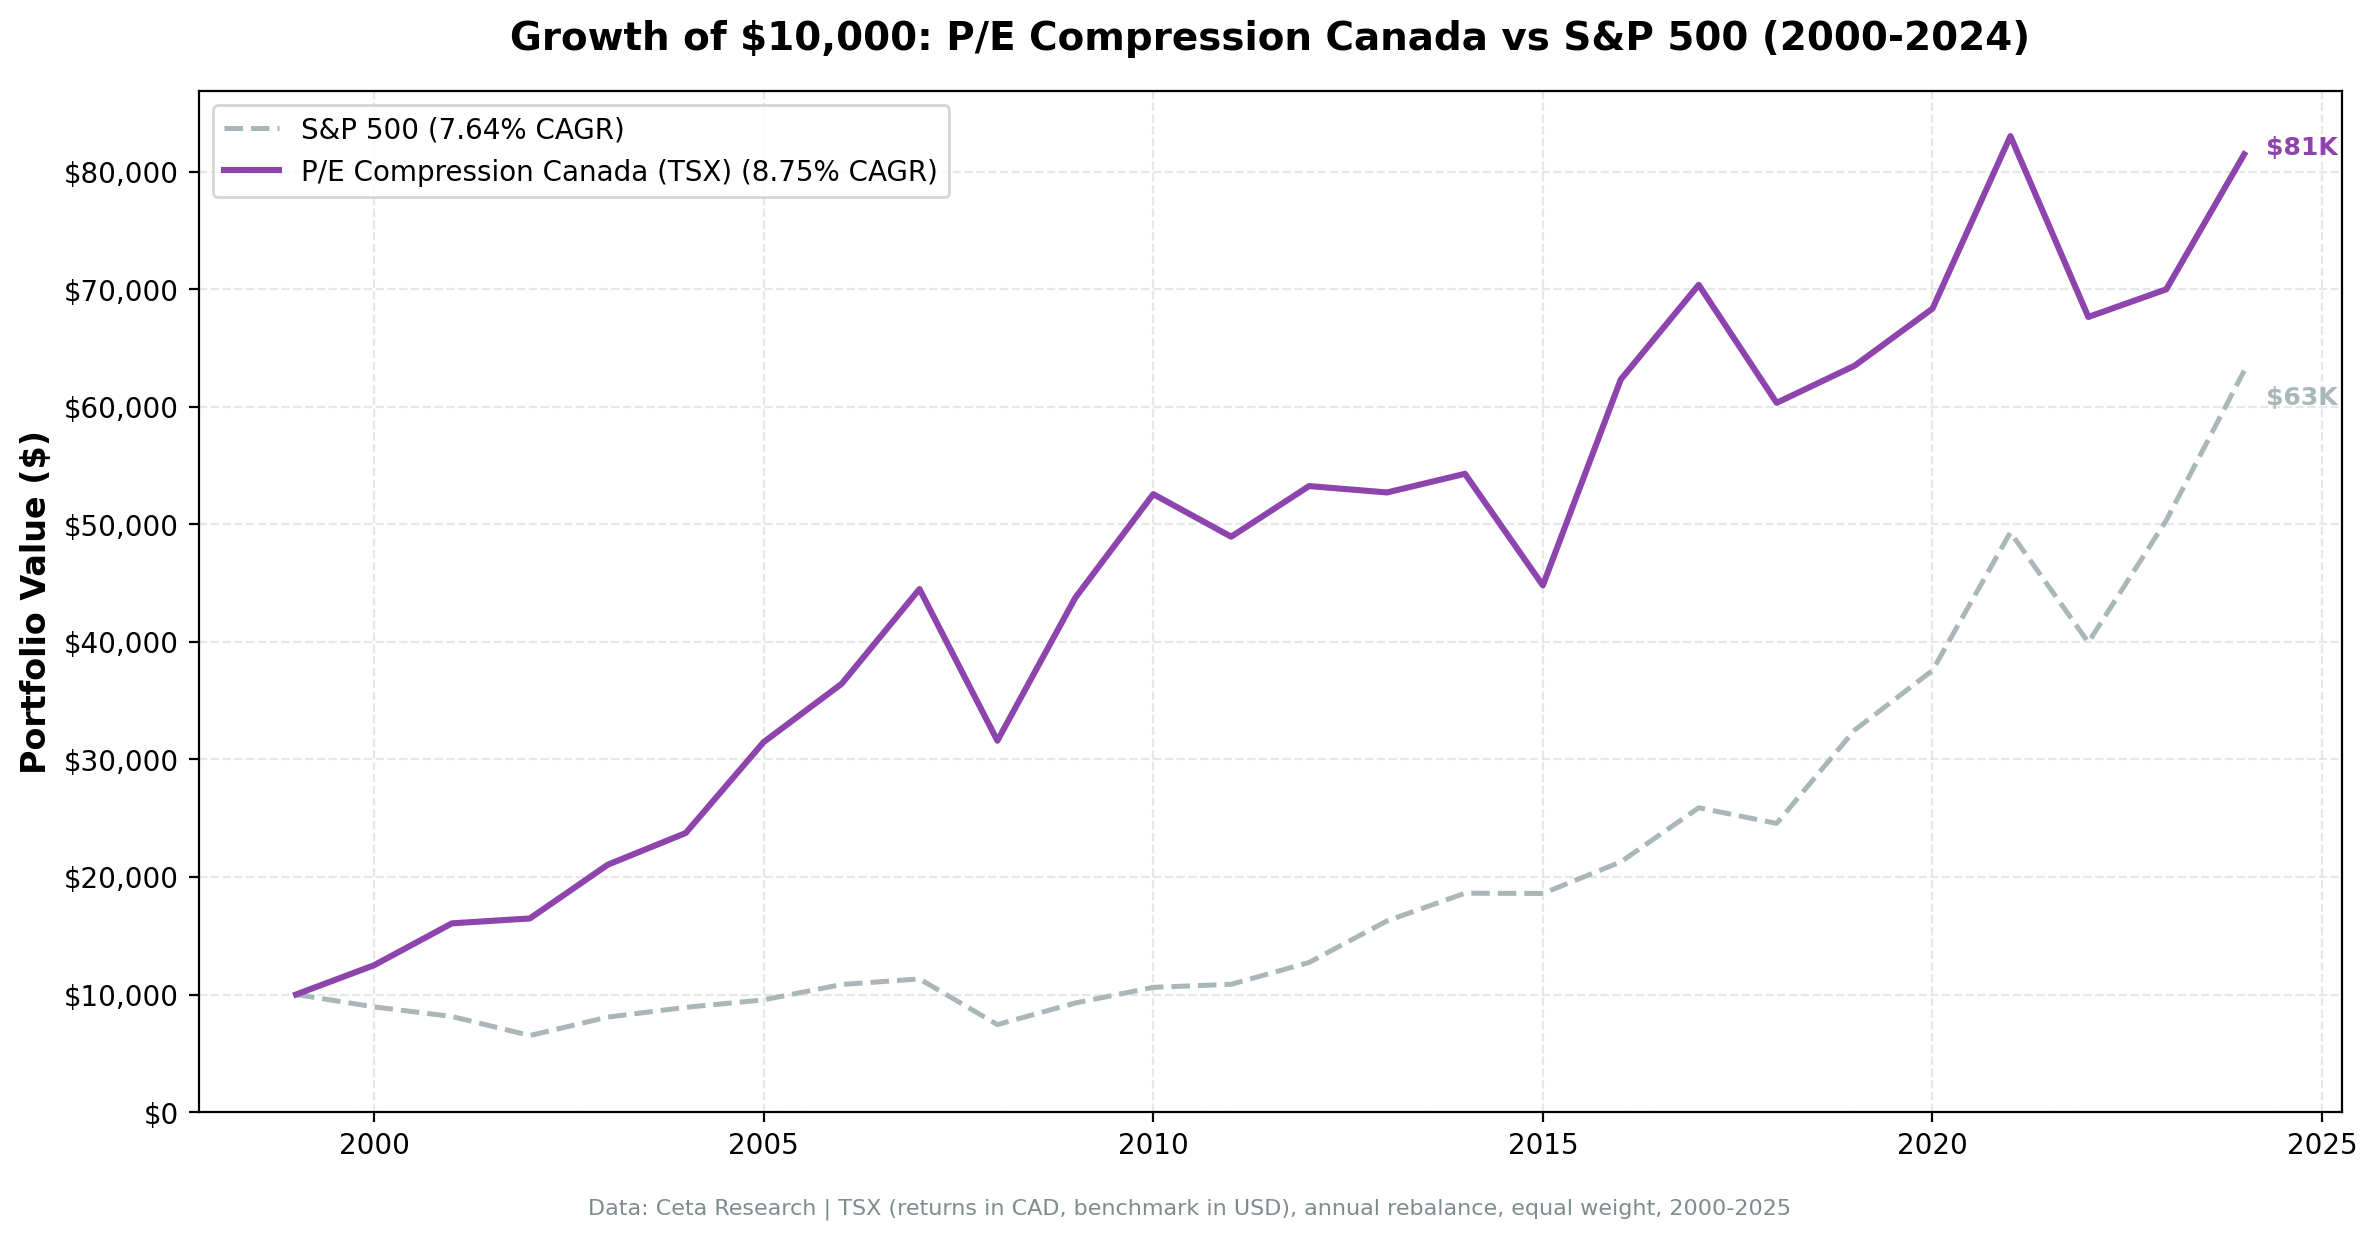
We tested P/E compression mean reversion on 25 years of Canadian stock data from the TSX. The strategy returned 8.81% annually (CAD-denominated) vs 4.44% for the TSX Composite, with +4.37% excess return. The strategy beats the local market in 17 of 25 years. Down-capture is 59% vs the TSX Composite, and up-capture is 133%.
Contents
- Method
- What We Found
- 25 years. +4.37% annual alpha. 17 of 25 years beating the index.
- Year-by-year returns
- Why Canada's alpha holds up
- Backtest Methodology
- Limitations
- Conclusion
Data: FMP financial data warehouse, 2000–2025. Updated March 2026.
Method
Data source: Ceta Research (FMP financial data warehouse) Universe: TSX, market cap > C$500M Period: 2000-2025 (25 years, 25 annual periods) Rebalancing: Annual (January), equal weight, top 30 by compression ratio Benchmark: TSX Composite (CAD) Cash rule: Hold cash if fewer than 10 stocks qualify
Returns are in CAD. Benchmark (TSX Composite) is in CAD.
What We Found
25 years. +4.37% annual alpha. 17 of 25 years beating the index.
| Metric | P/E Compression (Canada) | TSX Composite |
|---|---|---|
| CAGR | 8.81% | 4.44% |
| Excess | +4.37% | - |
| Sharpe Ratio | 0.349 | - |
| Max Drawdown | -28.99% | - |
| Up Capture | 133.51% | 100% |
| Down Capture | 59.09% | 100% |
| Avg Stocks per Year | 23.2 | - |
| Cash Periods | 0 of 25 | - |
The 59% down-capture means in years when the TSX Composite fell, this portfolio captured roughly 59% of those losses. That's meaningful protection. The 133% up-capture is the more striking number: when the TSX Composite gained 10%, this portfolio gained 13.4%. The strategy doesn't just protect downside, it amplifies upside in a local-market comparison.
The TSX Composite returned 4.44% annually over 25 years. Against that benchmark, the 8.81% CAGR looks strong. A 4.37% annual edge compounding for 25 years is significant. The max drawdown of -28.99% is also better than many broad market drawdowns over the same period.
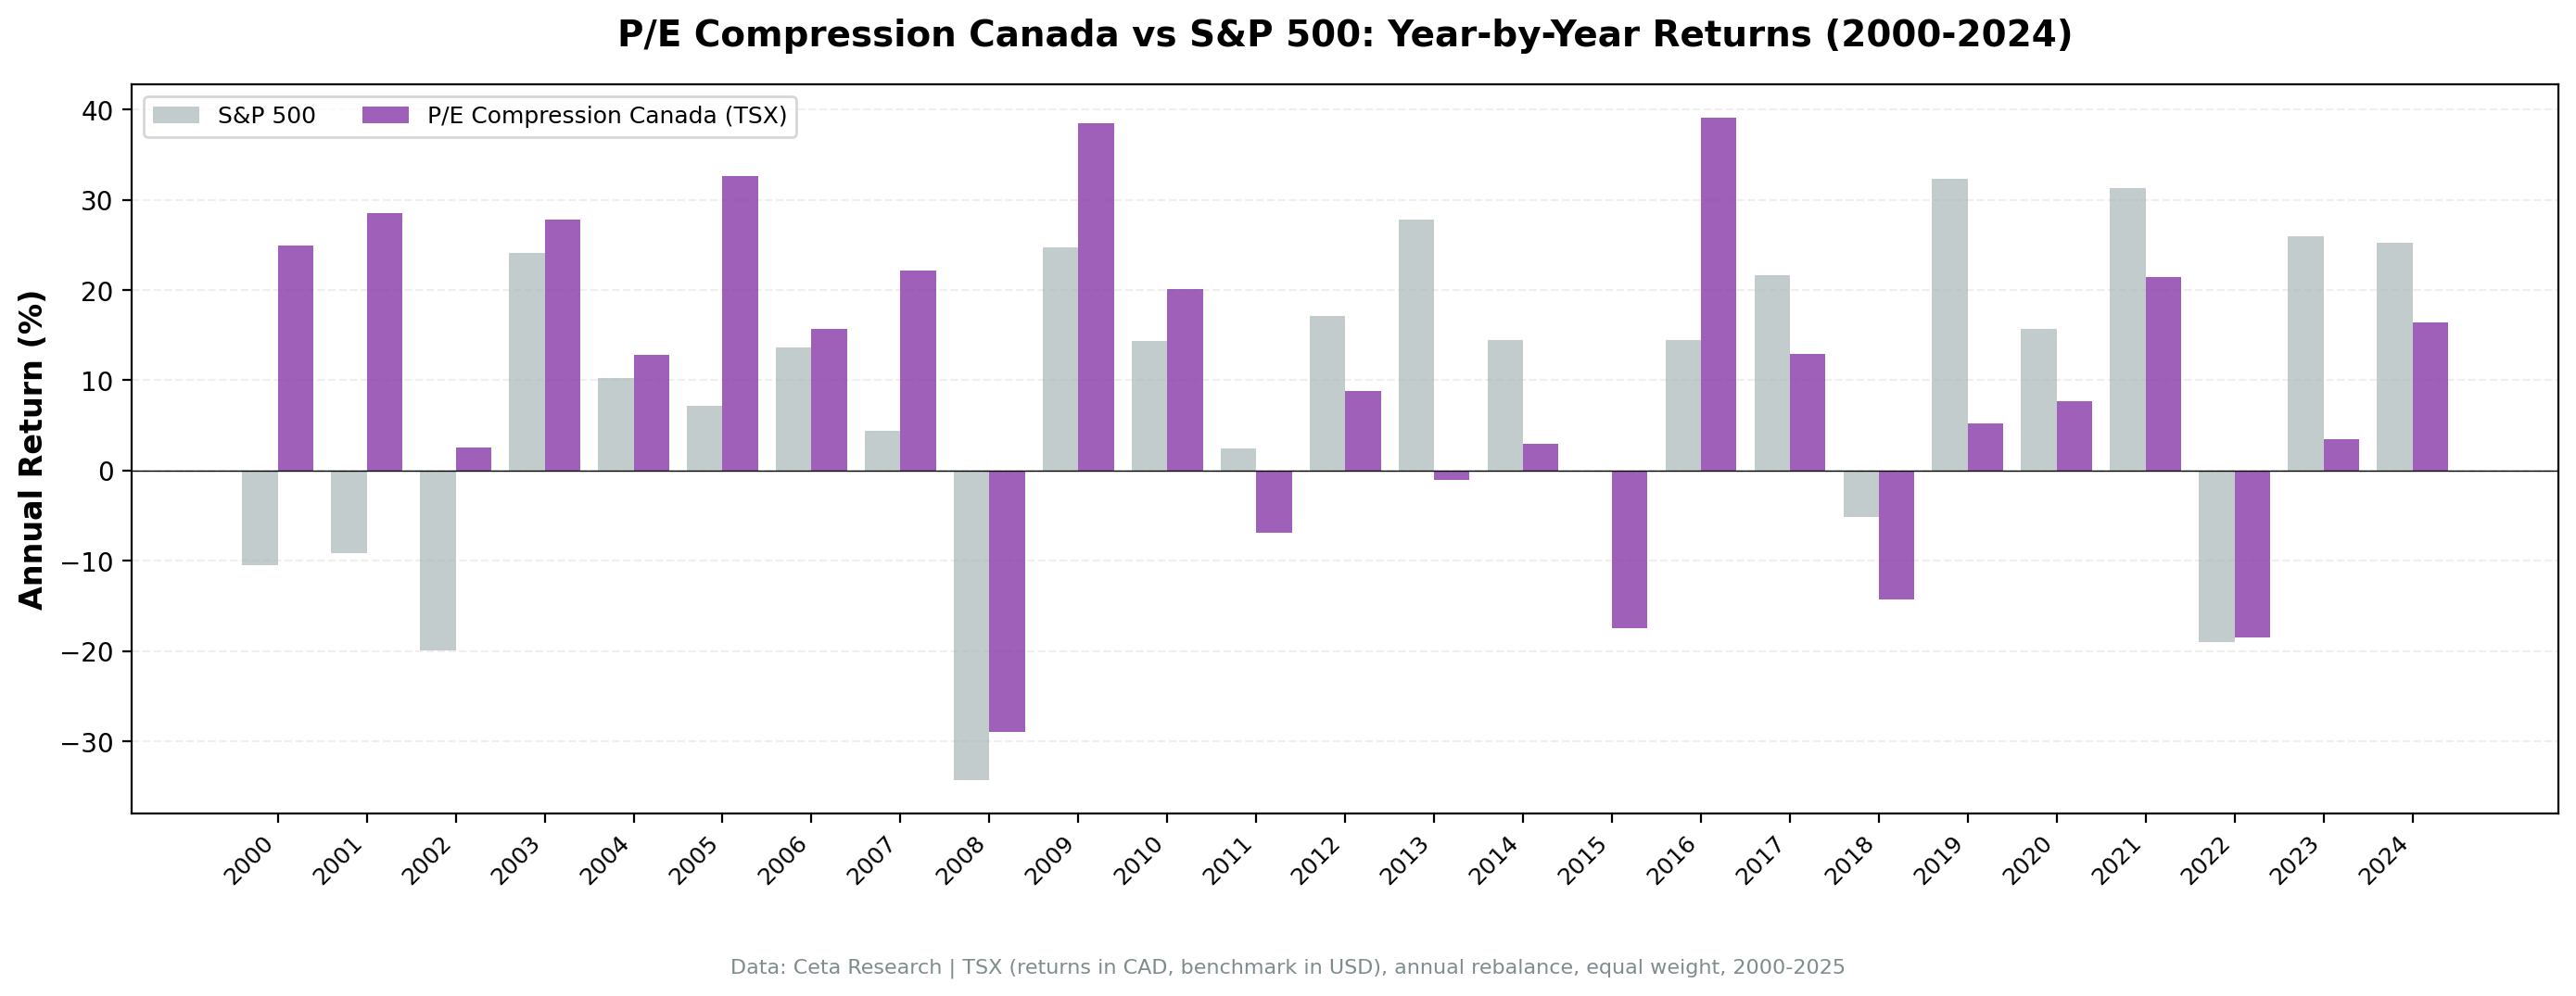
Year-by-year returns
| Year | Portfolio | TSX Composite | Excess |
|---|---|---|---|
| 2000 | +21.8% | +2.4% | +19.4% |
| 2001 | +28.1% | -11.2% | +39.3% |
| 2002 | +0.0% | -11.9% | +11.9% |
| 2003 | +28.0% | +23.1% | +4.9% |
| 2004 | +17.8% | +10.2% | +7.5% |
| 2005 | +32.6% | +25.1% | +7.5% |
| 2006 | +15.7% | +12.9% | +2.8% |
| 2007 | +22.1% | +7.8% | +14.4% |
| 2008 | -29.0% | -33.7% | +4.7% |
| 2009 | +38.5% | +28.5% | +10.0% |
| 2010 | +23.0% | +12.9% | +10.1% |
| 2011 | -7.1% | -8.9% | +1.8% |
| 2012 | +8.8% | +2.7% | +6.1% |
| 2013 | -1.0% | +8.4% | -9.4% |
| 2014 | +3.0% | +8.5% | -5.5% |
| 2015 | -17.5% | -12.4% | -5.1% |
| 2016 | +39.1% | +19.1% | +19.9% |
| 2017 | +12.9% | +5.9% | +7.0% |
| 2018 | -14.3% | -12.0% | -2.2% |
| 2019 | +5.2% | +19.2% | -13.9% |
| 2020 | +7.7% | +2.5% | +5.2% |
| 2021 | +21.5% | +21.2% | +0.3% |
| 2022 | -18.5% | -8.4% | -10.1% |
| 2023 | +3.5% | +7.3% | -3.9% |
| 2024 | +16.4% | +19.3% | -2.9% |
The strategy beats the TSX Composite in 17 of 25 years. The early period was especially strong: 2000-2012 saw consistent outperformance except for a flat 2002. The most damaging underperformance years were 2019 (-13.9%) and 2022 (-10.1%), both years with strong momentum or sector rotations that value strategies tend to miss. The 2013-2015 stretch and 2022-2024 period show the strategy can lag for multiple consecutive years.
Why Canada's alpha holds up
Defensive sector mix. Canadian markets are heavily weighted toward banks, utilities, telecom, and consumer staples. These sectors have stable earnings and less volatile P/E ratios, making compression-driven mean reversion more predictable.
Commodity diversification. Canadian stocks have exposure to energy, materials, and mining. During equity market selloffs, commodities sometimes hold value or even gain, providing a natural hedge.
Mature, stable businesses. TSX large caps are established companies with predictable cash flows. P/E compression is more likely driven by sentiment than fundamentals, supporting mean reversion.
Low TSX Composite baseline. The TSX Composite returned only 4.44% annually over 25 years. That's a lower bar than most developed markets. Any disciplined value approach with decent stock selection should have an edge here.
Less growth polarization. Canada has fewer extreme-multiple tech stocks. The market doesn't experience the same growth vs value polarization as the US, leading to smoother mean reversion dynamics.
Backtest Methodology
Full methodology documentation: backtests/METHODOLOGY.md
| Parameter | Choice |
|---|---|
| Universe | TSX, Market Cap > C$500M |
| Signal | Current P/E < 85% of 5-year avg, P/E 5-40, ROE > 10%, D/E < 2.0 |
| Portfolio | Top 30 by lowest compression ratio, equal weight |
| Rebalancing | Annual (January) |
| Cash rule | Hold cash if < 10 qualify |
| Benchmark | TSX Composite (CAD) |
| Period | 2000-2025 (25 years) |
| Returns | CAD-denominated (portfolio and benchmark) |
| Transaction costs | 0.3% one-way (C$500M-C$5B market cap tier) |
Limitations
Commodity exposure. Canadian markets are heavily exposed to energy and materials. The strategy's performance is tied to commodity cycles, which adds a source of return not present in pure equity strategies.
Lower up-capture in absolute terms. Compared against SPY, up-capture was 85.56%. Compared against the local TSX, it's 133.51%. The apparent improvement is partly because the TSX itself is a lower-return benchmark than SPY. Don't interpret 133% up-capture as free amplification.
Sector concentration. Without sector caps, the portfolio can cluster in financials, energy, or utilities. This is a feature in terms of defensive characteristics, but it's also concentration risk.
Recent trailing. The 2022-2024 period shows three consecutive years of underperformance vs the TSX (-10.1%, -3.9%, -2.9%). Worth monitoring to see if a structural shift is underway.
Conclusion
Canada's P/E compression strategy delivers +4.37% annual alpha vs the TSX Composite over 25 years: 8.81% CAGR vs 4.44% for the index. Down-capture of 59% and up-capture of 133% show an asymmetric profile that favors the strategy. The 17-of-25 win rate confirms this isn't a result driven by a few outlier years. The recent 2022-2024 underperformance is a flag, but 25 years of data makes it hard to dismiss the overall result.
Data: Ceta Research (FMP financial data warehouse). Returns in CAD. Past performance does not guarantee future results. See full methodology at github.com/ceta-research/backtests.


