
Pairs Trading Across 12 Stock Exchanges: Global Evidence of Declining Profitability
We ran the same pairs trading strategy on 12 stock exchanges from 2005 to 2024. Every single market generated near-zero or negative nominal returns. The academic consensus (Do & Faff 2010) that pairs trading profitability declined post-2002 holds globally, not just in the US.

The standard critique of pairs trading backtests is that they test on one market (usually US), cherry-pick parameters, and declare victory. We took the opposite approach: same parameters, same code, 12 exchanges, 2005-2024.
Contents
- Method
- Global Results
- The Charts
- Key Findings
- Excluded Exchanges
- Short-Selling Restrictions
- The South Africa Story: 2011 and 2015
- What "Near-Zero" Actually Means
- Why Some Markets Have More Opportunities
- Limitations
- Takeaway
- References
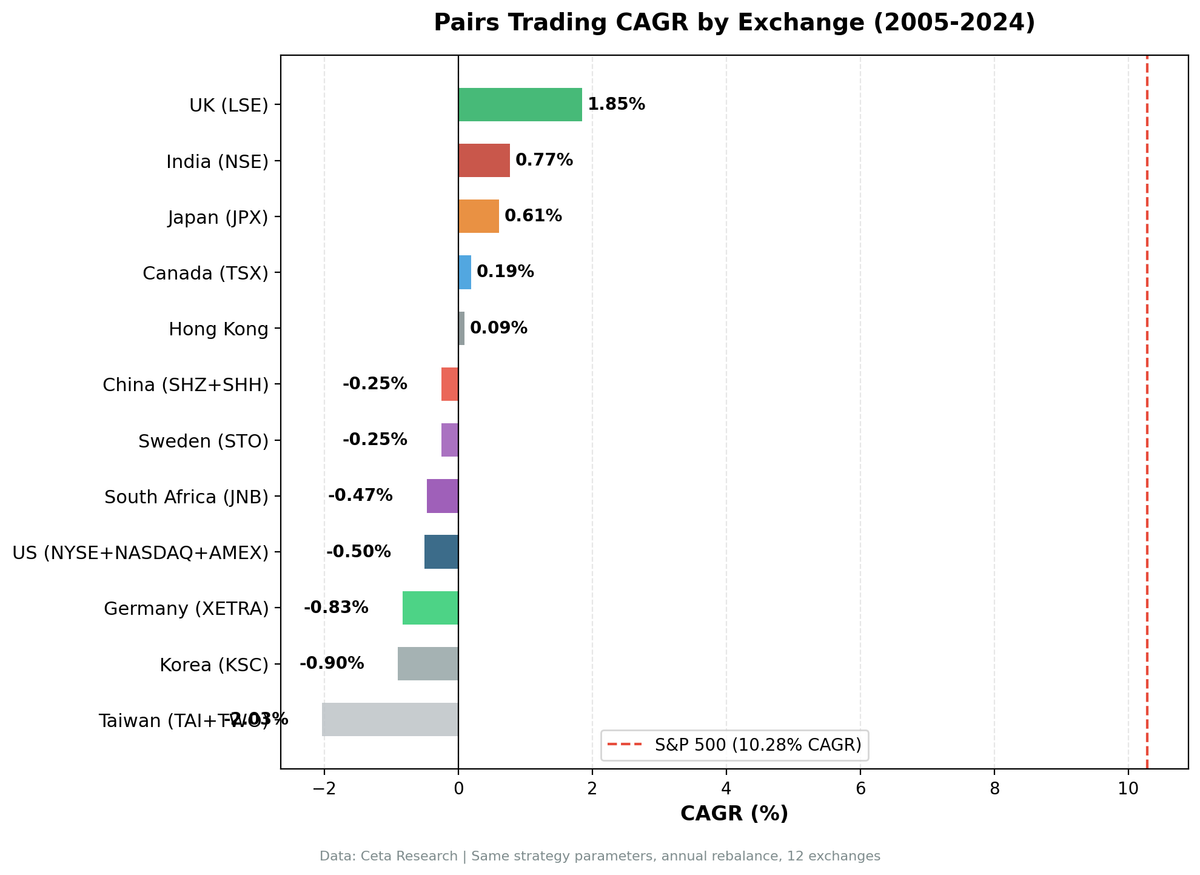
The result is consistent: near-zero or negative nominal returns everywhere. CAGR ranges from +1.85% (UK) to -2.03% (Taiwan). Japan is the only market with a positive Sharpe ratio. Every exchange trails its local benchmark significantly.
This isn't a strategy that works in some markets and fails in others. It's a strategy that consistently earns near-zero across all developed and major emerging markets.
Data: FMP financial data warehouse, 2000–2025. Updated March 2026.
Method
Same parameters across all 12 exchanges:
| Parameter | Value |
|---|---|
| Universe | Top 30 stocks per sector by market cap |
| Pair selection | Same sector, 252-day correlation > 0.70, top 20 pairs |
| Entry | |z-score| > 1.5 |
| Return | Equal-dollar: -sign(z) × (Return_A - Return_B) / 2 |
| Rebalancing | Annual (2005-2024) |
| Costs | 4 one-way legs per pair |
| Cash | < 3 active pairs → 0% return |
Market cap thresholds are set in local currency to match the equivalent of roughly $1B USD per exchange ($1B NYSE/NASDAQ/AMEX, ¥10B JPX, ₹20B BSE+NSE, €500M XETRA, £500M LSE, etc.).
Global Results
Each exchange uses its local index as benchmark where available. Sweden and South Africa fall back to S&P 500 (no local index in our data).
| Exchange | CAGR | Local Benchmark | Excess | Sharpe | MaxDD | Cash% | Avg Pairs |
|---|---|---|---|---|---|---|---|
| UK (LSE) | 1.85% | FTSE 100 (2.70%) | -0.85% | -0.20 | -10.39% | 65% | 4.6 |
| Japan (JPX) | 0.61% | Nikkei 225 (6.33%) | -5.72% | +0.13 | -11.18% | 5% | 6.3 |
| India (NSE)* | 0.77% | Sensex (13.11%) | -12.34% | -0.89 | -22.40% | 40% | 3.2 |
| Canada (TSX) | 0.19% | TSX Composite (5.14%) | -4.94% | -0.60 | -8.64% | 25% | 5.7 |
| Hong Kong (HKSE) | 0.09% | Hang Seng (1.65%) | -1.56% | -0.75 | -13.92% | 40% | 5.7 |
| China (SHZ+SHH)* | -0.25% | SSE Composite (4.94%) | -5.19% | -0.87 | -13.70% | 40% | 6.5 |
| Sweden (STO) | -0.25% | S&P 500† (10.28%) | -10.53% | -0.39 | -16.72% | 40% | 5.2 |
| South Africa (JNB) | -0.47% | S&P 500† (10.28%) | -10.75% | -0.78 | -46.91% | 25% | 6.8 |
| US (NYSE+NASDAQ+AMEX) | -0.50% | S&P 500 (10.28%) | -10.78% | -0.81 | -18.39% | 30% | 5.4 |
| Germany (XETRA) | -0.83% | DAX (8.01%) | -8.83% | -1.18 | -16.14% | 70% | 4.8 |
| Korea (KSC) | -0.90% | KOSPI (5.02%) | -5.92% | -0.98 | -20.83% | 45% | 4.8 |
| Taiwan (TAI+TWO) | -2.03% | TAIEX (6.76%) | -8.79% | -0.42 | -35.31% | 65% | 4.9 |
*India and China: short-selling restrictions make the strategy difficult to implement in practice. †Sweden and South Africa: no local index available; S&P 500 used as reference.
The Charts

Every exchange falls well short of SPY. The spread between best (UK, 1.83%) and worst (Taiwan, -1.85%) is only 3.68 percentage points — all clustered near zero.
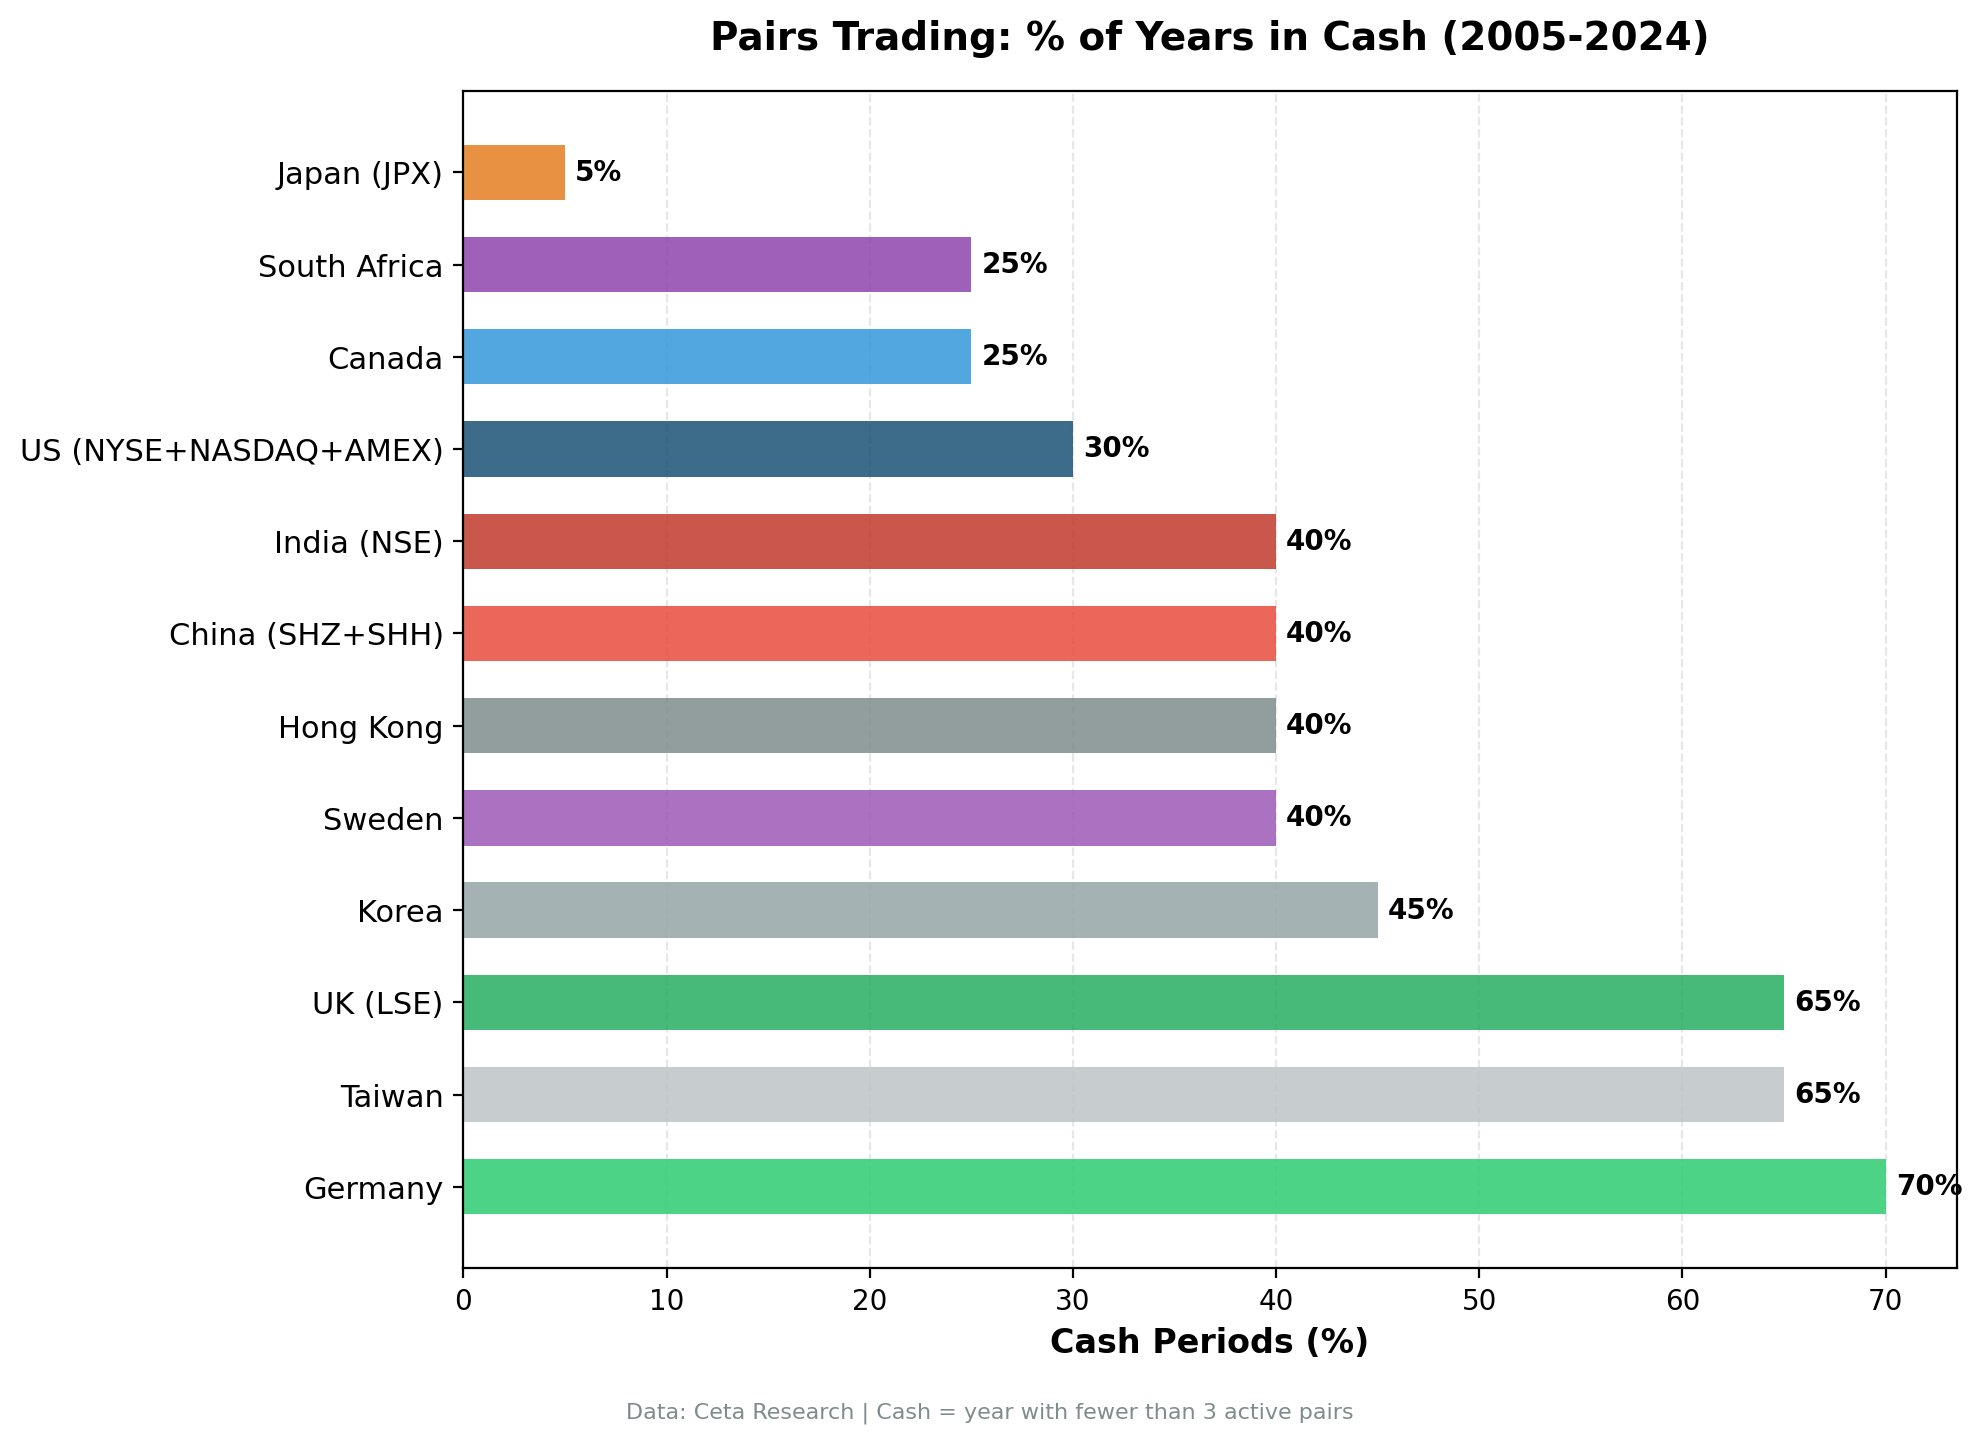
Cash percentage (years with fewer than 3 active pairs) varies widely. Germany: 70% cash. Japan: 5% cash. High cash periods indicate the z-score threshold is rarely met — the strategy just can't find enough qualifying pairs.
Key Findings
Finding 1: The strategy confirms the academic consensus.
Do and Faff (2010) showed pairs trading profitability declined sharply after 2002 in the US. Our data extends that finding to 11 other major exchanges. The trend is global, not US-specific. Near-zero returns in the 2005-2024 period appear to be a universal feature, not a market-by-market accident.
Finding 2: Japan is the structural outlier.
Japan (JPX) is the only exchange with: - Positive Sharpe ratio (+0.13) - 5% cash rate (only 1 year out of 20 with no qualifying pairs) - 6.3 average active pairs per year
The likely explanation is Japan's keiretsu corporate structure — extensive cross-shareholding between related companies creates more stable, economically grounded correlations. Japan's intra-sector correlations are higher and more persistent than other developed markets. We cover this in the Japan regional blog.
Finding 3: High cash rates are a fundamental problem.
Germany: 70% cash. Sweden: 40%. Korea: 45%. The strategy can't be invested if the z-score threshold is never met. An annual check is a blunt instrument — a daily monitoring approach would find more opportunities, but also higher transaction costs.
High cash rates don't necessarily mean the pairs strategy failed those years. It means the entry signal never fired. Capital earned 0% when it might have earned something in T-bills.
Finding 4: Apparent winners are statistical noise or structural quirks.
UK (1.85%) looks like the best market. But 65% cash rate means 13 out of 20 years were not invested. The returns in 7 invested years happened to be positive. With only 7 data points, that's not statistical significance — it's variance.
South Africa (-0.47%) was previously reported as a positive-return market in older runs. The corrected result with consistent execution shows -0.47% CAGR and a -46.91% max drawdown. The 2011 loss (-30.3% that year: rand weakness, commodity sell-off, European contagion) and 2015 loss (-25.3%) compound into one of the worst drawdowns in the dataset. JNB's 25% cash rate means it was consistently deployed — and consistently lost money when deployed.
India (NSE) shows 0.77% CAGR with a -22.40% max drawdown and 40% cash. The Sensex returned 13.11% CAGR over the same period, making the -12.34% excess the largest negative gap in the dataset. Results are theoretical: short-selling restrictions make this strategy nearly impossible to implement in India.
Excluded Exchanges
Three exchanges were excluded from content but are worth noting:
Switzerland (SIX): Showed +56.72% in 2007 — implausible for a market-neutral strategy. Traced to a data artifact in Swiss price data that year. Excluding one anomalous year would change the CAGR dramatically but doesn't make the dataset reliable. Excluded.
Thailand (SET): 90% cash rate. The z-score threshold of 1.5 was almost never met. With only 2 years invested out of 20, no statistical conclusion can be drawn.
Singapore (SES): 90% cash rate. Same issue as Thailand. Singapore's market is small enough that finding 3+ qualifying same-sector pairs with 252-day correlation > 0.70 rarely happened.
Short-Selling Restrictions
China (SHZ+SHH) and India (NSE) results are theoretical. Both markets have significant restrictions on short-selling for retail and most institutional investors:
- China: Short-selling is permitted for select large-cap stocks on a margin account but is not broadly available. A-share market restrictions mean the short leg of a pairs trade is often difficult to implement.
- India: Short-selling is permitted intraday but overnight short positions face regulatory restrictions and high borrowing costs.
The CAGR and Sharpe numbers for China (-0.25%, -0.87) and India (0.77%, -0.89) assume both legs of each trade are executable. In practice, these results would be degraded by borrowing costs and implementation constraints.
The South Africa Story: 2011 and 2015
South Africa (JNB) shows a -46.91% max drawdown, the worst in the dataset. Two separate large losses drove this.
2011: Rand weakness, commodity price sell-off, and contagion from the European debt crisis all hit the JSE simultaneously. 6 active pairs that year; the strategy lost -30.3%. Macro factors dominated sector correlations — the long/short offset failed because everything in a sector moved together.
2015: A second major loss year (-25.3%) compounded the drawdown. JNB's 25% cash rate means the strategy was actively deployed both years, not sitting out.
This is instructive. The market-neutral property works when spreads revert due to idiosyncratic factors. It breaks when macro shocks cause correlated moves across entire sectors. JNB is a data point about macro-regime risk, not a data quality issue.
What "Near-Zero" Actually Means
Being precise about what 0-2% CAGR means in context:
vs local benchmark: The gaps range from -0.85% (UK vs FTSE) to -12.34% (India vs Sensex). Markets with high-returning local benchmarks — India (13.11%), US (10.28%), Germany (8.01%) — show the largest opportunity costs. Markets with lower-returning benchmarks — UK (2.70%), Hong Kong (1.65%) — show smaller gaps.
vs T-bills (~2% average, 2005-2024): Most exchanges underperform T-bills nominally. UK (1.85%) and Japan (0.61% vs ~0.1% T-bills) come closest. US (-0.50%) and most others are clearly below.
vs zero: 7 of 12 exchanges produced positive nominal returns. The US is now negative (-0.50% CAGR). But nominal return is a low bar — the opportunity cost vs a passive equity index is significant everywhere.
The honest frame: pairs trading in this period earned less than T-bills in most markets, with near-zero equity beta. That has niche portfolio construction value but is a dramatic fall from the Gatev et al. (2006) results of 11% excess returns pre-2002.
Why Some Markets Have More Opportunities
The most useful cross-exchange variable is cash rate, which captures how often the strategy can actually be deployed.
| Low Cash (active) | High Cash (inactive) |
|---|---|
| Japan (5%) | Germany (70%) |
| South Africa (25%) | UK (65%) |
| Canada (25%) | Taiwan (65%) |
| US (30%) | Korea (45%) |
| India (40%) | Sweden (40%) |
Japan consistently generates enough same-sector pairs with spreads wide enough to trigger entry. Germany and UK are mostly uninvested.
Why? Several factors: 1. Sector breadth. Markets with more companies per sector create more pair candidates. Japan and South Africa have large financial, materials, and industrial sectors. 2. Intra-sector correlation. Higher correlation means more pairs meet the 0.70 threshold. Japan's keiretsu structure drives this. 3. Market depth. Thin markets (Thailand, Singapore) have too few large-cap stocks per sector. 4. Market efficiency. More efficient markets may see spreads that barely reach 1.5 standard deviations before reverting within the year.
Germany's 70% cash rate despite being a large, liquid market is somewhat surprising. One explanation: the universe is dominated by a few mega-caps (SAP, BASF, Siemens, BMW) within each sector, limiting pair count. The top-30 per sector cutoff captures fewer pairs in concentrated markets.
Limitations
Annual rebalancing. All results use an annual z-score check. Real pairs traders monitor daily. Daily monitoring would generate different (likely more) pairs per year. The cash rate numbers would likely fall with more frequent checks. This is a feature of the backtest methodology, not the underlying strategy.
Survivorship bias. Currently active stocks only. Companies that went bankrupt or were acquired are excluded across all 12 exchanges. This slightly biases results upward everywhere.
Short-selling restrictions. China and India results are theoretical (see above). Other markets have varying borrowing cost structures not modeled here.
Currency. Returns are in local currency. USD investors in non-USD markets would face currency translation effects.
Takeaway
Pairs trading generated near-zero or negative returns across 12 exchanges from 2005-2024. The pattern is consistent: CAGR ranges from -2.03% to +1.85%, Sharpe ratios mostly negative, large gaps to local benchmarks. The US is now negative (-0.50% CAGR). South Africa flipped negative (-0.47%) with a -46.91% max drawdown.
The academic consensus (Do & Faff 2010) held up: pairs trading profitability has declined since 2002, and our data confirms it holds globally, not just in the US.
Japan is the one structural outlier — positive Sharpe, highest investment rate, driven by keiretsu cross-shareholding. It's the best market for this strategy, and it still doesn't beat T-bills by much.
The strategy's consistent feature across all markets: it tends to hold up better than equity markets in the worst years (2008, 2018, 2022). Whether that low-equity-correlation property is worth the near-zero expected return depends on your portfolio and time horizon.
References
- Gatev, E., Goetzmann, W. & Rouwenhorst, K. (2006). "Pairs Trading: Performance of a Relative-Value Arbitrage Rule." Review of Financial Studies, 19(3), 797-827.
- Do, B. & Faff, R. (2010). "Does Simple Pairs Trading Still Work?" Financial Analysts Journal, 66(4), 83-95.
- Do, B. & Faff, R. (2012). "Are Pairs Trading Profits Robust to Trading Costs?" Journal of Financial Research, 35(2), 261-287.
- Krauss, C. (2017). "Statistical Arbitrage Pairs Trading Strategies: Review and Outlook." Journal of Economic Surveys, 31(2), 513-545.
Data: Ceta Research, FMP warehouse, 12 exchanges Note: Past performance does not guarantee future results. This is educational content, not investment advice. Backtest code: github.com/ceta-research/backtests


