backtests
Net Debt/EBITDA Below 2x: What 25 Years of US Data Actually Shows
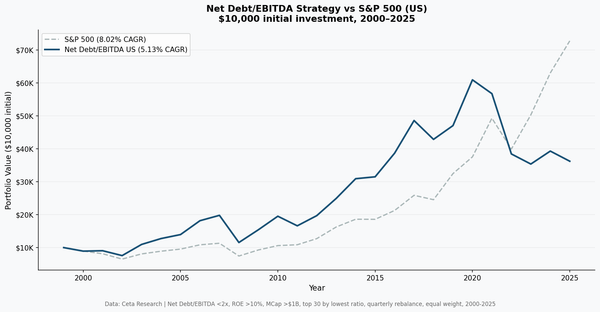
We tested Net Debt/EBITDA below 2x on 22,000+ US stocks over 25 years. Result: 5.13% CAGR vs 8.02% for SPY, -2.89% excess per year. The honest version of a popular strategy.
backtests
We tested Net Debt/EBITDA below 2x on 22,000+ US stocks over 25 years. Result: 5.13% CAGR vs 8.02% for SPY, -2.89% excess per year. The honest version of a popular strategy.
backtests
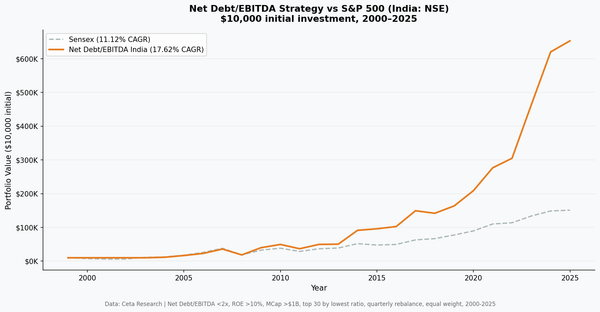
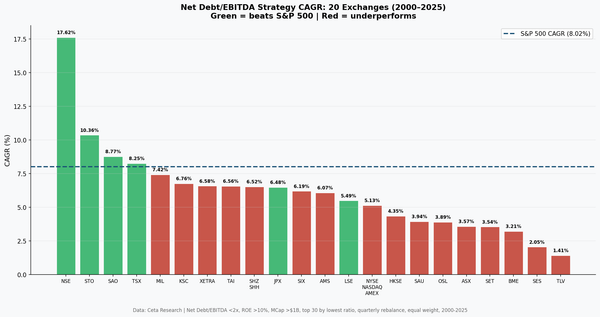
The same signal that underperforms on the full US market produced 17.62% CAGR on Indian stocks (NSE) over 25 years, +6.50% above the Sensex annually. Here's what the data shows and why.
backtests
We tested EV/EBITDA below 10x on 17 global exchanges with local benchmarks. 14 of 17 beat their local index. The value premium is broader than SPY comparison suggested.
value-investing
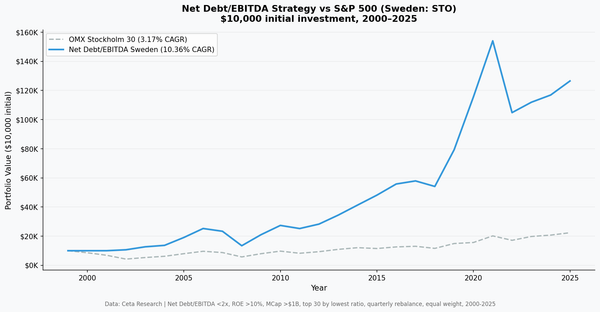
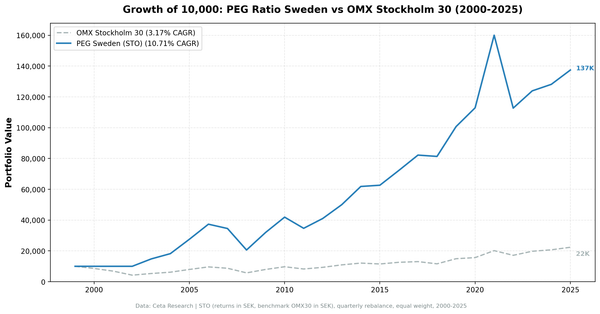
Stockholm Exchange delivered 10.71% CAGR over 25 years, +7.54%/yr vs OMX Stockholm 30. Sharpe ratio of 0.437 is 7x the benchmark's 0.060.
value-investing
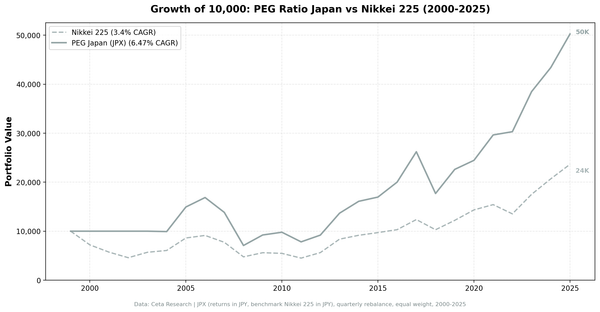
Japan delivered 6.47% CAGR over 25 years, +3.07%/yr vs the Nikkei 225. Sharpe 0.284 vs benchmark 0.066. Up capture 99.7%, down capture 76.1%. The strategy beat the index in 16 of 26 years.
value-investing
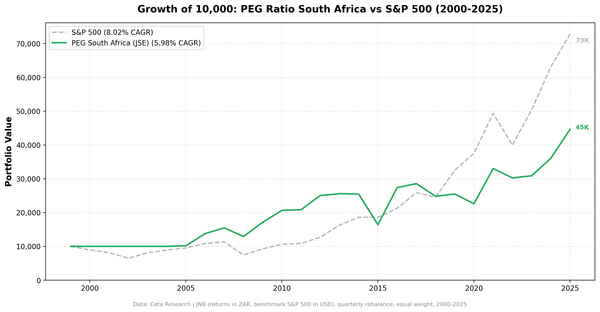
South Africa's JSE delivered 5.98% CAGR over 25 years with strong downside protection. Beta 0.574, down capture 42.2%, -16.5% in 2008 vs S&P 500's -34.3%. Trails SPY on returns but adds real diversification value.
value-investing
PEG ratio on India's NSE: 12.12% CAGR over 25 years, +0.99%/yr vs the Sensex. The ride was violent, -67% in 2008, +116% in 2009. Here's the full data.
earnings
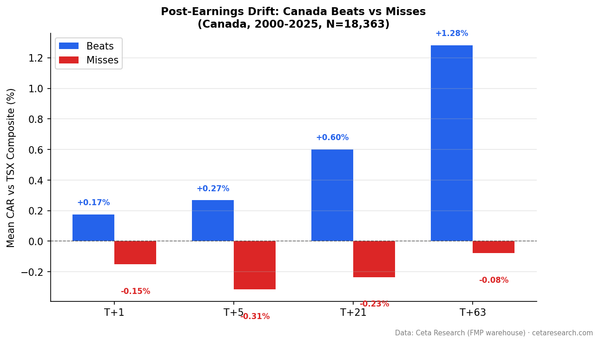
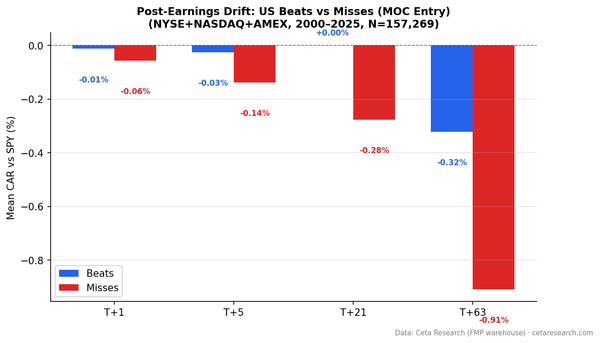
Brazilian beat streaks show back-loaded returns. The day-1 reaction is weak (+0.30%) but the drift builds to +2.49% by day 63. Streak 3 and streak 5+ both reach +3.1% at T+63. 1,358 events from 2015-2025 on B3.
earnings
Taiwan shows delayed post-announcement drift that builds to +1.79% by day 21. Streak 3 reaches +2.60% T+21 and +2.75% T+63. 3,721 events from 2012-2025. The muted day-1 reaction followed by strong drift suggests gradual information incorporation.
value-investing
Taiwan's DCF discount portfolio returned 9.24% CAGR over 25 years, beating the TAIEX by +6.19% annually. The 0.399 Sharpe, -35.91% max drawdown (shallowest of any Asian market), and ~2.8:1 up/down capture asymmetry show strong risk-adjusted performance.
value-investing
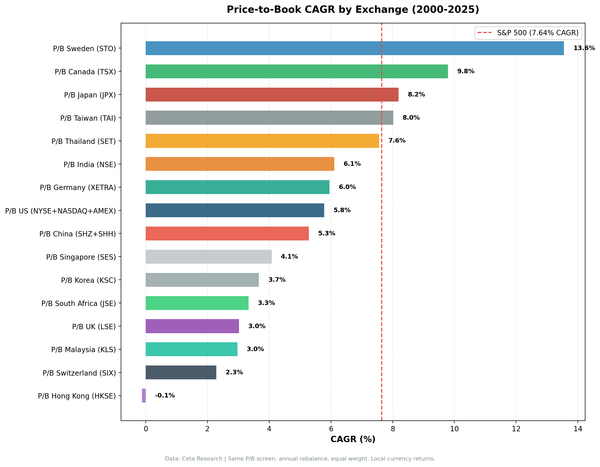
Canada's TSX PEG strategy delivered 9.67% CAGR with zero cash periods across 25 years, +4.59%/yr vs the TSX Composite. Next-day close execution, full backtest results and methodology.
value-investing
Peter Lynch's PEG ratio underperforms the full US exchange universe by 0.91%/yr over 25 years. Here's what works, what doesn't, and why universe selection changes everything.