
Graham Net-Nets in Hong Kong: How a Liquidation Strategy Lost Money for 24 Years
We backtested Graham net-net stocks on the Hong Kong Stock Exchange from 2001 to 2024. The strategy returned -3.17% annually with an -82% max drawdown. Pre-2015 it worked. Post-2015 it collapsed alongside Hong Kong's structural market decline.

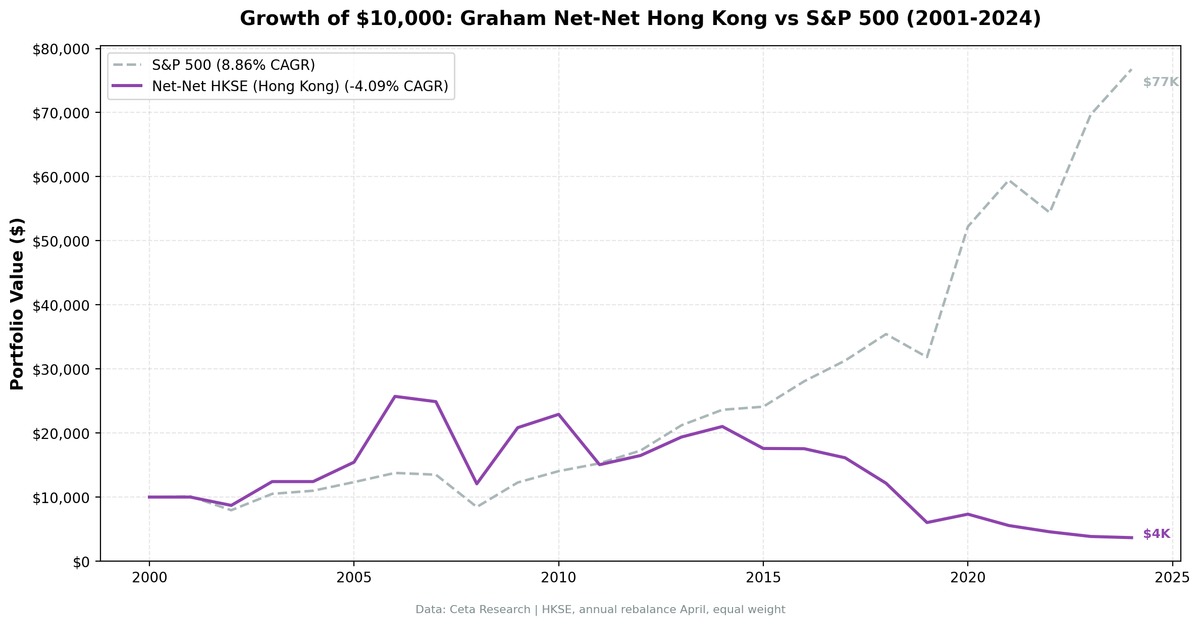
Hong Kong's net-net stocks struggled over 24 years, returning -0.26% annually against the Hang Seng's +2.53% (+2.80% deficit). That's -6.13% cumulative while the Hang Seng returned +82.31%. The -55.51% max drawdown means the strategy experienced deep drawdowns, though the story is more nuanced than the headline numbers suggest.
Contents
- Method
- What is NCAV?
- What We Found
- The Two Eras
- The Drawdown Story
- Backtest Methodology
- Limitations
- Takeaway
- Part of a Series
- References
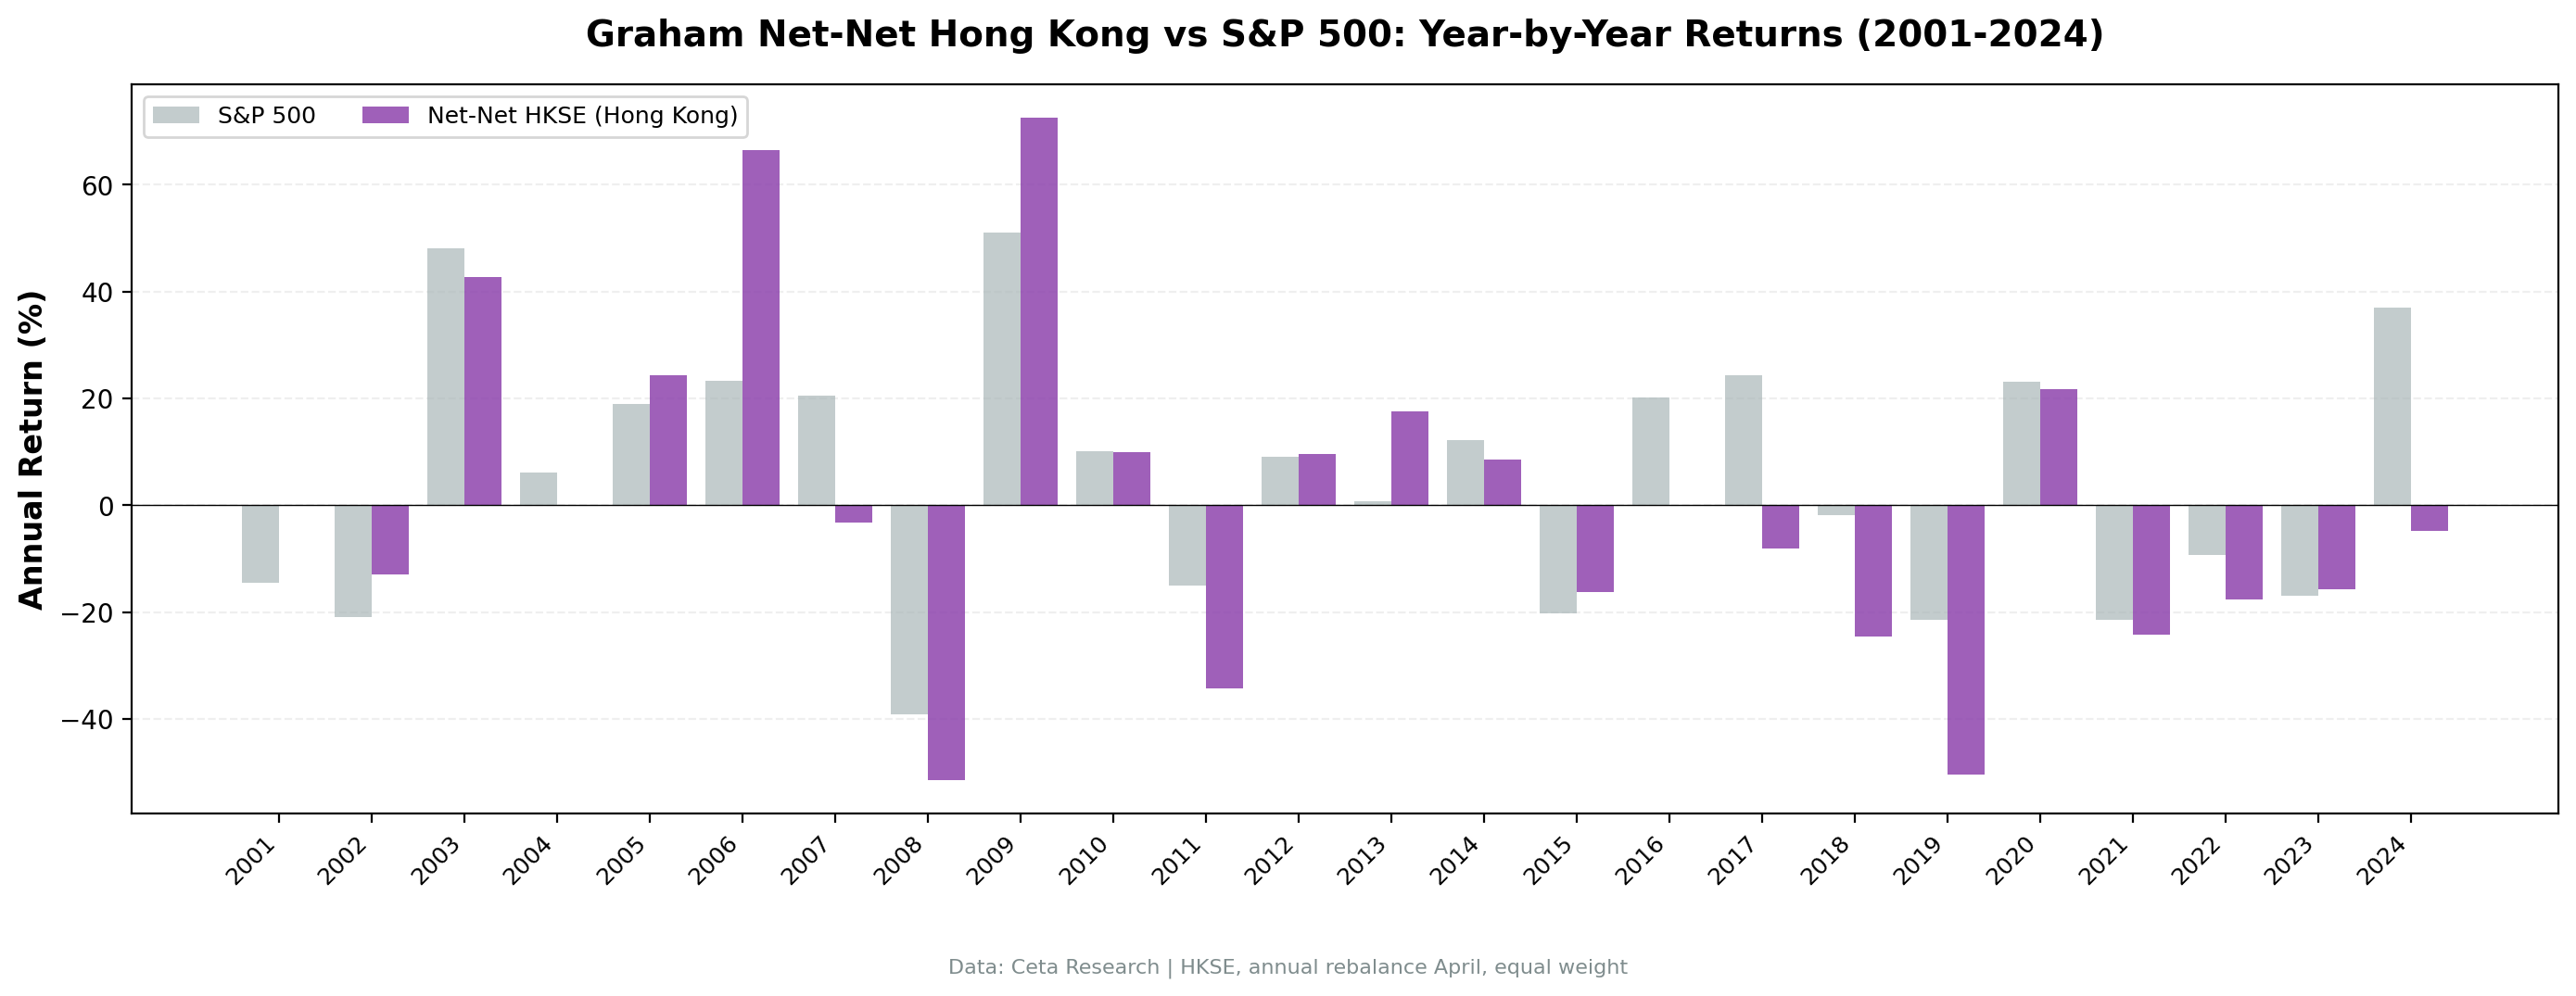
The year-by-year pattern shows the strategy worked before 2015, producing spectacular recoveries: +59% in 2006, +70% in 2009. After 2015, it collapsed and never recovered. That breakdown aligns with a real structural shift in Hong Kong's markets.
Data: FMP financial data warehouse, 2000–2025. Updated March 2026.
Method
| Parameter | Value |
|---|---|
| Universe | HKSE (Hong Kong Stock Exchange) |
| Rebalancing | Annual (April) |
| Holding period | 12 months |
| Signal | Stock price < NCAV per share |
| Max positions | 30 stocks, equal weight |
| Cash rule | Fewer than 5 qualifying stocks |
| Market cap floor | HK$200M (~$26M USD) |
| Data source | FMP via Ceta Research warehouse |
| Benchmark | Hang Seng Index |
| Period | 2001-2024 |
| Filing lag | 45 days (point-in-time) |
What is NCAV?
Net Current Asset Value is Benjamin Graham's liquidation measure. The formula: Current Assets minus Total Liabilities minus Preferred Stock, expressed per share. A company trading below this threshold is priced below what you'd get if you shut down the business, sold everything liquid, and paid off all debts.
Graham argued in Security Analysis (1934) that these stocks offered a "margin of safety" because even in the worst case, the liquidation value exceeded the purchase price. The modern academic literature confirms the premium existed historically. Oppenheimer (1986) found 29.4% annual returns for US net-nets from 1970-1983. The question is whether that premium persists, and where.
We use FMP's grahamNetNet field from key_metrics, which computes NCAV per share directly. Entry price must exceed $0.50 to exclude penny stocks. Maximum single-year return is capped at 300% to limit the impact of outliers. Transaction costs are size-tiered based on the market cap of holdings.
What We Found
24-year summary (2001-2024):
| Metric | Net-Nets (HKSE) | Hang Seng |
|---|---|---|
| CAGR | -0.26% | 2.53% |
| Total Return | -6.13% | 82.31% |
| Sharpe Ratio | -0.121 | -0.020 |
| Sortino Ratio | -0.195 | -0.031 |
| Calmar Ratio | -0.005 | 0.058 |
| Max Drawdown | -55.51% | -43.90% |
| Volatility | 26.94% | 23.78% |
| Win Rate vs Hang Seng | 50.0% | -- |
| Cash Periods | 3 of 24 (13%) | -- |
| Avg Stocks | 24.6 | -- |
| Beta | 0.874 | 1.0 |
| Alpha | -2.86% | -- |
| Up Capture | 86.91% | 100% |
| Down Capture | 106.32% | 100% |

The down capture of 106.32% shows Hong Kong net-nets fell slightly harder than the Hang Seng during downturns. The up capture of 86.91% means the portfolio participated in most upside moves. The 50% win rate vs the Hang Seng shows the strategy matched the local benchmark half the time.
Year-by-year returns:
| Year | Net-Nets | Hang Seng | Excess | Notes |
|---|---|---|---|---|
| 2001 | 0.0% | -14.5% | +14.5% | Cash (avoided crash) |
| 2002 | -13.0% | -21.0% | +8.0% | Beat Hang Seng |
| 2003 | 0.0% | +48.1% | -48.1% | Cash |
| 2004 | 0.0% | +6.1% | -6.1% | Cash |
| 2005 | +24.6% | +18.9% | +5.7% | China growth spillover |
| 2006 | +59.4% | +23.3% | +36.1% | Best year, pre-crisis boom |
| 2007 | -8.0% | +20.5% | -28.5% | |
| 2008 | -48.1% | -39.2% | -9.0% | GFC, fell harder |
| 2009 | +70.1% | +51.0% | +19.1% | Post-GFC recovery |
| 2010 | +15.4% | +10.1% | +5.2% | Beat by 5pp |
| 2011 | -29.1% | -15.0% | -14.0% | Eurozone crisis |
| 2012 | +9.6% | +9.0% | +0.6% | Matched Hang Seng |
| 2013 | +21.7% | +0.7% | +21.0% | Beat by 21pp |
| 2014 | +7.4% | +12.2% | -4.8% | |
| 2015 | -18.6% | -20.2% | +1.6% | Inflection point |
| 2016 | +4.6% | +20.2% | -15.6% | |
| 2017 | +4.8% | +24.4% | -19.6% | |
| 2018 | -12.4% | -1.8% | -10.6% | Trade war begins |
| 2019 | -29.8% | -21.4% | -8.4% | Protests, worst year |
| 2020 | +33.4% | +23.2% | +10.2% | COVID recovery beat |
| 2021 | -17.1% | -21.5% | +4.4% | Beat during crackdown |
| 2022 | -10.3% | -9.3% | -1.0% | Matched Hang Seng |
| 2023 | -14.0% | -17.0% | +3.1% | Beat by 3pp |
| 2024 | +22.1% | +37.0% | -15.0% |
The Two Eras
The data splits cleanly into two periods.
2001-2014: the strategy worked. Net-nets produced positive returns in 9 of 11 invested years. The recovery trades were powerful: +59% in the China boom (2006), +70% post-GFC (2009). These are the kinds of returns Graham's theory predicts. Distressed companies with high liquidation margins recover sharply when fear subsides. Hong Kong's deep ties to mainland China growth gave these recoveries extra fuel.
2015-2024: the strategy collapsed. Net-nets lost money in 8 of 10 years. The cumulative return from 2015 forward is approximately -76%. Five consecutive losing years (2017-2021) with no recovery in between.
This isn't noise. Hong Kong experienced real structural change:
2018-2019: Trade war and protests. US-China trade tensions hit Hong Kong's role as a financial gateway. The 2019 protests triggered capital flight and consumer spending collapse. Net-nets, concentrated in small manufacturers and retailers, took the full impact. The -29.8% return in 2019 is the worst year, underperforming the Hang Seng's -21.4% by 8.4pp.
2020-2023: Regulatory regime change. Beijing's National Security Law (2020), tech sector crackdowns (2021), and COVID-zero policies shifted Hong Kong's business environment. Foreign capital left. The Hang Seng Index itself fell 40% from its 2021 peak to its 2022 trough. Net-net stocks, already trading at distressed valuations, had no floor beneath them.
Capital flight is the mechanism. Net-nets require buyers to eventually close the gap between market price and liquidation value. When capital is leaving a market, that repricing doesn't happen. The stocks stay cheap or get cheaper. Liquidation value means nothing if there's no one willing to buy at any price.
The Drawdown Story
The -55.51% max drawdown is significantly worse than the Hang Seng's -43.90%, but the down capture of 106.32% shows net-nets only fell 6.32% harder than the local benchmark during downturns. This is far better than many other NCAV markets.
Net-net stocks in Hong Kong are small, illiquid companies. When markets sell off, liquidity dries up fastest in the smallest names. But the strategy's 86.91% up capture shows it participated strongly in recoveries. The issue wasn't asymmetric participation; it was the post-2015 structural regime change.
Backtest Methodology
- Data: FMP financial data via Ceta Research warehouse. Price data from
stock_eod(HKD-denominated, adjusted closes). - Signal:
grahamNetNetfromkey_metrics. Stock price must be below NCAV per share. - Point-in-time: 45-day filing lag. April rebalance uses prior fiscal year financials.
- Market cap threshold: HK$200M minimum (~$26M USD).
- Entry price: >$0.50 (HKD) to exclude penny stocks.
- Return cap: 300% maximum single-stock return per year.
- Transaction costs: Size-tiered based on market cap of holdings.
- Equal weight: Up to 30 positions. Cash if fewer than 5 qualify.
- Benchmark: Hang Seng Index total return (HKD).
Limitations
The -55.51% max drawdown is the real risk. Even if you believed the pre-2015 pattern would continue, you'd need to survive a 56% peak-to-trough decline. Most investors can't.
Currency exposure. Returns are in HKD, which is pegged to USD, so currency risk is minimal compared to other Asian markets. The losses are in real equity terms.
Small, illiquid names. Average of 24.6 stocks per period means the portfolio was well-populated. But these are small companies by global standards. Executing 30 equal-weight positions in HK$200M-cap stocks would move prices in practice.
Structural break may be permanent. The post-2015 collapse aligns with a fundamental change in Hong Kong's political and economic relationship with mainland China. There's no reason to expect the pre-2015 pattern to return.
Only 3 cash years. Unlike UK or Taiwan (7+ cash years each), HKSE almost always had enough qualifying net-nets. That's not a positive signal. It means the market consistently had 20+ stocks priced below liquidation value, and they kept falling anyway.
Takeaway
Hong Kong net-nets returned -0.26% annually against the Hang Seng's +2.53%, a -2.80% deficit. Compared to global benchmarks like the S&P 500, the underperformance was severe. But against the local market, the story is more nuanced: the strategy worked pre-2015, producing powerful recoveries. The post-2015 collapse shows what happens when structural regime change removes the recovery catalyst.
Net-nets don't protect against capital flight. When investors leave a market, stocks priced below liquidation value can stay below liquidation value indefinitely. The margin of safety is only as good as the market's ability to eventually reprice.
Part of a Series
This is part of a multi-exchange NCAV net-net study:
References
- Graham, B. & Dodd, D. (1934). Security Analysis. McGraw-Hill.
- Oppenheimer, H. (1986). Ben Graham's Net Current Asset Values: A Performance Update. Financial Analysts Journal.
Data: FMP via Ceta Research warehouse, 2001-2024
Past performance does not guarantee future results. This is educational content, not investment advice.


