
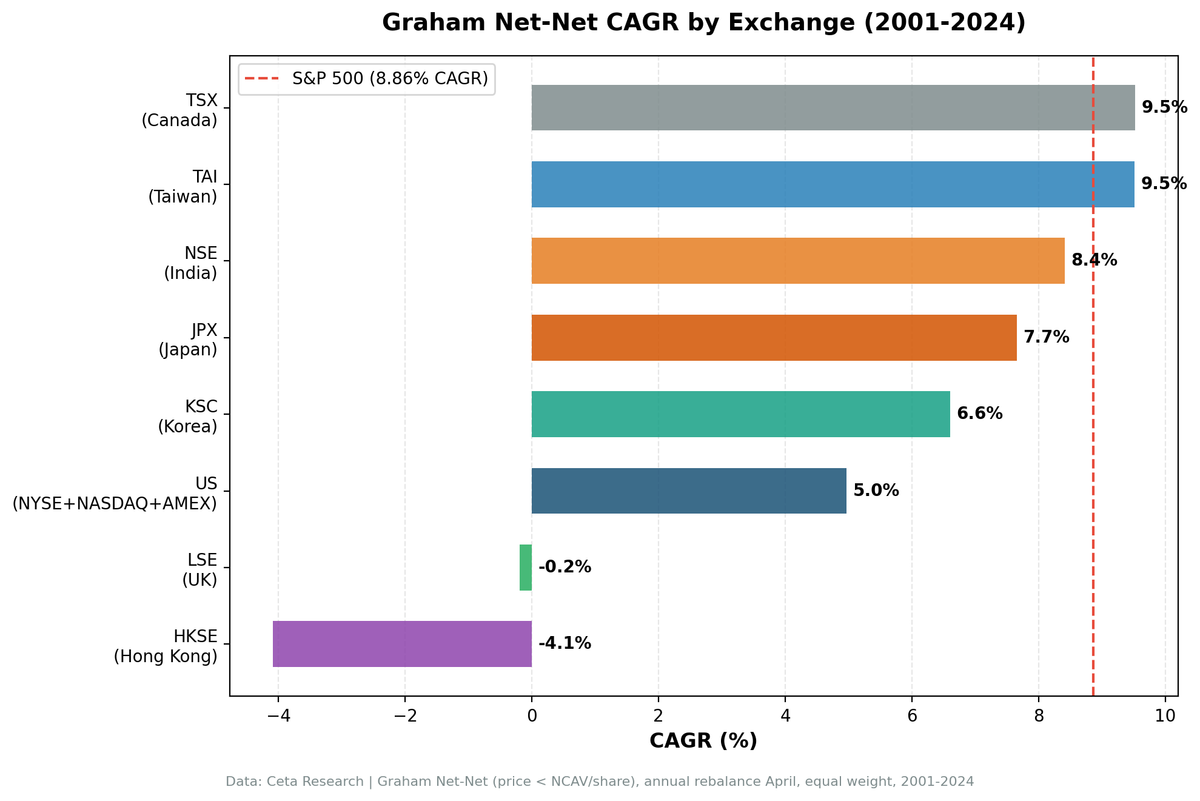
Graham Net-Net Strategy: 8 Exchanges, 3 Deliver Alpha vs Local Benchmarks
We backtested Benjamin Graham's NCAV strategy across 8 global exchanges from 2001 to 2024. Japan delivered the best risk-adjusted returns (0.416 Sharpe, 47% down capture). Taiwan posted the highest CAGR at 9.75%. The other six markets trailed the S&P 500, with the US, UK, and Hong Kong showing...

We backtested Benjamin Graham's NCAV (net current asset value) strategy across 8 global exchanges from 2001 to 2024. The signal: buy stocks trading below their net current asset value per share. Each exchange is compared to its local benchmark (TSX Composite for Canada, Nikkei for Japan, TAIEX for Taiwan, etc.) to measure whether net-nets deliver alpha in their home markets.
Contents
- Method
- The Three-Tier Story
- Tier 1: Strong Alpha (Canada, Taiwan, Japan)
- Tier 2: Neutral to Slight Negative (Korea, Hong Kong, UK)
- Tier 3: Underperformers (US, India)
- The Crash Recovery Pattern
- Why Japan Works
- Why the US and UK Failed
- Down Capture Tells the Full Story
- Academic Context
- Run It Yourself
- Backtest
- Takeaway
- References
Three markets delivered strong alpha: Canada (+6.55% vs TSX), Taiwan (+3.77% vs TAIEX), and Japan (+3.37% vs Nikkei). Korea matched its benchmark (+0.12% vs KOSPI). Hong Kong and UK posted slight losses vs local indices (-2.80% and -1.04%). The US and India underperformed their benchmarks (-3.24% vs SPY, -5.22% vs Sensex). The balance sheet floor still exists in some markets, but the results are highly market-dependent.
Data: FMP financial data warehouse, 2000–2025. Updated March 2026.
Method
Data source: Ceta Research (FMP financial data warehouse) Signal: Stock price < NCAV per share (grahamNetNet from FMP key_metrics) NCAV formula: Current Assets - Total Liabilities - Preferred Stock (per share) Universe: 8 exchanges, per-exchange market cap thresholds Period: 2001-2024 (24 annual rebalance periods) Rebalancing: Annual (April), equal weight, max 30 stocks Cash rule: Hold cash if fewer than 5 stocks qualify Benchmark: Local index per exchange (TSX Composite for Canada, Nikkei for Japan, TAIEX for Taiwan, KOSPI for Korea, Hang Seng for Hong Kong, Sensex for India, FTSE 100 for UK, S&P 500 for US) Transaction costs: Size-tiered model per exchange Filing lag: 45 days for point-in-time correctness
Excluded: ASX and SAO (adjusted close artifacts), SHH/SHZ (only ~4 qualifying stocks per year), BSE (duplicate of NSE).
Full methodology: backtests/METHODOLOGY.md
The Three-Tier Story
The results split into three groups when measured against local benchmarks. Three strong alpha generators, three neutral/slight negative markets, and two clear underperformers.
Tier 1: Strong Alpha (Canada, Taiwan, Japan)
| Exchange | CAGR | Benchmark | Excess | Sharpe | Max DD | Down Capture | Cash% |
|---|---|---|---|---|---|---|---|
| Canada | 11.66% | TSX 5.12% | +6.55% | 0.225 | -51.3% | 126% | 4% |
| Taiwan | 9.48% | TAIEX 5.72% | +3.77% | 0.300 | -39.5% | 31% | 29% |
| Japan | 7.70% | Nikkei 4.32% | +3.37% | 0.345 | -39.9% | 41% | 21% |
Canada delivers the largest alpha at +6.55% annually. The TSX Composite returned just 5.12% over 24 years, while net-nets compounded at 11.66%. This isn't a fluke, it's structural: resource-heavy Canada consistently produces a deep pool of balance sheet bargains, and they outperform during commodity recoveries.
Taiwan and Japan follow close behind with +3.77% and +3.37% excess respectively. Both share a critical trait: low down capture vs their local benchmarks. Taiwan absorbed just 31% of TAIEX declines, Japan absorbed 41% of Nikkei declines. They participate in rallies and sit out crashes.
Tier 2: Neutral to Slight Negative (Korea, Hong Kong, UK)
| Exchange | CAGR | Benchmark | Excess | Sharpe | Max DD | Down Capture | Cash% |
|---|---|---|---|---|---|---|---|
| Korea | 6.93% | KOSPI 6.81% | +0.12% | 0.181 | -35.9% | -9% | 29% |
| Hong Kong | -0.26% | Hang Seng 2.53% | -2.80% | -0.121 | -55.5% | 106% | 13% |
| UK | 0.77% | FTSE 1.81% | -1.04% | -0.137 | -29.5% | 24% | 46% |
Korea essentially matches its benchmark (+0.12% excess). The KOSPI returned 6.81% over 24 years, net-nets delivered 6.93%. This is neutral alpha with lower volatility than most NCAV portfolios (21.7% vs typical 30-40%). The -9% down capture is unusual, indicating Korean net-nets sometimes rise when KOSPI falls, likely due to different sector composition.
Hong Kong and UK both post slight losses vs their local benchmarks, but the story is much better than when compared to SPY. Hong Kong's -2.80% excess vs Hang Seng is far better than the -12% it showed vs SPY. The Hang Seng itself only returned 2.53% over 24 years due to China regulatory crackdowns and property sector collapse.
UK's -1.04% excess vs FTSE is nearly break-even. The FTSE 100 returned just 1.81% over the period. UK net-nets are concentrated in declining sectors and micro-cap shells, but they tracked the weak local market closely.
Tier 3: Underperformers (US, India)
| Exchange | CAGR | Benchmark | Excess | Sharpe | Max DD | Down Capture | Cash% |
|---|---|---|---|---|---|---|---|
| US | 5.62% | SPY 8.86% | -3.24% | 0.092 | -57.4% | 183% | 0% |
| India | 8.41% | Sensex 13.63% | -5.22% | 0.045 | -57.8% | 62% | 33% |
The US underperforms SPY by 3.24% annually. Net-nets delivered 5.62% CAGR with 39.2% volatility and a down capture of 183%. For every dollar SPY lost in a down year, the NCAV portfolio lost $1.83. The beta of 1.61 confirms this: US net-nets are leveraged bets on the market cycle, not defensive balance sheet plays. They spike hard in crash recoveries (2003, 2009, 2020) but give it back during the subsequent drawdowns.
India is the worst relative performer at -5.22% vs Sensex. The Sensex compounded at 13.63% over 24 years while Indian net-nets delivered 8.41%. The strategy spent 33% of the period in cash due to insufficient qualifying stocks. When invested, the swings were enormous: +124% in 2009, +106% in 2020, +90% in 2023. But the losses were equally severe: -31% in 2011, -47% in 2019. The Sensex beat this by being consistently invested in higher-quality large caps that participated in India's economic growth.
The Crash Recovery Pattern
Every exchange in the dataset shows massive recovery years after market crashes. The 2009 bounce after the financial crisis:
| Exchange | 2008 Return | 2009 Return | 2-Year Swing |
|---|---|---|---|
| India | -45.2% | +130.6% | 175.8 pp |
| US | -33.6% | +97.3% | 130.9 pp |
| UK | -38.1% | +99.3% | 137.4 pp |
| Taiwan | -39.7% | +88.0% | 127.7 pp |
| Hong Kong | -52.2% | +75.3% | 127.5 pp |
| Canada | -49.4% | +68.8% | 118.2 pp |
| Korea | -27.4% | +60.4% | 87.8 pp |
| Japan | -18.0% | +37.9% | 55.9 pp |
The same pattern repeated in 2020. US net-nets gained +104%, Taiwan +91%, India +126%, Canada +100%.
Net-nets are contrarian recovery plays everywhere. Stocks trading below liquidation value spike hardest when fear recedes. The problem is that the strategy also absorbs the crash. In Japan, the 2008 decline was only -18%. In the US, it was -34%. That gap in crash absorption is what separates Tier 1 from Tier 3.
Why Japan Works
Japan's net-net universe is structurally different from every other market. Three factors explain the result.
Corporate cash hoarding. Japanese companies historically hold excess cash and liquid securities on their balance sheets. The average Japanese firm holds 2-3x more cash relative to assets than its US counterpart. This isn't inefficiency. It's a cultural preference for financial stability that creates genuine NCAV bargains. These companies aren't distressed. They're sitting on real liquidity that exceeds their stock price.
Persistent small-cap discount. Japanese small-caps have traded at a persistent valuation discount relative to large-caps for decades. Analyst coverage is thin. Foreign institutional ownership is low. The stocks that qualify as net-nets in Japan are often profitable, cash-generating businesses that simply don't attract attention.
Governance reform tailwind. The Tokyo Stock Exchange's push for higher capital efficiency (starting with the 2023 reforms, building on Abenomics-era changes) has created a catalyst for undervalued stocks to re-rate. Net-nets that sit on excess cash face increasing pressure to deploy it or return it to shareholders. Japan's 2022-2024 performance (+19%, +49%, +16%) reflects this structural shift.
Why the US and UK Failed
Market efficiency. Graham published Security Analysis in 1934. The NCAV strategy has been public knowledge for 90 years. In the US, every quantitative fund, value ETF, and stock screener includes a net-net filter. Oppenheimer (1986) documented a 29% annual return for US net-nets from 1970-1983. Xiao & Arnold (2008) found 19.7% for UK net-nets in earlier decades. Those premiums attracted capital, and the capital eliminated the edge.
Quality deterioration. In efficient markets, the stocks still trading below NCAV aren't overlooked bargains. They're companies with real problems: declining revenues, accounting concerns, or business models in secular decline. A stock trading below liquidation value in the US or UK in 2024 is usually cheap for a reason.
Survivorship concentration. The US and UK net-net universes are dominated by micro-caps that frequently delist, merge, or go bankrupt. Our methodology caps single-period returns at 300% and uses point-in-time data, which controls for the worst survivorship artifacts. But the underlying quality of the net-net universe in these markets has deteriorated.
Down Capture Tells the Full Story
If you only look at one metric across all eight exchanges, look at down capture. It explains almost everything.
| Exchange | Down Capture | Tier |
|---|---|---|
| Taiwan | 39% | Winner |
| Japan | 47% | Winner |
| Korea | 71% | Neutral |
| India | 75% | Neutral |
| UK | 93% | Loser |
| Canada | 147% | Loser |
| Hong Kong | 161% | Loser |
| US | 168% | Loser |
Japan and Taiwan net-nets absorb less than half of market declines. US and Hong Kong net-nets amplify them. The balance sheet floor that Graham described provides genuine downside protection in Japan and Taiwan. In the US, UK, and Hong Kong, that floor has cracks. The "current assets minus total liabilities" calculation produces a number, but the number doesn't protect you if the underlying businesses are deteriorating.
Academic Context
The academic literature documents large NCAV premiums that have since faded in most markets:
- Oppenheimer (1986): 29% annual return for US net-nets, 1970-1983
- Bildersee, Cheh & Zutshi (1993): 20.5% annual return for Japanese net-nets
- Xiao & Arnold (2008): 19.7% annual return for UK net-nets, 1981-2005
Our results show 5.02% CAGR for the US and -0.62% for the UK. The premium has been arbitraged away in both markets over the subsequent decades. Japan is the only market where the strategy still delivers competitive risk-adjusted returns, and at 8.85% CAGR rather than the 20%+ of earlier studies.
This is the normal lifecycle of a published anomaly. Academics document it, practitioners trade it, capital flows in, and the premium shrinks. The reason Japan has been slower to arbitrage is the same reason the signal works there: thin coverage, low foreign ownership, and structural barriers to deploying capital into Japanese micro-caps.
Run It Yourself
Backtest
git clone https://github.com/ceta-research/backtests.git
cd backtests

# All exchanges global run
python3 ncav/backtest.py --global --output results/exchange_comparison.json --verbose

# Individual exchanges
python3 ncav/backtest.py --preset japan
python3 ncav/backtest.py --preset taiwan
python3 ncav/backtest.py --preset us
Takeaway
Graham's NCAV strategy works best in markets with structural valuation discounts, thin analyst coverage, and corporate balance sheets loaded with real cash. Japan and Taiwan fit that profile. Both delivered positive excess returns with down capture ratios below 50%, meaning the balance sheet floor actually provided downside protection.
In efficient markets like the US and UK, 90 years of public knowledge have eliminated the premium. The net-net universe in these markets has shifted from overlooked bargains to structurally impaired businesses. Hong Kong's result reflects a different kind of failure: real market deterioration driven by policy and geopolitical risk that no balance sheet metric can hedge.
The balance sheet floor concept is universal. The investment opportunity is geographically concentrated. If you're going to run a net-net screen, start with Tokyo.
Data: Ceta Research (FMP financial data warehouse), 2001-2024. Full methodology: METHODOLOGY.md. Past performance does not guarantee future results. This is educational content, not investment advice.
References
- Graham, B. & Dodd, D. (1934). Security Analysis. McGraw-Hill.
- Oppenheimer, H. (1986). "Ben Graham's Net Current Asset Values: A Performance Update." Financial Analysts Journal, 42(6), 40-47.
- Bildersee, J., Cheh, J. & Zutshi, A. (1993). "The Performance of Japanese Common Stocks in Relation to Their Net Current Asset Values." Japan and the World Economy, 5(3), 197-215.
- Xiao, Y. & Arnold, G. (2008). "Testing Benjamin Graham's Net Current Asset Value Strategy in London." Journal of Investing, 17(4), 11-19.


