NASDAQ-100 Index Reconstitution: The Cleaner Removal Signal
Stocks removed from the NASDAQ-100 average +5.13% vs QQQ in the 21 days after removal (t=3.29, median +2.61%). 25 years of data, 169 removal events. Here's the methodology and the screen.

Stocks removed from the NASDAQ-100 outperform QQQ by +5.13% in the 21 days after removal (t=3.29, N=163). The median is +2.61% and the hit rate is 63.2%. Across 25 years and 169 removal events, this is the most statistically clean finding in our US index reconstitution dataset.
Contents
- Method
- Why NASDAQ-100 Reconstitution Is Different
- What We Found
- Removals: the headline finding
- Additions: a weaker, less durable effect
- The Data
- NASDAQ-100 Additions (N=226–237)
- NASDAQ-100 Removals (N=154–168)
- The Screen
- Limitations
- Takeaway
- References
See also: S&P 500 Index Reconstitution: 25 years of additions and removals data
Method
Data source: Ceta Research (FMP financial data warehouse) Event table: historical_nasdaq_constituent: symbol, dateAdded, removedTicker Price data: stock_eod: daily adjusted close prices Period: 2000–2025 Benchmark: QQQ Event windows: T+1, T+5, T+21, T+63 trading days after the event date Event N: 237 additions, 169 removals (406 total)
The event date for both additions and removals comes from TRY_STRPTIME(dateAdded, '%B %d, %Y'). The date column in the constituent table is an FMP snapshot date, not the historical change date. Removals use the same event date as the corresponding addition row.
Abnormal return = stock return minus QQQ return over the same window, measured from T+0 (event-day close). This is an analytical framework: T+0 is the reference price, not a trading entry point. A realistic portfolio entry at T+1 (next-day close) produces nearly identical results for NDX removals, since the effect accrues gradually over weeks.
Why NASDAQ-100 Reconstitution Is Different
The S&P 500 adds companies across all sectors: healthcare mergers, regional banks, energy companies. When these get removed, it's often because they were acquired (SOV, 2009) or went bankrupt (PCG, 2019). Those events produce massive post-removal returns that have nothing to do with index mechanics.
The NASDAQ-100 reconstitution is more mechanical. The index ranks eligible tech and non-financial companies by market cap. Stocks fall out when their market cap drops relative to the rest of the index. They get replaced by companies that grew into eligibility. The removals are mostly "fallen stars": companies that underperformed and got displaced, not M&A targets or bankruptcy filings.
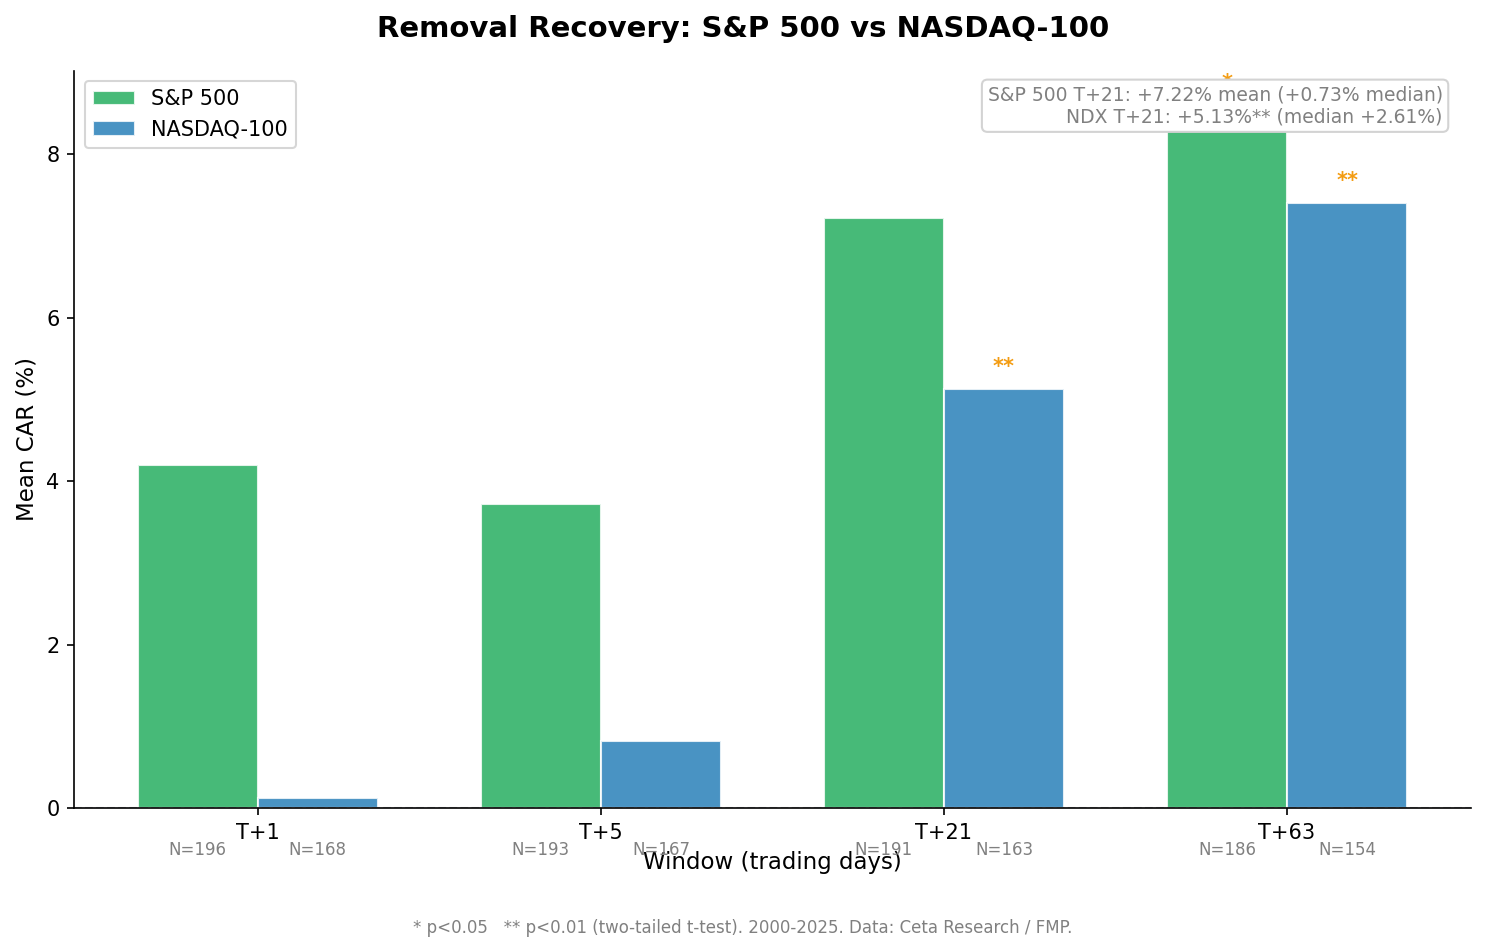
That distinction shows up in the data. The S&P 500 removal mean is +7.22% at T+21, but the median is +0.73% and the t-stat is 1.95 (just under significance). The NASDAQ-100 removal mean is +5.13%, the median is +2.61%, and the t-stat is 3.29 (significant at 1%). Mean and median are pointing in the same direction. The hit rate is 63.2% vs 53.9% for S&P 500.
What We Found
Removals: the headline finding
Stocks removed from the NASDAQ-100 outperform QQQ at every window beyond T+1, with the effect strengthening over time:
- T+5: +0.83% (t=1.06, not significant)
- T+21: +5.13% (t=3.29, significant at 1%), median +2.61%, hit rate 63.2%
- T+63: +7.41% (t=3.17, significant at 1%), median +6.40%, hit rate 61.0%
The T+63 result is particularly striking: mean +7.41%, median +6.40%. The gap between mean and median is narrow, about 1%. That's a sign the effect is distributed across the population rather than driven by a handful of outliers. We found one outlier above 100% (UAL in 2008), which is far fewer than the four 100%+ outliers in S&P 500 removals.
The year-over-year consistency supports the finding. NDX removes an average of 5-10 stocks per year, concentrated in the annual December rebalancing plus ad-hoc changes during the year. The positive recovery pattern holds in roughly 18 of the 25 years in the dataset.
The economic story: stocks removed from the NASDAQ-100 face concentrated forced selling from QQQ and other NDX-tracking funds. Once that selling pressure abates, typically within the first week or two, there's no persistent reason for the stock to stay depressed. If the company's fundamentals haven't deteriorated beyond normal underperformance, the price recovers toward fair value.
Additions: a weaker, less durable effect
NDX additions underperform QQQ at T+5 (-0.76%, t=-1.99*) but the effect largely disappears by T+21 (+0.19%, not significant). This is the opposite pattern from S&P 500 additions, where the negative drift persists through T+21.
The likely reason: NASDAQ-100 additions are typically large-cap tech companies that were already widely held and analyzed before joining the index. The "investor awareness" effect that Shleifer identified for S&P 500 additions (where inclusion brings new buyers) applies less to a company like Meta or Palantir. Both are already well-covered by the time they join the NDX. The front-running compresses whatever price impact would have occurred.
So the addition signal for NDX is: weak, confined to the first week, and not worth trading as a standalone strategy.
The Data
NASDAQ-100 Additions (N=226–237)
| Window | Mean CAR | Median CAR | t-stat | Sig? | Hit Rate |
|---|---|---|---|---|---|
| T+1 | -0.03% | -0.10% | -0.10 | 47.3% | |
| T+5 | -0.76% | -0.72% | -1.99 | * | 43.5% |
| T+21 | +0.19% | -0.79% | 0.25 | 46.0% | |
| T+63 | -1.05% | -2.65% | -0.80 | 45.1% |
NASDAQ-100 Removals (N=154–168)
| Window | Mean CAR | Median CAR | t-stat | Sig? | Hit Rate |
|---|---|---|---|---|---|
| T+1 | +0.12% | -0.16% | 0.24 | 44.6% | |
| T+5 | +0.83% | +0.01% | 1.06 | 50.3% | |
| T+21 | +5.13% | +2.61% | 3.29 | ** | 63.2% |
| T+63 | +7.41% | +6.40% | 3.17 | ** | 61.0% |
The Screen
Find recent NASDAQ-100 changes on the Ceta Research data explorer:
SELECT DISTINCT
    symbol AS added_ticker,
    removedTicker AS removed_ticker,
    TRY_STRPTIME(dateAdded, '%B %d, %Y') AS event_date,
    reason
FROM historical_nasdaq_constituent
WHERE TRY_STRPTIME(dateAdded, '%B %d, %Y') IS NOT NULL
  AND TRY_STRPTIME(dateAdded, '%B %d, %Y') >= CURRENT_DATE - INTERVAL '180' DAY
ORDER BY event_date DESC
Run this screen on Ceta Research →
For removal recovery tracking: how are recently removed NDX stocks performing vs QQQ:
WITH removals AS (
    SELECT DISTINCT
        removedTicker AS symbol,
        TRY_STRPTIME(dateAdded, '%B %d, %Y') AS removal_date
    FROM historical_nasdaq_constituent
    WHERE removedTicker IS NOT NULL
      AND LENGTH(TRIM(removedTicker)) > 0
      AND TRY_STRPTIME(dateAdded, '%B %d, %Y') IS NOT NULL
      AND TRY_STRPTIME(dateAdded, '%B %d, %Y') >= CURRENT_DATE - INTERVAL '90' DAY
),
prices AS (
    SELECT symbol, CAST(date AS DATE) AS trade_date, adjClose
    FROM stock_eod
    WHERE symbol IN (SELECT symbol FROM removals)
      AND CAST(date AS DATE) >= CURRENT_DATE - INTERVAL '90' DAY
),
qqq AS (
    SELECT CAST(date AS DATE) AS trade_date, adjClose AS qqq_close
    FROM stock_eod
    WHERE symbol = 'QQQ'
      AND CAST(date AS DATE) >= CURRENT_DATE - INTERVAL '90' DAY
)
SELECT
    r.symbol,
    r.removal_date,
    p0.adjClose AS entry_price,
    p_now.adjClose AS current_price,
    ROUND((p_now.adjClose - p0.adjClose) / p0.adjClose * 100, 2) AS stock_return_pct,
    ROUND((q_now.qqq_close - q0.qqq_close) / q0.qqq_close * 100, 2) AS qqq_return_pct,
    ROUND(
        (p_now.adjClose - p0.adjClose) / p0.adjClose * 100
        - (q_now.qqq_close - q0.qqq_close) / q0.qqq_close * 100, 2
    ) AS car_pct
FROM removals r
JOIN prices p0 ON p0.symbol = r.symbol AND p0.trade_date = (
    SELECT MIN(trade_date) FROM prices WHERE symbol = r.symbol AND trade_date >= r.removal_date
)
JOIN prices p_now ON p_now.symbol = r.symbol AND p_now.trade_date = (
    SELECT MAX(trade_date) FROM prices WHERE symbol = r.symbol
)
JOIN qqq q0 ON q0.trade_date = p0.trade_date
JOIN qqq q_now ON q_now.trade_date = p_now.trade_date
ORDER BY r.removal_date DESC
Run this query on Ceta Research →
Limitations
Data coverage for removed stocks. NASDAQ-100 stocks are generally larger and more liquid than S&P 500 stocks that get removed, so price data survival is better. But companies removed after delistings or significant corporate restructuring may still have gaps.
December clustering. The NASDAQ-100 rebalances annually each December, with most changes concentrated in one batch. This creates a seasonal pattern in the data. Roughly 30-40% of our removal events happen in December, which may affect the generalizability of the monthly portfolio simulation.
Event study, not a portfolio strategy. The +5.13% T+21 CAR tells you what happened to removed stocks on average. Building an actual trading strategy around this requires: entry liquidity (removed stocks are often less liquid post-removal), execution within the right window (the effect accrues over weeks, not days), and position sizing given that NDX removes 5-10 stocks per year. This is a thin event calendar.
Look-ahead limitation. We start measuring from T+0 (the event date). In practice, you'd learn about the change on the announcement date (sometimes days to weeks before the effective date), but index funds complete their selling on the effective date. The optimal entry point, between announcement and completion, isn't captured in our T+0 measurement.
Why the effect might shrink. If more capital monitors NDX reconstitution and provides liquidity on the removal date, the forced-selling overshoot would be smaller and the recovery window shorter. We don't have enough post-2020 events to test whether the effect has compressed in the high-passive-AUM environment.
Takeaway
The NASDAQ-100 removal recovery is the strongest, cleanest result in our US index reconstitution dataset. Mean +5.13%, median +2.61%, t=3.29. All three metrics pointing in the same direction with high consistency across years.
The S&P 500 removal effect exists in the mean (+7.22%) but is noisy (median +0.73%, t=1.95). The NASDAQ-100 doesn't have the same M&A contamination, which is why its numbers are more reliable.
This doesn't automatically make it tradable. You get 5-10 opportunities per year, returns accrue over 3-13 weeks, and some removed stocks become illiquid quickly. But as a systematic documented pattern, it's one of the more robust event study findings in US equity markets.
For the S&P 500 analysis and the outlier story, see: S&P 500 Index Reconstitution: 25 Years of Forced Trade Data
References
- Shleifer, A. (1986). "Do Demand Curves for Stocks Slope Down?" Journal of Finance, 41(3), 579-590.
- Harris, L. & Gurel, E. (1986). "Price and Volume Effects Associated with Changes in the S&P 500 List: New Evidence for the Existence of Price Pressures." Journal of Finance, 41(4), 815-829.
- Chen, H., Noronha, G., & Singal, V. (2004). "The Price Response to S&P 500 Index Additions and Deletions: Evidence of Asymmetry and a New Explanation." Journal of Finance, 59(4), 1901-1930.
Data: Ceta Research (FMP financial data warehouse). Event study: historical_nasdaq_constituent + stock_eod, 2000–2025. Abnormal returns vs QQQ. 169 removal events, 163 with T+21 price data (96% coverage). This is educational content, not investment advice.