
12-Month Momentum on UK Stocks: +7.59% Alpha vs FTSE 100
Pure 12-month price momentum on LSE stocks from 2000 to 2025 delivered 8.67% annually, +7.59% over the FTSE 100, with down capture of 58%. In most non-global-crisis downturns, the portfolio fell about 42% less than the FTSE 100. The UK is a consistent momentum market.

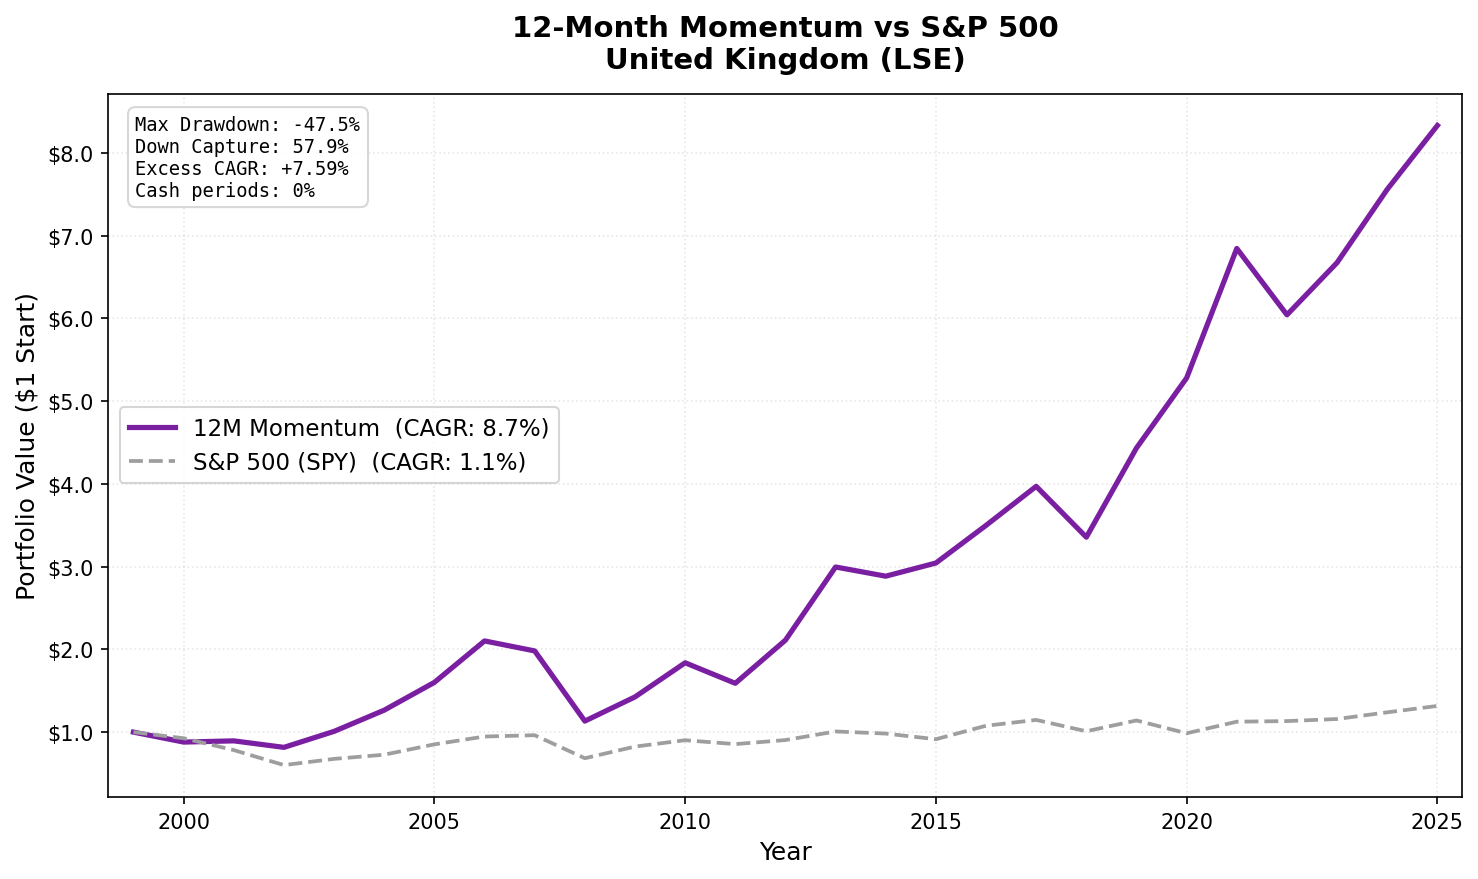
The UK equity market doesn't generate as much momentum research attention as the US or India. That's a gap. Pure 12-month price momentum on LSE stocks from 2000 to 2025 delivered 8.67% annually, 7.59% above the FTSE 100 benchmark, with a down capture of 57.91%. The portfolio fell about 42% less than the FTSE 100 in market downturns, on average, while outperforming over the full period. That combination of excess return and downside protection is relatively rare.
Contents
- Method
- What We Found
- Backtest Methodology
- Why the UK Works
- Limitations
- Takeaway
- Part of a Series
- References
- Run This Screen Yourself
Data: FMP financial data warehouse, 2000–2025. Updated May 2026.
Method
| Parameter | Value |
|---|---|
| Universe | LSE (London Stock Exchange) |
| Rebalancing | Semi-annual (January, July) |
| Signal | 12-month return, skip last month (12M-1M) |
| Selection | Top 30 by momentum, equal weight |
| Cash rule | Fewer than 10 qualifying stocks |
| Data source | FMP via Ceta Research warehouse |
| Benchmark | FTSE 100 (^FTSE) |
| Execution | Next-day close (MOC) |
| Period | 2000–2025 |
| Market cap filter | > £500M (~$625M USD, point-in-time, 45-day lag) |
0% of semi-annual periods went to cash. The LSE universe is consistently deep enough to find 30 qualifying momentum stocks.
What We Found
25-year summary (2000–2025):
| Metric | 12M Momentum | FTSE 100 (^FTSE) |
|---|---|---|
| CAGR | 8.67% | 1.08% |
| Total Return | 733.3% | 31.6% |
| Sharpe Ratio | 0.270 | -0.184 |
| Max Drawdown | -47.50% | -39.89% |
| Down Capture | 57.91% | 100% |
| Up Capture | 172.19% | 100% |
| Cash Periods | 0 of 51 (0%) |
The Sharpe of 0.270 comfortably exceeds the FTSE 100's -0.184. The FTSE posted a negative risk-adjusted return over this period, which puts the momentum premium in context. 57.91% down capture means that in bad markets, this portfolio falls about 42% less than the FTSE 100, keeping the drawdown profile manageable.
$1 invested in UK momentum in 2000 became $8.33 by 2025. The same dollar in the FTSE 100 became $1.32. The difference compounds from consistent outperformance, not from lottery-style wins.
Year-by-year standouts:
| Year | 12M Momentum | FTSE 100 | Notes |
|---|---|---|---|
| 2001 | +1.7% | -15.5% | Outperformed by 17.2 points |
| 2002 | -8.8% | -23.2% | Defensive year (+14.4 excess) |
| 2003 | +23.7% | +12.5% | Post-bear market surge |
| 2004 | +25.4% | +7.5% | UK outperformance (+17.9 excess) |
| 2008 | -42.8% | -28.9% | Worst year, global crisis |
| 2010 | +28.9% | +9.3% | Recovery outperformance |
| 2012 | +32.8% | +5.7% | European recovery |
| 2013 | +41.9% | +11.5% | Best absolute year (+30.4 excess) |
| 2020 | +19.1% | -13.6% | Biggest single-year gap (+32.7) |
| 2022 | -11.7% | +0.7% | FTSE gained, strategy fell |
2001-2004 is the defining period. The strategy outperformed the FTSE 100 for four consecutive years during the global tech bust. The FTSE fell -15.5% in 2001 and -23.2% in 2002. The momentum portfolio held up far better: +1.7% and -8.8% in those same years. The LSE was dominated by energy, mining, financial, and consumer staples names with real earnings that weren't caught in the dot-com bubble. In 2004, the strategy gained +25.4% vs the FTSE's +7.5%, an 18-point gap.
2001 stands out. While the FTSE 100 fell -15.5%, UK momentum gained +1.7%, an excess of +17.2 points. The divergence was driven by sector composition: UK momentum was concentrated in energy and basic materials during a commodity cycle upturn, while the broader index was dragged down by tech and telecom losses.
2008 shows the limit. The strategy fell -42.8% vs the FTSE 100's -28.9%. UK financials and mining stocks that had been the portfolio's core holdings hit hard in the global crisis. HSBC, Rio Tinto, and similar names were genuine momentum leaders entering 2008. They also led the crash. The global nature of the 2008 crisis meant UK momentum couldn't escape it.
2020 is the standout year. The portfolio gained +19.1% while the FTSE 100 fell -13.6%, a 33-point gap in a single year. UK momentum was positioned in sectors that benefited from the post-COVID recovery and commodity surge, while the FTSE's heavy financial and energy weighting dragged the index down.
2022 was a rare underperformance. The strategy fell -11.7% while the FTSE 100 actually gained +0.7%. The FTSE's energy and commodity exposure cushioned it during the rate shock, but the momentum portfolio was positioned in prior-year winners that didn't hold up. This is one of the few years where the benchmark outperformed the strategy outright.
Backtest Methodology
- Data: FMP financial data via Ceta Research warehouse. Price data from
stock_eod(adjusted closes). - Point-in-time: Market cap filter uses annual
key_metricsfilings with 45-day lag. No look-ahead bias. - Signal: Price at T-12M to T-1M. The 1-month skip avoids short-term reversal contamination.
- Data quality: Oscillation filter removes phantom holiday rows from adjClose. Stocks with adjusted close < $1 at either lookback date excluded. Momentum capped at 500% per stock.
- Equal weight: 30 positions, 3.33% each. No intraperiod rebalancing.
- Transaction costs: Modeled as size-tiered. LSE is a liquid market with stamp duty on purchases (modeled in costs).
- Benchmark: FTSE 100 (^FTSE) total return. Returns are in local currency (GBP) terms.
Why the UK Works
The UK market structure provides natural diversification from US equity risk in most (not all) market environments:
Sector composition. The FTSE universe is heavily weighted in energy, mining, financials, and consumer staples. These sectors have genuine earnings momentum tied to commodity cycles, interest rate movements, and UK consumer dynamics, not tech sentiment cycles. Momentum in these sectors is more durable.
Institutional landscape. UK equities attract a different institutional base (UK pension funds, European asset managers, some global long-only) with lower quant momentum penetration compared to US large-caps. The momentum premium is less arbitraged.
Low correlation to US tech. The biggest driver of US momentum in recent years is tech and growth stocks. The UK has limited exposure to these names. This creates periods where UK momentum and US momentum diverge significantly.
Limitations
2008 showed the global crisis exposure. When US and global financial stress is severe and synchronized, UK financials and miners fall alongside everything else. The portfolio still beat the FTSE in most years, but the 2008 hit (-42.8% vs FTSE's -28.9%) shows the down capture advantage narrows in synchronized global selling.
GBP/USD currency exposure. Returns include currency movements. Post-Brexit GBP weakness has been a headwind for USD-denominated investors in UK equities. The GBP has declined from ~1.50 in 2015 to ~1.25 in 2025, roughly 17% of total return lost to currency over 10 years.
Post-Brexit structural change. UK equity valuations have been structurally discounted since 2016 due to Brexit uncertainty and subsequent foreign institutional underweighting of the UK. This creates ongoing valuation compression that may limit forward returns.
MOC execution reduces returns. Next-day close (market-on-close) execution reduces CAGR by about 2.5 percentage points compared to same-day entry, reflecting realistic execution costs. The 8.67% CAGR is the honest number after accounting for execution lag.
Takeaway
12-month momentum on UK stocks works. The 8.67% CAGR vs 1.08% for the FTSE 100, with 57.91% down capture, is a compelling combination. The strategy delivered +7.59% annual excess return over 25 years while protecting capital better than the index in most downturns.
The UK's sector composition (energy, mining, financials, consumer staples) creates a natural anchor that separates LSE momentum from broad index performance. That separation has historically been valuable. The 2001-2004 and 2020 periods show it most clearly.
The main risk is global financial crisis correlation. When the entire global financial system is stressed, UK financials and commodities fall with everything else. The 2008 result is the clearest example: the strategy fell -42.8% while the FTSE lost -28.9%. The strategy isn't a recession hedge; it's a factor that captures UK-specific business cycle momentum.
Part of a Series
This is part of a multi-exchange 12-month momentum study:
- 12M Momentum: Global 18-Exchange Comparison, published April 14
- 12M Momentum: India 17.33% CAGR, published April 16
- 12M Momentum: Germany Best Sharpe in 18 Exchanges, published April 18
- 12M Momentum: US Matches SPY with Double the Drawdown, published April 23
Data: Ceta Research (FMP financial data warehouse), 2000–2025. Universe: LSE, market cap > £500M (point-in-time, 45-day lag). Full methodology: METHODOLOGY.md. Past performance does not guarantee future results. This is educational content, not investment advice.
References
- Jegadeesh, N. & Titman, S. (1993). Returns to Buying Winners and Selling Losers. Journal of Finance, 48(1), 65-91.
- Asness, C., Moskowitz, T. & Pedersen, L. (2013). Value and Momentum Everywhere. Journal of Finance.
- Daniel, K. & Moskowitz, T. (2016). Momentum Crashes. Journal of Financial Economics.
Run This Screen Yourself
The current 12-month momentum screen for UK stocks is live on Ceta Research:
cetaresearch.com/data-explorer?q=cJy1lB2j-I
-- 12-Month Momentum UK Screen
-- Live at: cetaresearch.com/data-explorer?q=cJy1lB2j-I
WITH universe AS (
    SELECT p.symbol, p.companyName, p.exchange, k.marketCap / 1e9 AS market_cap_billions
    FROM profile p JOIN key_metrics_ttm k ON p.symbol = k.symbol
    WHERE k.marketCap > 500000000 AND p.isActivelyTrading = true
      AND p.exchange IN ('LSE')
),
price_12m_ago AS (
    SELECT symbol, adjClose AS price_12m,
           ROW_NUMBER() OVER (PARTITION BY symbol ORDER BY ABS(CAST(dateEpoch AS BIGINT) -
               CAST(EXTRACT(EPOCH FROM (CURRENT_DATE - INTERVAL '365' DAY))::BIGINT AS BIGINT))) AS rn
    FROM stock_eod
    WHERE CAST(date AS DATE) BETWEEN CURRENT_DATE - INTERVAL '395' DAY
                                 AND CURRENT_DATE - INTERVAL '335' DAY
      AND adjClose > 0
),
price_1m_ago AS (
    SELECT symbol, adjClose AS price_1m,
           ROW_NUMBER() OVER (PARTITION BY symbol ORDER BY ABS(CAST(dateEpoch AS BIGINT) -
               CAST(EXTRACT(EPOCH FROM (CURRENT_DATE - INTERVAL '30' DAY))::BIGINT AS BIGINT))) AS rn
    FROM stock_eod
    WHERE CAST(date AS DATE) BETWEEN CURRENT_DATE - INTERVAL '45' DAY
                                 AND CURRENT_DATE - INTERVAL '15' DAY
      AND adjClose > 0
)
SELECT u.symbol, u.companyName, u.exchange,
    ROUND(u.market_cap_billions, 2) AS market_cap_billions,
    ROUND((p1m.price_1m - p12.price_12m) / p12.price_12m * 100, 1) AS return_12m_1m_pct
FROM universe u
JOIN price_12m_ago p12 ON u.symbol = p12.symbol AND p12.rn = 1
JOIN price_1m_ago p1m ON u.symbol = p1m.symbol AND p1m.rn = 1
WHERE p12.price_12m > 1.0 AND p1m.price_1m > 1.0
  AND (p1m.price_1m - p12.price_12m) / p12.price_12m <= 5.0
ORDER BY return_12m_1m_pct DESC NULLS LAST
LIMIT 30;


