
12-Month Momentum on German Stocks: Best Sharpe in an 18-Exchange Study
Pure 12-month price momentum on XETRA stocks from 2000 to 2025 delivered 12.51% CAGR with a Sharpe of 0.588, the highest risk-adjusted return in an 18-exchange global study. The strategy outperformed the DAX by 7.45% annually with a max drawdown of -39.69% vs the DAX's own -55.38%.

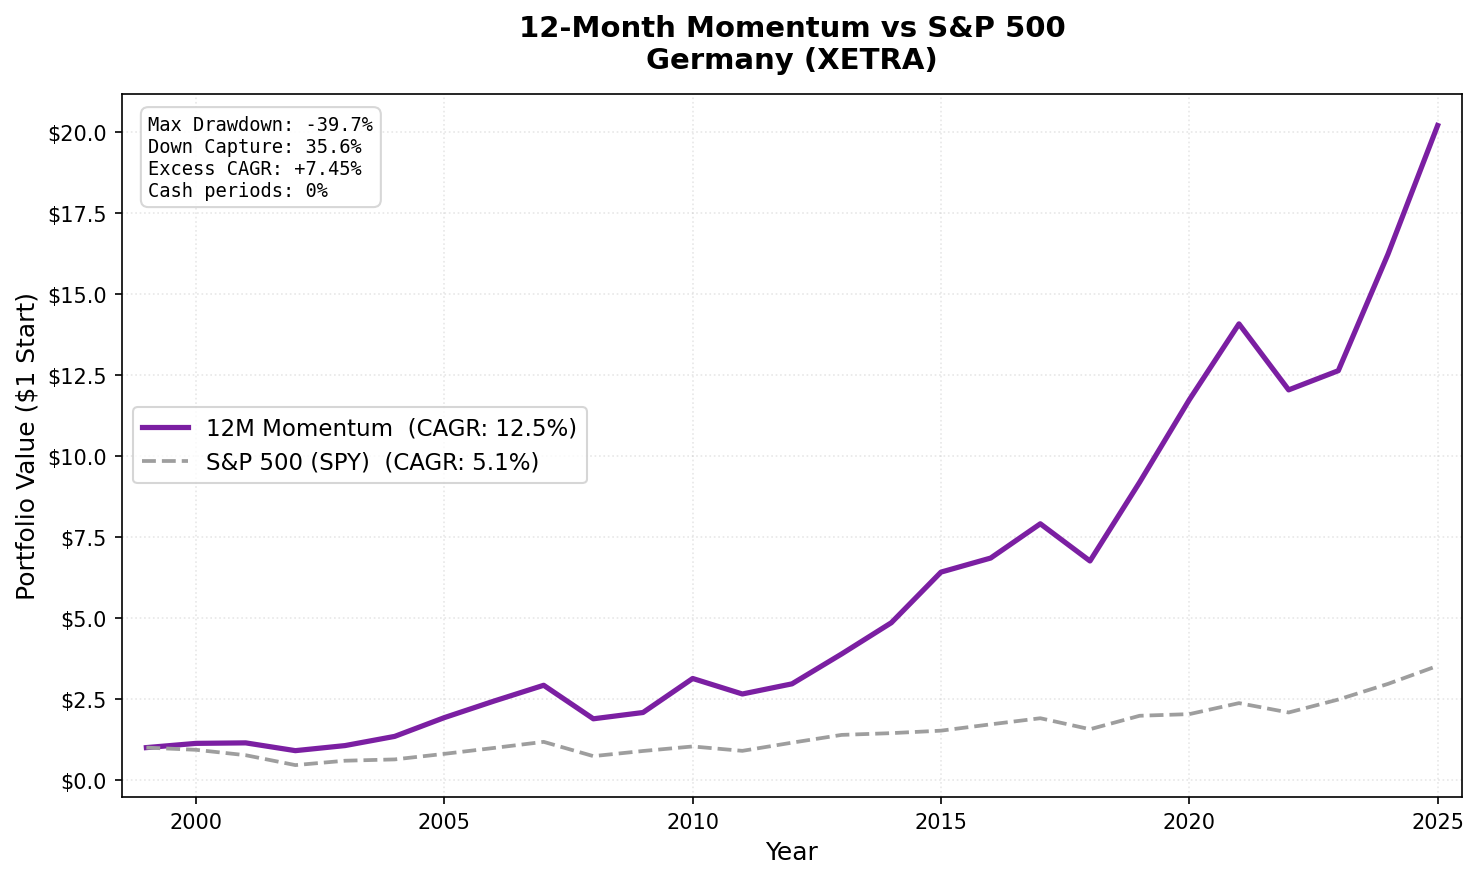
German equities don't make many headlines in factor investing literature. Most momentum research focuses on the US, Japan, or global markets. The XETRA data tells a different story. Pure 12-month momentum on German stocks from 2000 to 2025 delivered 12.51% annually with a Sharpe ratio of 0.588, the highest in an 18-exchange study covering Europe, Asia, North America, and emerging markets. It outperformed the DAX by 7.45% per year with a max drawdown of -39.69%, well below the DAX's own -55.38%.
Contents
- Method
- What We Found
- Backtest Methodology
- Why Germany?
- Limitations
- Takeaway
- Part of a Series
- References
- Run This Screen Yourself
Data: FMP financial data warehouse, 2000–2025. Updated May 2026.
Method
| Parameter | Value |
|---|---|
| Universe | XETRA (Germany) |
| Rebalancing | Semi-annual (January, July) |
| Signal | 12-month return, skip last month (12M-1M) |
| Selection | Top 30 by momentum, equal weight |
| Cash rule | Fewer than 10 qualifying stocks |
| Data source | FMP via Ceta Research warehouse |
| Benchmark | DAX (^GDAXI) |
| Execution | Next-day close (MOC) |
| Period | 2000–2025 |
| Market cap filter | > €500M (~$550M USD, point-in-time, 45-day lag) |
0% of semi-annual periods went to cash. Germany's market cap coverage is deep enough to consistently produce 30+ qualifying stocks.
What We Found
25-year summary (2000–2025):
| Metric | 12M Momentum | DAX (^GDAXI) |
|---|---|---|
| CAGR | 12.51% | 5.06% |
| Total Return | 1,919.8% | 252.4% |
| Sharpe Ratio | 0.588 | 0.164 |
| Sortino Ratio | 1.070 | n/a |
| Max Drawdown | -39.69% | -55.38% |
| Down Capture | 35.65% | 100% |
| Up Capture | 113.01% | 100% |
| Cash Periods | 0 of 51 (0%) |
The Sharpe of 0.588 puts Germany ahead of every other exchange tested. The DAX's Sharpe over the same period was 0.164. The combination of 12.51% CAGR with a max drawdown of -39.69% is the best risk-adjusted profile in the study. The strategy's worst drawdown was about 16 points smaller than the DAX's own -55.38%.
The down capture of 35.65% means the portfolio fell 64% less than the DAX during downturns on average. The up capture of 113.01% means it captured 13% more of the upside. That asymmetry (more upside with far less downside) is the ideal risk/return profile.
Year-by-year standouts:
| Year | 12M Momentum | DAX | Notes |
|---|---|---|---|
| 2000 | +13.1% | -6.8% | Crisis protection |
| 2005 | +43.0% | +27.0% | European growth surge |
| 2008 | -35.4% | -37.4% | Crisis, held up vs index |
| 2009 | +10.3% | +21.6% | Lagged DAX recovery |
| 2010 | +50.4% | +15.6% | Post-crisis German industrial boom |
| 2013 | +31.1% | +20.8% | European recovery trade |
| 2015 | +32.2% | +5.3% | Germany outperformance year |
| 2019 | +36.0% | +26.5% | Pre-COVID momentum |
| 2022 | -14.5% | -12.2% | Slight underperformance |
| 2024 | +28.5% | +19.4% | German industrials recovery |
2000 stands out. While the Nasdaq crashed and the DAX fell -6.8%, Germany momentum returned +13.1%. The portfolio was long German industrial and chemical names that had real earnings momentum and weren't caught in the dot-com bubble. Germany's lack of a large tech sector in 2000 was an advantage. Momentum led into the sectors that held up.
2010 acceleration. After lagging the DAX recovery in 2009 (+10.3% vs +21.6%), Germany caught up aggressively in 2010 with +50.4% vs +15.6% for the DAX. German industrial exports surged post-crisis as Asian demand recovered first. Momentum captured the sector rotation into XETRA industrial and materials names that led the cycle.
2022 note. The strategy fell -14.5% vs the DAX's -12.2% in 2022. A small underperformance in a year where rate shocks hit momentum names broadly. Energy and materials stocks with genuine earnings momentum partially offset the drag, but not enough to beat the index in this particular year.
The 2008 note. Germany held up better than the DAX in the global financial crisis (-35.4% vs -37.4%). The portfolio was long cyclical exporters (auto, industrial, chemicals) that got hit in the synchronized global downturn, but the momentum signal had rotated enough toward defensive names to outperform marginally. Even so, the German economy's export dependence means global crisis hits XETRA momentum directly.
Backtest Methodology
- Data: FMP financial data via Ceta Research warehouse. Price data from
stock_eod(adjusted closes). - Point-in-time: Market cap filter uses annual
key_metricsfilings with 45-day lag. No look-ahead bias. - Signal: Price at T-12M to T-1M. The 1-month skip avoids short-term reversal contamination.
- Data quality: Oscillation filter removes phantom holiday rows from adjClose. Stocks with adjusted close < $1 at either lookback date excluded. Momentum capped at 500% per stock.
- Equal weight: 30 positions, 3.33% each. No intraperiod rebalancing.
- Transaction costs: Modeled as size-tiered. XETRA is a liquid exchange with costs similar to NYSE.
- Benchmark: DAX (^GDAXI) total return.
Why Germany?
Several structural factors likely contribute to the stronger momentum profile on XETRA:
Sector composition. Germany's index is dominated by industrials, chemicals, automotive, and financial names: sectors with genuine multi-year business cycles. Momentum in these sectors tends to be driven by real orders, exports, and capex cycles that persist for 6-12 months. This is different from the US, where tech momentum is more sentiment-driven and reversal-prone.
Less systematic momentum trading. US momentum is heavily traded by quantitative funds. XETRA has lower institutional quant penetration. The arbitrage of the momentum premium has proceeded more slowly in European mid-cap equities.
Mid-cap depth. XETRA has significant mid-cap depth below the DAX. These names have real earnings momentum but less analyst coverage and less institutional trading. The momentum premium in less-covered stocks is often larger and more persistent.
Limitations
Global crisis correlation. The 2008 result shows Germany momentum is not a crisis hedge. In globally synchronized downturns, the strategy tracks close to the DAX. The down capture advantage narrows when every sector sells off together.
Currency exposure. Returns are in USD terms. EUR/USD movements affect the reported CAGR. Strong euro periods benefit USD-denominated investors; weak euro periods hurt. The strategy has embedded EUR exposure.
German economy concentration. XETRA momentum is concentrated in Germany's industrial export economy. A structural shift in global manufacturing (China decoupling, reshoring) could change the sector composition that has historically driven momentum.
Takeaway
Germany has the best Sharpe ratio of the 18 exchanges tested, 0.588 vs 0.164 for the DAX. The combination of 7.45% annual excess return, 35.65% down capture, and -39.69% max drawdown is the cleanest risk-adjusted profile in this study.
The European momentum factor is often overlooked in favor of US and India results. The data suggest it deserves more attention. Germany's sector composition, mid-cap depth, and lower quant penetration create conditions where the 12-1M momentum signal translates into durable alpha.
Part of a Series
This is part of a multi-exchange 12-month momentum study:
- 12M Momentum: Global 18-Exchange Comparison, published April 14
- 12M Momentum: India 17.33% CAGR, published April 16
- 12M Momentum: UK Consistent Alpha, Low Down Capture, published April 20
- 12M Momentum: US Matches SPY with Double the Drawdown, published April 23
Data: Ceta Research (FMP financial data warehouse), 2000–2025. Universe: XETRA, market cap > €500M (point-in-time, 45-day lag). Full methodology: METHODOLOGY.md. Past performance does not guarantee future results. This is educational content, not investment advice.
References
- Jegadeesh, N. & Titman, S. (1993). Returns to Buying Winners and Selling Losers. Journal of Finance, 48(1), 65-91.
- Asness, C., Moskowitz, T. & Pedersen, L. (2013). Value and Momentum Everywhere. Journal of Finance.
- Daniel, K. & Moskowitz, T. (2016). Momentum Crashes. Journal of Financial Economics.
Run This Screen Yourself
The current 12-month momentum screen for German stocks is live on Ceta Research:
cetaresearch.com/data-explorer?q=GVijukmSA5
-- 12-Month Momentum Germany Screen
-- Live at: cetaresearch.com/data-explorer?q=GVijukmSA5
WITH universe AS (
    SELECT p.symbol, p.companyName, p.exchange, k.marketCap / 1e9 AS market_cap_billions
    FROM profile p JOIN key_metrics_ttm k ON p.symbol = k.symbol
    WHERE k.marketCap > 500000000 AND p.isActivelyTrading = true
      AND p.exchange IN ('XETRA')
),
price_12m_ago AS (
    SELECT symbol, adjClose AS price_12m,
           ROW_NUMBER() OVER (PARTITION BY symbol ORDER BY ABS(CAST(dateEpoch AS BIGINT) -
               CAST(EXTRACT(EPOCH FROM (CURRENT_DATE - INTERVAL '365' DAY))::BIGINT AS BIGINT))) AS rn
    FROM stock_eod
    WHERE CAST(date AS DATE) BETWEEN CURRENT_DATE - INTERVAL '395' DAY
                                 AND CURRENT_DATE - INTERVAL '335' DAY
      AND adjClose > 0
),
price_1m_ago AS (
    SELECT symbol, adjClose AS price_1m,
           ROW_NUMBER() OVER (PARTITION BY symbol ORDER BY ABS(CAST(dateEpoch AS BIGINT) -
               CAST(EXTRACT(EPOCH FROM (CURRENT_DATE - INTERVAL '30' DAY))::BIGINT AS BIGINT))) AS rn
    FROM stock_eod
    WHERE CAST(date AS DATE) BETWEEN CURRENT_DATE - INTERVAL '45' DAY
                                 AND CURRENT_DATE - INTERVAL '15' DAY
      AND adjClose > 0
)
SELECT u.symbol, u.companyName, u.exchange,
    ROUND(u.market_cap_billions, 2) AS market_cap_billions,
    ROUND((p1m.price_1m - p12.price_12m) / p12.price_12m * 100, 1) AS return_12m_1m_pct
FROM universe u
JOIN price_12m_ago p12 ON u.symbol = p12.symbol AND p12.rn = 1
JOIN price_1m_ago p1m ON u.symbol = p1m.symbol AND p1m.rn = 1
WHERE p12.price_12m > 1.0 AND p1m.price_1m > 1.0
  AND (p1m.price_1m - p12.price_12m) / p12.price_12m <= 5.0
ORDER BY return_12m_1m_pct DESC NULLS LAST
LIMIT 30;


