
Margin Expansion on Indian Stocks: The Signal Runs in Reverse
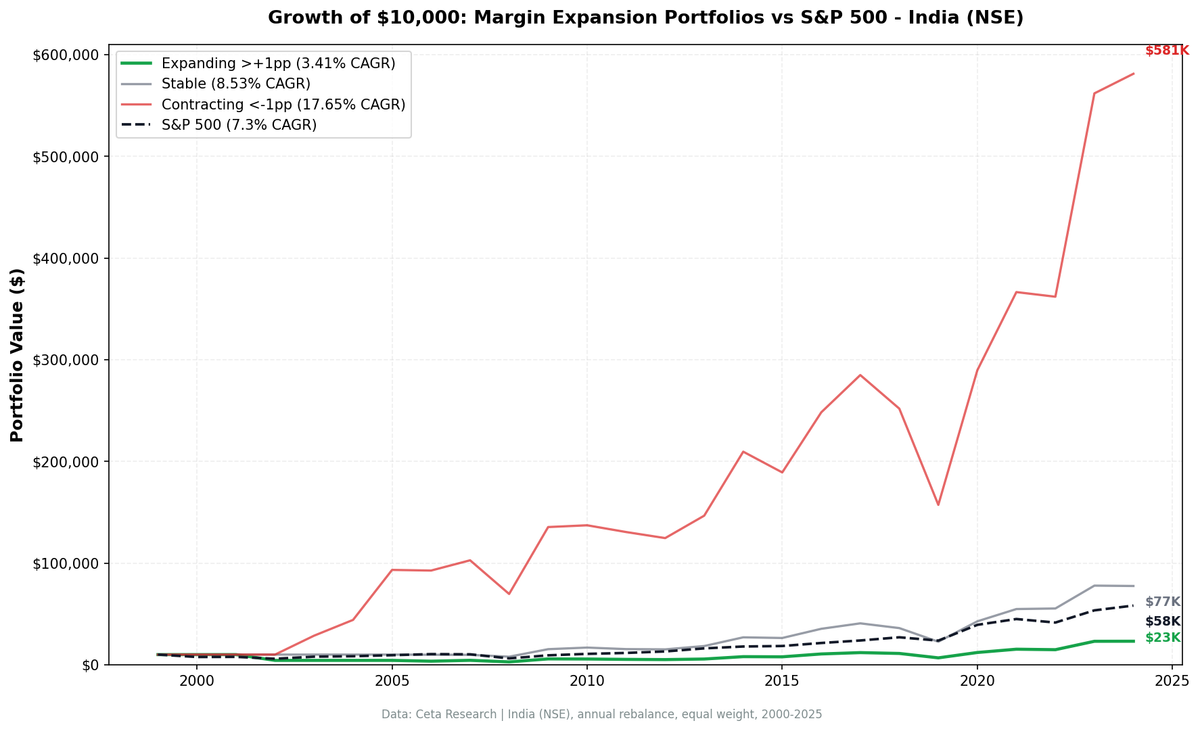
We tested margin expansion on BSE and NSE from 2000 to 2025. Contracting margins returned 17.65% CAGR vs 3.41% for expanding. The quality signal runs backward in India. Cyclical sectors and growth dynamics flip the expected relationship.

This is part of a series testing margin expansion as a stock-picking signal across global markets. In the US, we found that stable margins beat expanding ones. India tells a different story entirely.
Contents
- Method
- What We Found
- Headline Numbers (2000-2025)
- Decade Breakdown
- Why the Reverse Signal?
- Stable Margins: The Quiet Winner
- What This Means for Quality Frameworks
- Limitations
- The Takeaway
Companies with contracting margins returned 16.31% CAGR on NSE from 2000 to 2025. Companies with expanding margins returned 3.46%. The signal runs backward. Buying "improving" businesses and avoiding "deteriorating" ones would have cost you 12.85% per year in relative performance.
This isn't a rounding error. It's a structural feature of the Indian market that has implications for how Western quality frameworks translate to emerging economies.
Data: FMP financial data warehouse, 2000–2025. Updated March 2026.
Method
| Parameter | Value |
|---|---|
| Universe | NSE listed stocks |
| Market cap floor | >20B INR (~$240M USD) |
| Signal | Operating Profit Margin expansion = Current FY OPM minus avg(prior 3 FY OPMs) |
| OPM formula | Operating Income / Revenue (annual income statements) |
| Data requirement | 4+ fiscal years of data per company |
| Categories | Expanding: >+1pp, Stable: -1pp to +1pp, Contracting: <-1pp |
| Rebalancing | Annual (April 1), 45-day filing lag |
| Weighting | Equal weight, all qualifying stocks in each bucket |
| Costs | 0.1-0.5% per trade (size-tiered) |
| Exclusion | Financial Services sector |
| Benchmark | Sensex (^BSESN) |
| Period | 2000-2025 |
Same methodology as the US backtest. The universe covers NSE (BSE excluded due to ~38% dual-listing duplication that would double-count the same companies). Benchmark is the Sensex, the primary Indian large-cap index.
What We Found
Headline Numbers (2000-2025)
| Bucket | CAGR | Volatility | Sharpe | Max Drawdown | Avg Stocks |
|---|---|---|---|---|---|
| Contracting | 16.31% | 49.04% | 0.200 | -46.9% | 79 |
| Stable | 9.06% | 30.35% | 0.084 | -41.8% | 39 |
| Expanding | 3.46% | 35.51% | -0.085 | -70.6% | 100 |
| Sensex | 11.49% | 32.73% | 0.152 | -38.3% | — |
The contracting bucket crushed everything. 16.31% CAGR with a Sharpe of 0.200. Expanding margins returned 3.46% with a negative Sharpe (-0.085) and a -70.6% max drawdown. Stable margins sit in the middle at 9.06%.
The expanding-contracting spread is -12.85% per year. Negative. The opposite of what quality investing theory predicts. Against the Sensex (11.49% CAGR), expanding margins trail by -8.03% per year.
The universe covers NSE stocks above 20B INR market cap. Data coverage was thin before 2006, with meaningful sample sizes only from 2006 onward.
Decade Breakdown
| Period | Expanding | Contracting | Spread | Sensex |
|---|---|---|---|---|
| 2000-04 | -11.2% | 45.6% | -56.7% | 11.5% |
| 2005-09 | 15.2% | 35.4% | -20.2% | 29.7% |
| 2010-14 | 8.7% | 10.2% | -1.5% | 10.5% |
| 2015-19 | -1.2% | -5.3% | +4.1% | 1.2% |
| 2020-25 | 32.6% | 33.5% | -0.9% | 25.5% |
Two things jump out.
The early data is extreme. 2000-04 shows a -56.7% spread. Contracting margins returned 45.6% while expanding margins lost -11.2%. Coverage on NSE was thin before 2006. The contracting bucket captured commodity and industrial companies riding India's post-liberalization boom where revenues outran costs temporarily, compressing margins but generating enormous stock returns.
The spread narrows over time. From -56.7% in 2000-04 to -0.9% in 2020-25. As India's market matures, the signal weakens. 2015-19 is the only period where expanding margins actually beat contracting (+4.1%), though both buckets were near zero.
Why the Reverse Signal?
Three factors explain why margin contraction predicts positive returns in India.
Cyclical dominance. India's listed universe is heavy in materials, chemicals, steel, mining, and industrials. These companies have volatile margins driven by commodity prices. When raw material costs spike, margins contract. But these same companies benefit from India's GDP growth, infrastructure spending, and export demand. The stock market prices the growth, not the margin compression.
Growth economy dynamics. In a rapidly growing economy, companies often sacrifice margins to grab market share. Revenue growth of 30-40% with flat operating income looks like margin contraction. But the market rewards the revenue trajectory, not the margin math. A steel company growing revenue at 35% with flat margins will show up in the contracting bucket, but its stock can double.
Survivorship in the contracting bucket. Companies with contracting margins that survive and stay listed tend to be the cyclical winners. They had margin pressure from growth investments or commodity cycles, not from business deterioration. The ones that contracted margins because their business was dying would have delisted, removing the worst outcomes from the dataset.
Stable Margins: The Quiet Winner
Stable margins returned 9.06% CAGR. Not as flashy as contracting (16.31%), but with lower volatility (30.35% vs 49.04%) and a shallower max drawdown (-41.8% vs -46.9%).
In the US, stable margins were the clear winner. In India, they're the safe middle ground. The 39 stocks in the stable bucket tend to be consumer staples, IT services, and pharma companies. Predictable businesses that grow steadily. They won't capture India's cyclical booms, but they also won't hit -70.6% drawdowns like the expanding bucket did.
What This Means for Quality Frameworks
Western quality investing frameworks don't translate directly to India. The standard playbook (buy expanding margins, avoid contracting) would have been the single worst strategy you could run on Indian equities.
This doesn't mean quality is irrelevant. It means the definition needs adjusting. In India, "quality" might be better captured by:
- Revenue growth persistence (not margin expansion)
- Return on capital employed (not margin direction)
- Cash conversion (operating cash flow vs reported earnings)
- Sector-adjusted margins (a steel company at 8% OPM might be excellent, a software company at 8% might be struggling)
Stable margins still work as a filter. They identify the subset of Indian companies that behave more like developed-market quality stocks. But applying the expanding-margins screen that works in the US would be actively destructive in India.
Limitations
Early period data quality. The 2000-04 results are driven by a small number of companies with FMP coverage on NSE. The 45.6% CAGR for contracting margins in that period may not be reproducible. From 2010 onward, the data is denser and the results are more moderate.
Currency effects. All returns are in local currency terms (INR). INR depreciation over 25 years means dollar-denominated returns would be lower across all buckets. The relative ranking (contracting > stable > expanding) holds regardless of currency.
Market cap floor. The 20B INR (~$240M) floor excludes small and micro-cap stocks. India's small-cap universe is large and volatile. Including it would likely amplify the contracting bucket's returns further, since small cyclicals have the most extreme margin swings.
Survivorship bias. Same caveat as the US backtest. NSE has listed companies that trade infrequently or are effectively shells. Our market cap floor mitigates this, but doesn't eliminate it.
Universe size. The NSE-only universe averages 100 expanding stocks per year and 79 contracting. These are smaller pools than the full BSE+NSE universe and may carry more concentration risk in certain years.
Sector concentration. The contracting bucket's returns are driven disproportionately by materials and industrials. A sector-neutral version of this test would likely show a weaker reverse signal.
The Takeaway
Margin expansion is not a universal quality signal. In the US, stable margins are the winning bucket. In India, contracting margins dominate. The signal reflects the structure of each market: the US rewards predictability, India rewards cyclical growth.
If you're screening Indian stocks, don't penalize margin contraction without understanding why it's happening. A steel company whose margins compressed from 18% to 12% because iron ore prices spiked might be one of the best stocks in the market next year.
Data: Ceta Research / FMP warehouse. Annual income statements (operatingIncome, revenue) for NSE listed stocks, 2000-2025. Market cap >20B INR. Financial Services excluded. Equal-weight portfolios, annual April 1 rebalance, 45-day filing lag, 0.1-0.5% transaction costs. Benchmark: Sensex (^BSESN). Past performance does not guarantee future results. This is research content, not investment advice.
Academic basis: Novy-Marx (2013) "The Other Side of Value" (JFE), Haugen & Baker (1996) "Commonality in Determinants of Expected Stock Returns" (JFE), Asness et al. (2019) "Quality Minus Junk" (Review of Accounting Studies).


