Margin Expansion Backtest: Stable Margins Beat Expanding Ones on US Stocks
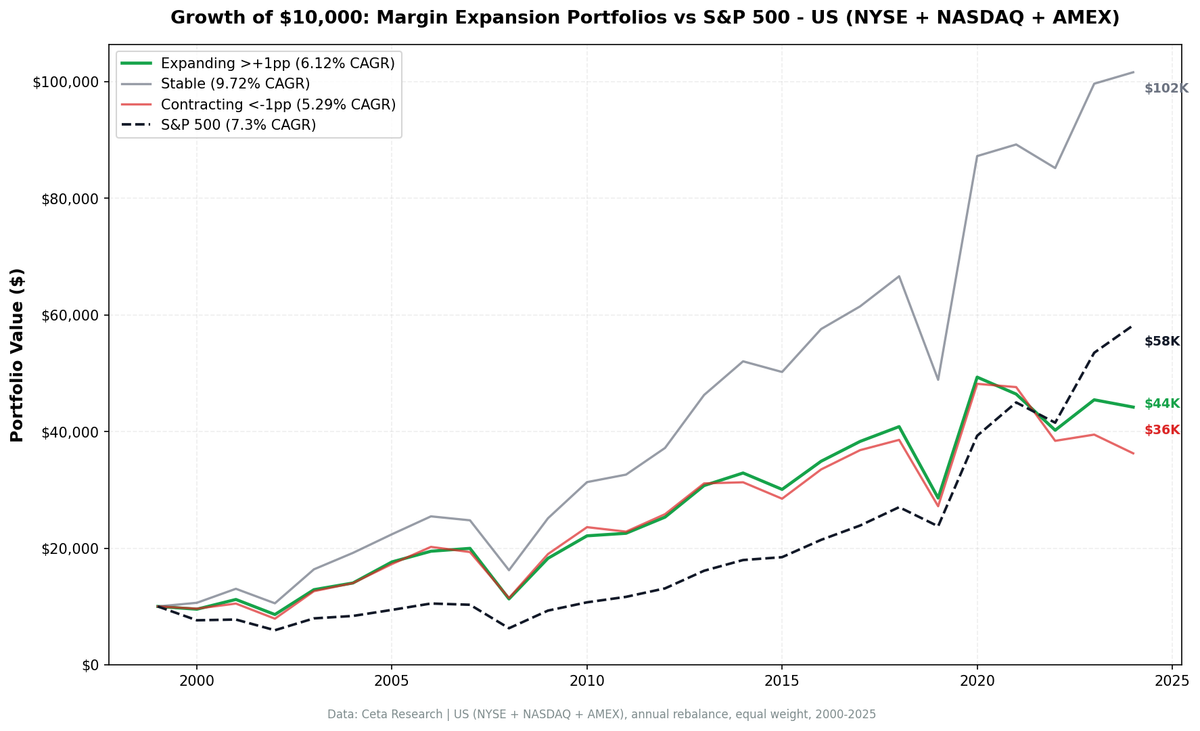
We tested margin expansion as a stock signal across all US exchanges from 2000 to 2025. The surprise: stable margins (9.72% CAGR) beat expanding (6.12%) and contracting (5.29%). $10,000 in stable-margin stocks grew to $101,587 vs $44,188 for expanding margins.

The conventional wisdom is simple: buy companies whose margins are expanding. Growing profits on the same revenue means management is getting better at their job. Wall Street rewards margin expansion stories with premium multiples.
Contents
- Method
- What Research Shows
- The Screen
- Simple Screen: Find Margin-Expanding Stocks
- Advanced Screen: Classify All Three Buckets
- Backtest Results
- Headline Numbers (2000-2025)
- Growth of $10,000
- Decade Breakdown
- When It Works and When It Struggles
- Run It Yourself
- Limitations
We tested this across every US-listed stock from 2000 to 2025. The result wasn't what we expected. Companies with stable operating margins returned 9.76% annually. Companies with expanding margins returned 7.12%. The boring, predictable operators beat the ones investors get excited about.
$10,000 in the stable-margin bucket grew to $102,640. The same $10,000 in expanding margins grew to $55,869. The S&P 500 returned $58,591.
Data: FMP financial data warehouse, 2000–2025. Updated March 2026.
Method
| Parameter | Value |
|---|---|
| Universe | All US-listed stocks (NYSE, NASDAQ, AMEX) |
| Signal | Operating Profit Margin expansion = Current FY OPM minus avg(prior 3 FY OPMs) |
| OPM formula | Operating Income / Revenue (annual income statements) |
| Data requirement | 4+ fiscal years of data per company |
| Categories | Expanding: >+1pp, Stable: -1pp to +1pp, Contracting: <-1pp |
| Rebalancing | Annual (April 1), 45-day filing lag |
| Weighting | Equal weight, all qualifying stocks in each bucket |
| Costs | 0.1-0.5% per trade (size-tiered) |
| Exclusion | Financial Services sector |
| Benchmark | S&P 500 (SPY) |
| Period | 2000-2025 |
The 1 percentage point threshold keeps the categories clean. A company whose OPM went from 12% to 12.5% isn't meaningfully "expanding." The 45-day filing lag ensures we only use data that was publicly available at rebalance time.
What Research Shows
Margin quality as a factor has solid academic backing.
Novy-Marx (2013) showed in "The Other Side of Value" that gross profitability predicts cross-sectional returns as well as book-to-market. Profitable firms outperform unprofitable ones. But he measured level, not change. A company with steady 30% margins would score well in his framework regardless of trend.
Haugen and Baker (1996) found that profitability metrics, including margins, showed up as persistent determinants of expected stock returns across multiple countries. Again, the emphasis was on the level of profitability.
Asness, Frazzini, and Pedersen (2019) formalized "Quality Minus Junk" as a factor. Their quality composite included profitability, growth, safety, and payout. Margin stability contributes to the safety component. Companies with predictable margins are less likely to surprise investors with earnings misses.
The common thread: the academic literature rewards the level and consistency of margins more than the direction of change. Our results line up with this.
The Screen
Simple Screen: Find Margin-Expanding Stocks
-- Margin Expansion Screen (Simple)
-- Run at: cetaresearch.com/data-explorer

WITH margins AS (
  SELECT
    symbol,
    fiscalYear,
    CASE WHEN revenue > 0
      THEN operatingIncome * 1.0 / revenue
      ELSE NULL
    END AS opm
  FROM income_statement
  WHERE period = 'FY'
    AND revenue > 0
),
current_and_avg AS (
  SELECT
    m.symbol,
    m.fiscalYear,
    m.opm AS current_opm,
    AVG(m2.opm) AS avg_prior_3yr_opm
  FROM margins m
  JOIN margins m2
    ON m.symbol = m2.symbol
    AND m2.fiscalYear BETWEEN m.fiscalYear - 3 AND m.fiscalYear - 1
  GROUP BY m.symbol, m.fiscalYear, m.opm
  HAVING COUNT(m2.opm) >= 3
)
SELECT
  ca.symbol,
  p.companyName,
  p.sector,
  ROUND(ca.current_opm * 100, 1) AS current_opm_pct,
  ROUND(ca.avg_prior_3yr_opm * 100, 1) AS avg_3yr_opm_pct,
  ROUND((ca.current_opm - ca.avg_prior_3yr_opm) * 100, 1) AS expansion_pp,
  ROUND(k.marketCap / 1e9, 1) AS mktcap_bn
FROM current_and_avg ca
JOIN profile p ON ca.symbol = p.symbol
JOIN key_metrics k ON ca.symbol = k.symbol AND k.period = 'FY'
WHERE ca.fiscalYear = YEAR(CURRENT_DATE) - 1
  AND p.exchange IN ('NYSE', 'NASDAQ', 'AMEX')
  AND p.sector != 'Financial Services'
  AND (ca.current_opm - ca.avg_prior_3yr_opm) > 0.01
QUALIFY ROW_NUMBER() OVER (PARTITION BY ca.symbol ORDER BY k.date DESC) = 1
ORDER BY expansion_pp DESC
LIMIT 50
Advanced Screen: Classify All Three Buckets
-- Margin Expansion Classification (Expanding / Stable / Contracting)
-- Run at: cetaresearch.com/data-explorer

WITH margins AS (
  SELECT
    symbol,
    fiscalYear,
    CASE WHEN revenue > 0
      THEN operatingIncome * 1.0 / revenue
      ELSE NULL
    END AS opm
  FROM income_statement
  WHERE period = 'FY'
    AND revenue > 0
),
classified AS (
  SELECT
    m.symbol,
    m.fiscalYear,
    m.opm AS current_opm,
    AVG(m2.opm) AS avg_prior_3yr_opm,
    (m.opm - AVG(m2.opm)) AS expansion,
    CASE
      WHEN (m.opm - AVG(m2.opm)) > 0.01 THEN 'Expanding'
      WHEN (m.opm - AVG(m2.opm)) < -0.01 THEN 'Contracting'
      ELSE 'Stable'
    END AS margin_category
  FROM margins m
  JOIN margins m2
    ON m.symbol = m2.symbol
    AND m2.fiscalYear BETWEEN m.fiscalYear - 3 AND m.fiscalYear - 1
  GROUP BY m.symbol, m.fiscalYear, m.opm
  HAVING COUNT(m2.opm) >= 3
)
SELECT
  c.symbol,
  p.companyName,
  p.sector,
  c.margin_category,
  ROUND(c.current_opm * 100, 1) AS current_opm_pct,
  ROUND(c.avg_prior_3yr_opm * 100, 1) AS avg_3yr_opm_pct,
  ROUND(c.expansion * 100, 1) AS expansion_pp,
  ROUND(k.marketCap / 1e9, 1) AS mktcap_bn
FROM classified c
JOIN profile p ON c.symbol = p.symbol
JOIN key_metrics k ON c.symbol = k.symbol AND k.period = 'FY'
WHERE c.fiscalYear = YEAR(CURRENT_DATE) - 1
  AND p.exchange IN ('NYSE', 'NASDAQ', 'AMEX')
  AND p.sector != 'Financial Services'
QUALIFY ROW_NUMBER() OVER (PARTITION BY c.symbol ORDER BY k.date DESC) = 1
ORDER BY c.margin_category, expansion_pp DESC
LIMIT 100
Backtest Results
Headline Numbers (2000-2025)
| Bucket | CAGR | Volatility | Sharpe | Max Drawdown | Neg Years | Avg Stocks |
|---|---|---|---|---|---|---|
| Stable | 9.76% | 23.66% | 0.328 | -32.8% | 24% | 265 |
| Expanding | 7.12% | 24.55% | 0.209 | -40.1% | 28% | 551 |
| Contracting | 5.76% | 26.46% | 0.142 | -40.4% | 40% | 408 |
| S&P 500 | 7.33% | 21.07% | 0.253 | -39.3% | — | — |
Stable margins delivered the highest CAGR (9.76%), the lowest volatility (23.66%), the best Sharpe ratio (0.328), and the shallowest drawdown (-32.8%). Every risk metric favors the stable bucket. Only 24% of years were negative, compared to 28% for expanding and 40% for contracting.
The expanding-contracting spread is +1.36% per year. Expanding margins beat contracting ones. The challenge is that expanding margins trail the S&P 500 by just -0.21% annually, with a beta of 1.06 and an alpha of -0.52%. Barely below the index with slightly more market risk.
Consecutive expansion (companies expanding margins for 2+ years in a row) returned 7.40% CAGR. Slightly better than single-year expansion and roughly matches the S&P 500.
Growth of $10,000
| Bucket | Terminal Value |
|---|---|
| Stable | $102,640 |
| S&P 500 | $58,591 |
| Expanding | $55,869 |
| Contracting | $40,542 |
The stable bucket turned $10,000 into $102,640. The S&P 500 turned it into $58,591. Expanding margins turned it into $55,869, nearly matching SPY. Contracting turned it into $40,542. That's a 1.8x gap between stable and expanding over 25 years.
Decade Breakdown
| Period | Expanding | Contracting | Spread | S&P 500 |
|---|---|---|---|---|
| 2000-04 | 9.6% | 10.4% | -0.8% | -1.4% |
| 2005-09 | 11.5% | 11.9% | -0.4% | 5.9% |
| 2010-14 | 13.8% | 11.2% | +2.7% | 14.1% |
| 2015-19 | -0.3% | -0.6% | +0.3% | 6.6% |
| 2020-25 | 14.0% | 10.7% | +3.4% | 21.5% |
The expanding-contracting spread was negative in the 2000s, near-zero in the late 2010s, and positive from 2010-14 onward. The signal works best coming out of recessions (2010-14, 2020-25) when genuine margin recovery separates real improvers from cyclical bounces.
Both buckets trailed the S&P 500 in most periods except 2000-04, when the dot-com bust dragged the index negative.
When It Works and When It Struggles
Works best after recessions. The 2010-14 period shows a +1.7% spread, and 2020-25 shows +2.4%. After a downturn, margin expansion reflects real operational improvements rather than cyclical tailwinds. The contracting bucket fills with companies whose business models broke during the recession.
Struggles in late-cycle expansions. 2015-19 had a 0.0% spread. In a mature expansion, margin changes become noise. Companies expand margins through financial engineering (buybacks, cost cutting) rather than revenue growth, which doesn't predict returns.
Stable wins in all environments. The stable bucket's edge isn't cyclical. Companies with predictable margins tend to be pricing leaders, operate in sticky markets, or have structural cost advantages. These characteristics compound regardless of where we are in the cycle.
Run It Yourself
Both SQL queries above run directly on Ceta Research. The simple screen finds today's margin expanders. The advanced screen classifies the full US universe into expanding, stable, and contracting buckets.
To replicate the backtest, you'd run the classification annually at each April 1 rebalance date, then track equal-weight returns for each bucket over the following year. The 45-day filing lag means April 1 rebalance uses fiscal years ending before mid-February.
Limitations
Survivorship bias. Companies that delist mid-year exit the portfolio at their last traded price, but we can't capture the full loss for companies that go to zero between price observations. This affects the contracting bucket most, since struggling companies are more likely to delist.
Equal weight is generous. Equal-weighting 500+ stocks per bucket isn't realistic for an individual investor. The expanding bucket averages 563 stocks. A concentrated version (top 30 by expansion magnitude) might behave differently.
Sector composition shifts. The expanding bucket's composition changes year to year. In 2020-21, it was heavy in tech. In 2022-23, energy dominated. The returns reflect sector rotation as much as margin quality.
Filing lag assumptions. We use a 45-day lag, which is conservative for large caps (10-K filings within 60 days) but might be too aggressive for small caps that file later.
Transaction costs are modeled, not exact. We apply 0.1-0.5% per trade using size tiers. Real-world costs depend on execution timing, order size, and market conditions.
Data: Ceta Research / FMP warehouse. Annual income statements (operatingIncome, revenue) for all US-listed stocks, 2000-2025. Financial Services excluded. Equal-weight portfolios, annual April 1 rebalance, 45-day filing lag, 0.1-0.5% transaction costs. Benchmark: S&P 500 (SPY). Past performance does not guarantee future results. This is research content, not investment advice.
Academic basis: Novy-Marx (2013) "The Other Side of Value" (JFE), Haugen & Baker (1996) "Commonality in Determinants of Expected Stock Returns" (JFE), Asness et al. (2019) "Quality Minus Junk" (Review of Accounting Studies).