
Low Volatility Quality on UK Stocks: +6.0% vs FTSE 100, 43% Down Capture
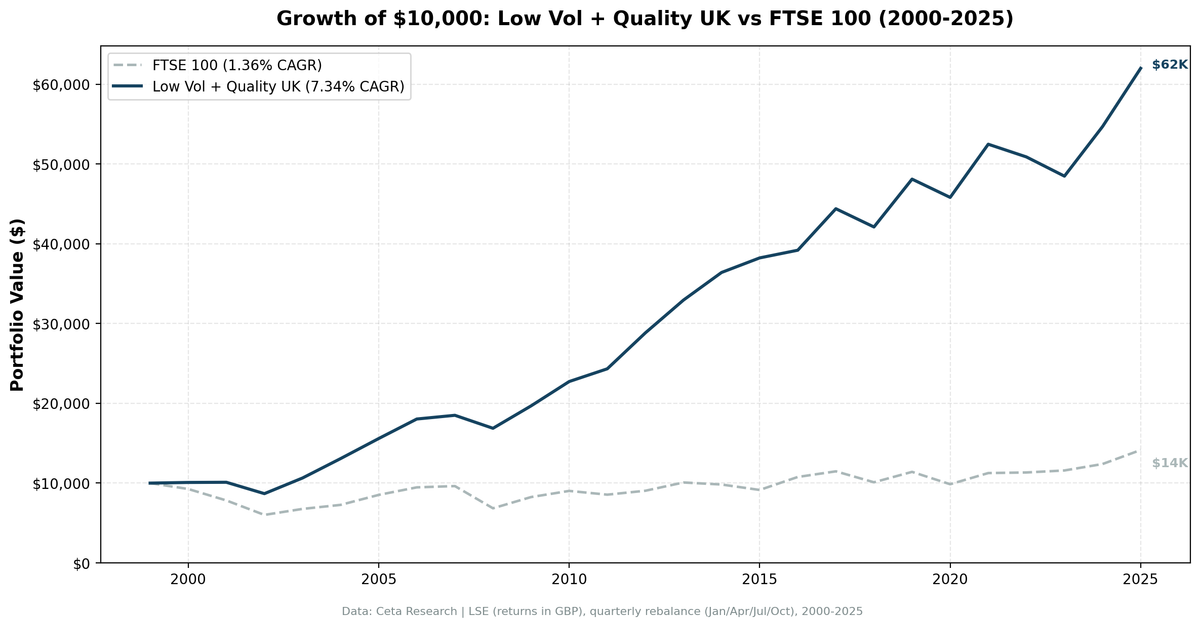
Low-vol quality stocks on the LSE returned 7.34% CAGR, beating the FTSE 100 by +5.99% annually from 2000 to 2025. Down capture of 42.77%, max drawdown -22.63% vs -43.69% for FTSE 100. Zero cash periods across 103 quarters.

Low Volatility Quality on UK Stocks (LSE): 43% Down Capture, +6.0% vs FTSE 100
We screened the LSE for low-volatility quality stocks and backtested from 2000 to 2025. ROE > 10%, operating margin > 10%, market cap above £500M, then ranked by lowest 252-day realized volatility and held the top 30. The portfolio returned 7.34% CAGR with a max drawdown of -22.63% vs -43.69% for the FTSE 100. Down capture was 42.77%. The strategy never sat in cash across 103 quarterly periods, averaging 29.3 stocks per rebalance.
Contents
- Method
- The Screen
- Results
- When It Works
- When It Struggles
- Limitations
- Part of a Series
- Run It Yourself
- Takeaway
- References
The UK result beats its local benchmark by +5.99% annually. The FTSE 100 returned just 1.36% CAGR over this period, badly lagging defensive quality stocks. The drawdown protection is real: 43% down capture means the portfolio absorbed less than half of the market's losses. That's the trade-off this strategy offers, and the LSE version delivers it with positive excess returns.
Data: FMP financial data warehouse, 2000–2025. Updated March 2026.
Method
Data source: Ceta Research (FMP financial data warehouse, 70K+ global stocks) Universe: LSE (United Kingdom), market cap > £500M (~$635M USD) Period: January 2000 to March 2025 (25.8 years, 103 quarterly periods) Rebalancing: Quarterly (January, April, July, October) Benchmark: FTSE 100 Execution: Next-day close (MOC) Cash rule: Portfolio holds cash if fewer than 10 stocks qualify Transaction costs: Size-tiered model (0.1% for large caps, 0.3% for mid caps, 0.5% for small caps) Data quality guards: 45-day lag on annual filings, minimum 200 trading days for vol computation, max single return capped at 200%, penny stocks (< $1) excluded
Signal filters:
| Filter | Threshold | Source |
|---|---|---|
| Return on equity | > 10% | key_metrics FY |
| Operating profit margin | > 10% | financial_ratios FY |
| Market cap | > £500M | key_metrics FY |
| 252-day realized volatility | Rank ASC, top 30 | stock_eod daily returns |
| Minimum trading days | >= 200 in 14-month window | stock_eod |
The £500M threshold filters out small-cap noise on the LSE. The UK has one of the deeper large-cap pools in Europe, so this cutoff still leaves a wide enough universe for the volatility ranking to be meaningful.
The Screen
SELECT
  k.symbol,
  p.companyName,
  ROUND(k.returnOnEquityTTM * 100, 2) AS roe_pct,
  ROUND(f.operatingProfitMarginTTM * 100, 2) AS opm_pct,
  ROUND(k.marketCap / 1e9, 2) AS mktcap_b
FROM key_metrics_ttm k
JOIN financial_ratios_ttm f ON k.symbol = f.symbol
JOIN profile p ON k.symbol = p.symbol
WHERE k.returnOnEquityTTM > 0.10
  AND f.operatingProfitMarginTTM > 0.10
  AND k.marketCap > 500000000
  AND p.exchange IN ('LSE')
ORDER BY k.marketCap DESC
LIMIT 30
This produces the quality universe. The full strategy ranks these candidates by trailing 252-day volatility (computed from daily returns) and selects the 30 lowest-volatility names. Volatility ranking requires daily price data and can't be computed in a single SQL query.
Try the quality screen on Ceta Research
Results
| Metric | Low Vol + Quality (LSE) | FTSE 100 |
|---|---|---|
| CAGR | 7.34% | 1.36% |
| Total Return | 519.94% | 41.43% |
| Max Drawdown | -22.63% | -43.69% |
| Annualized Volatility | 11.32% | 14.22% |
| Sharpe Ratio | 0.339 | -0.151 |
| Sortino Ratio | 0.503 | -0.190 |
| Calmar Ratio | 0.324 | 0.031 |
| VaR (95%) | -8.76% | -13.42% |
| Beta | 0.628 | 1.0 |
| Alpha | 5.19% | -- |
| Up Capture | 99.90% | -- |
| Down Capture | 42.77% | -- |
| Avg Stocks per Period | 29.3 | -- |
| Cash Periods | 0 of 103 | -- |
$10,000 invested in 2000 grew to $61,994 in the low-vol quality LSE portfolio vs $14,143 in the FTSE 100. The strategy beat its benchmark by +5.99% annually. The LSE portfolio achieved this with a max drawdown 21 percentage points shallower, 20% less volatility, and a vastly better Calmar ratio (0.324 vs 0.031).
The capture ratio tells the story: 99.90% up capture vs 42.77% down capture. The portfolio captures nearly all of the FTSE 100's gains while absorbing less than half of losses. That asymmetry drives the positive excess return while maintaining lower risk.
The portfolio's 0.339 Sharpe is solid given the environment. The FTSE 100's -0.151 Sharpe reflects a brutal 25 years for UK large caps. Defensive quality stocks provided the best shelter in this environment.
When It Works
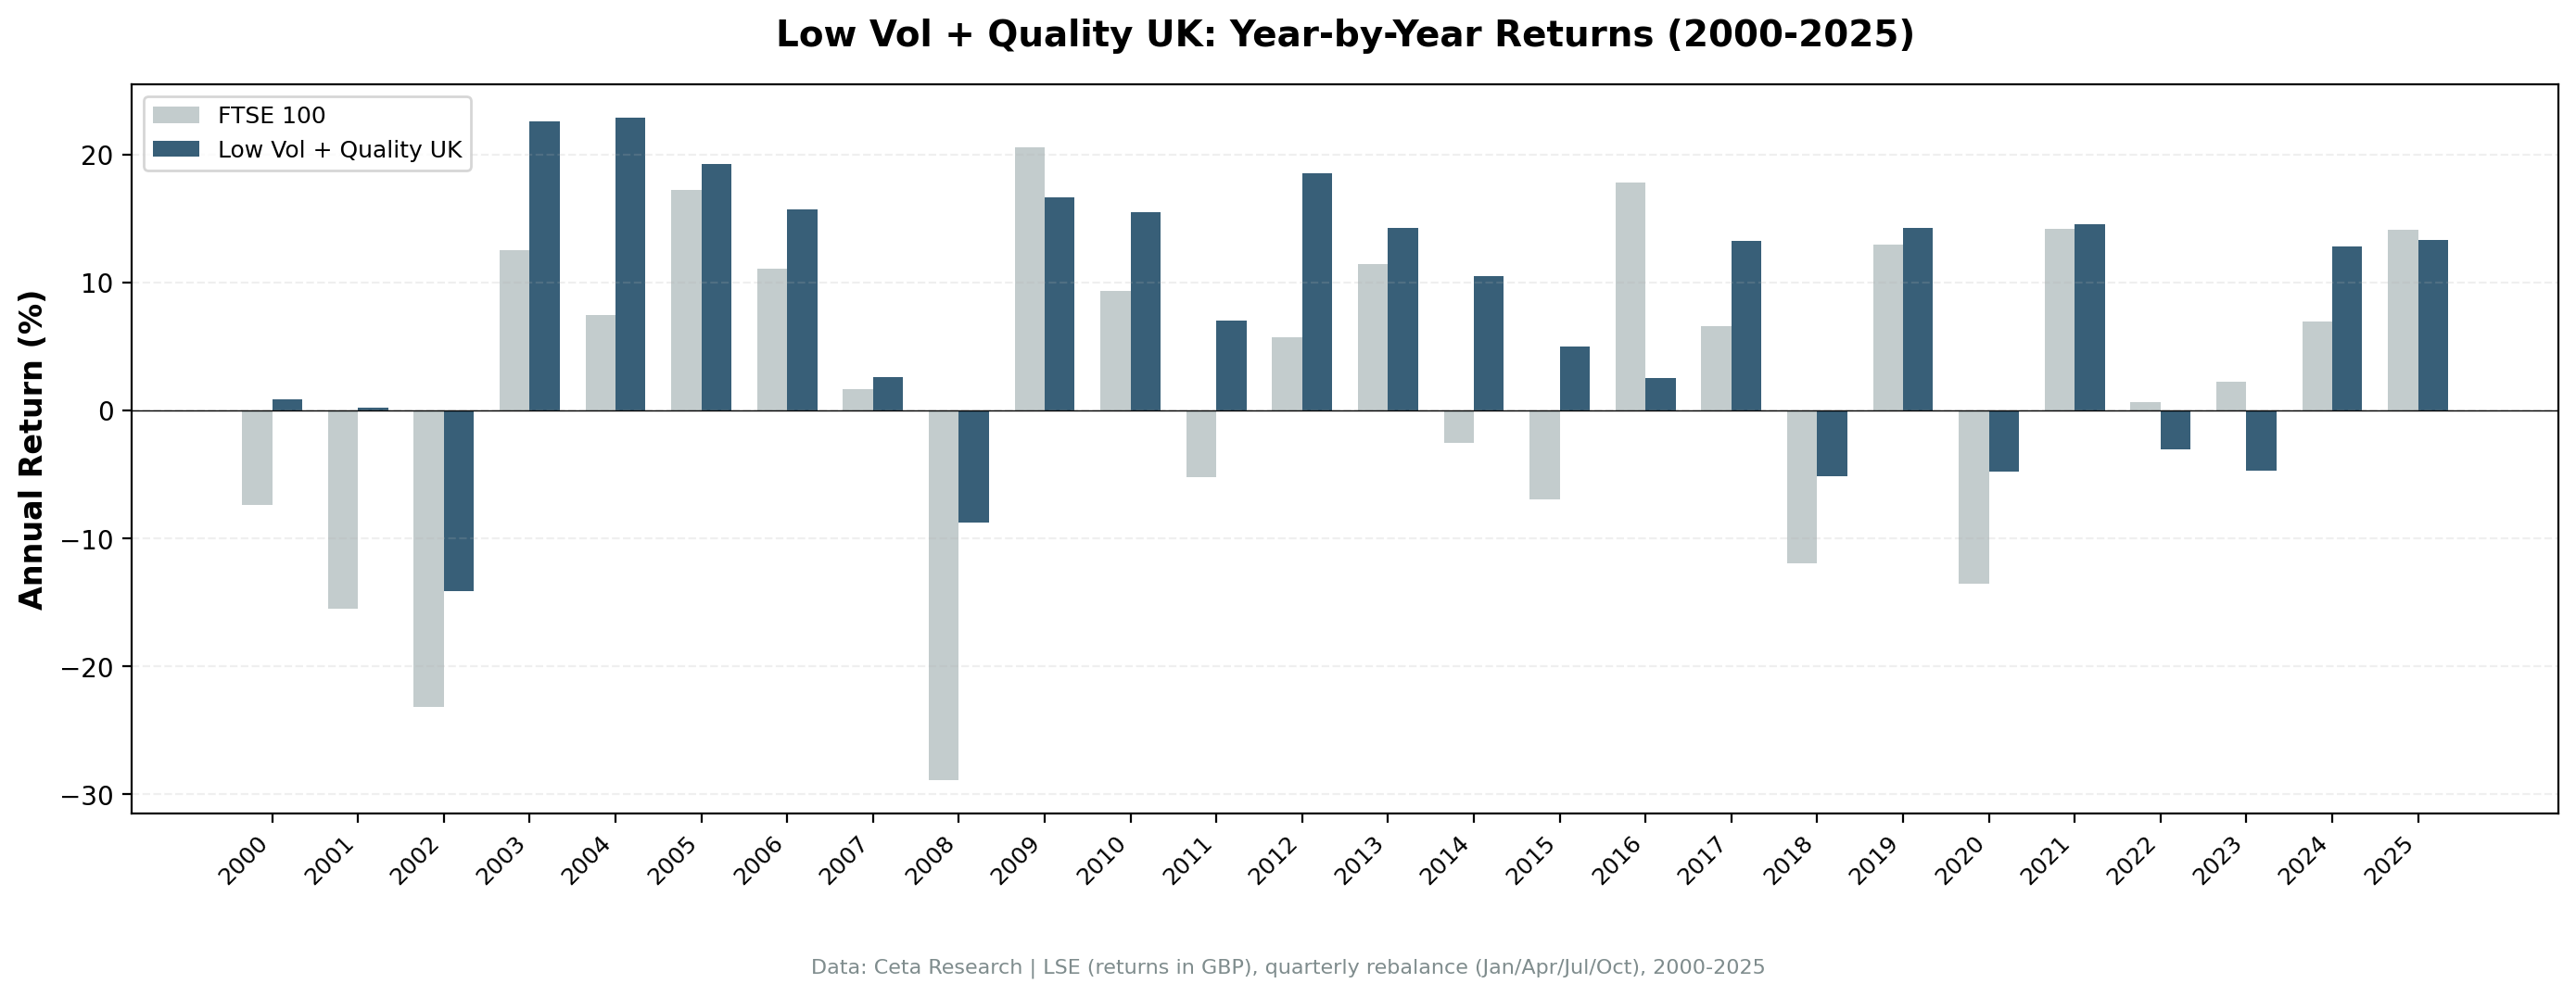
Bear markets and drawdown events. The biggest edge shows up when equities sell off hard.
| Year | Low Vol + Quality (LSE) | FTSE 100 | Excess |
|---|---|---|---|
| 2008 | Global financial crisis | FTSE down -28.9% | +20.1% |
| 2001 | Post dot-com selloff | FTSE down -15.5% | +15.7% |
| 2004 | Recovery rally | FTSE up +7.5% | +15.4% |
2008 was the strategy's best year in relative terms. The global financial crisis hammered UK banks (RBS, Barclays, HBOS), but the quality filter excluded most of them. Companies with ROE > 10% and OPM > 10% at the time were concentrated in consumer staples, healthcare, and utilities, not leveraged banks. While the FTSE 100 fell -28.9%, the LSE low-vol portfolio lost just -8.8%, absorbing only a fraction of the decline. The +20.1% excess in a single year is the kind of asymmetry that justifies holding the strategy through bull markets.
2001 reinforced the pattern in the post dot-com downturn. While the FTSE 100 fell -15.5%, the portfolio's defensive positioning kept it roughly flat at +0.2% for +15.7% excess. Low-vol quality stocks held up through the uncertainty that defined the early 2000s, while speculative telecom and tech names collapsed.
2004 shows the strategy can also win in rising markets. The FTSE 100 gained +7.5%, but the low-vol quality portfolio returned +22.9% for +15.4% excess. Defensive multinationals like Unilever and GlaxoSmithKline compounded steadily while the broader index lagged.
UK large caps during crises. The LSE's large-cap universe includes companies like Unilever, AstraZeneca, and Diageo. These multinationals earn revenue globally, which provides natural diversification. When the UK domestic economy struggles, their international revenue streams act as a buffer. The FTSE 100 derives roughly 75% of its revenues from outside the UK. For a low-vol quality screen, this means the portfolio is less exposed to UK-specific economic shocks than it appears from the exchange label.
When It Struggles
Momentum-driven rallies. When risk appetite is high, low-vol stocks can't keep up.
| Year | Low Vol + Quality (LSE) | FTSE 100 | Excess |
|---|---|---|---|
| 2016 | Brexit year | FTSE up +17.8% | -15.3% |
| 2023 | Rate-driven rotation | FTSE up +2.2% | -7.0% |
| 2009 | Post-crisis bounce | FTSE up +20.6% | -3.9% |
2016 was the worst relative year: -15.3% excess. The FTSE 100's large-cap multinationals surged as GBP depreciated after the Brexit vote. Foreign earnings translated into more pounds, boosting reported returns. The FTSE 100 rose +17.8% while the low-vol quality portfolio gained just +2.5%. The portfolio held many of these same companies but underperformed due to lower participation in the currency tailwind and its tilt toward steadier domestic defensives.
2023 cost the portfolio -7.0% in relative terms. The FTSE 100 edged up +2.2% while the low-vol quality portfolio fell -4.7%. Rising rates and a rotation toward energy and financials left defensive quality names behind.
2009 was the post-crisis bounce. After the March 2009 bottom, the sharpest gains went to the most beaten-down, highest-volatility stocks. Low-vol stocks held up better during 2008 (that's the point of the strategy) but then captured only a fraction of the snapback. The FTSE 100 surged +20.6% as risk appetite returned. The portfolio still rose +16.6% but lagged by -3.9%.
This is the structural cost of the trade-off. In years when the market bounces hard off bottoms, the portfolio won't keep pace. It's designed to protect capital in declines, not chase recoveries. The 65.05% win rate reflects this: the portfolio beats the FTSE 100 in nearly two-thirds of all quarters. When it loses, it tends to lag in sharp recovery years. When it wins, the margin is larger (2008's +20.1% excess, 2001's +15.7%). The asymmetry drives +5.99% annual excess return over 25 years.
Limitations
Absolute return gap vs US markets. The portfolio's 7.34% CAGR beats the FTSE 100 by +5.99% but trails US markets. The FTSE 100's 1.36% CAGR over this period reflects structural headwinds for UK large caps: Brexit uncertainty, commodity exposure, and financials regulation. The low-vol quality strategy outperformed its local benchmark substantially but couldn't match US equity returns.
Currency considerations. Returns are in GBP. The FTSE 100's multinationals earn substantial foreign revenue, creating natural currency hedges. GBP depreciation (especially post-Brexit) benefited FTSE 100 companies more than the low-vol quality portfolio in certain years, affecting relative performance.
Sector concentration. The LSE low-vol quality portfolio concentrates in defensive sectors: consumer staples, healthcare, utilities. This creates implicit sector bets. Regulatory changes, commodity price swings, or sector-specific disruptions can hit these names disproportionately.
Local benchmark limitation. The FTSE 100's -0.151 Sharpe reflects a difficult 25 years for UK large caps. The strategy's 0.339 Sharpe is solid in this context but modest compared to the US version (0.484) operating in a stronger market environment.
Survivorship bias. Exchange membership uses current company profiles. Historical delistings and M&A on the LSE during 2000-2025 aren't fully captured. This likely causes a modest upward bias in reported returns.
Part of a Series
This post is part of our Low Volatility + Quality global exchange comparison. We ran the same strategy across 14 exchanges worldwide.
Low Volatility + Quality on US Stocks (6.53% CAGR, 0.484 Sharpe, -1.5% vs S&P 500) is the flagship post with full methodology, research context, and the complete 14-exchange comparison table.
Low Volatility + Quality on Indian Stocks (16.89% CAGR, +5.8% vs Sensex) delivered the strongest absolute and excess returns of any market tested.
Run It Yourself
Live screen:
python3 low-vol-quality/screen.py --preset uk
Backtest:
python3 low-vol-quality/backtest.py --preset uk --output results/returns_LSE.json --verbose
Code: github.com/ceta-research/backtests/tree/main/low-vol-quality
Takeaway
The LSE low-vol quality portfolio returned 7.34% CAGR vs 1.36% for the FTSE 100, delivering +5.99% annual excess return. The risk profile reinforces the case: -22.63% max drawdown vs -43.69%, down capture of 42.77%, and a beta of 0.628. The portfolio lived through the dot-com crash, the financial crisis, Brexit, COVID, and the 2022 rate shock without losing more than 23% peak-to-trough. The FTSE 100 never recovered its 2000 peak until 2024.
The UK is a natural home for this strategy. The LSE's large-cap universe is stocked with multinational consumer staples, pharmaceutical, and utility companies. These names produce steady cash flows, maintain high margins, and don't swing wildly. The quality filter keeps the profitable ones, and the volatility ranking picks the steadiest.
For investors focused on UK equities, the low-vol quality strategy delivered both absolute and risk-adjusted outperformance. It beat the FTSE 100 in nearly two-thirds of all quarters and captured 99% of upside while absorbing less than half of downside. In a market that went nowhere for 25 years, defensive quality stocks were the clear winner.
References
- Baker, M., Bradley, B. & Wurgler, J. (2011). "Benchmarks as Limits to Arbitrage: Understanding the Low-Volatility Anomaly." Financial Analysts Journal, 67(1), 40-54.
- Ang, A., Hodrick, R., Xing, Y. & Zhang, X. (2006). "The Cross-Section of Volatility and Expected Returns." Journal of Finance, 61(1), 259-299.
- Frazzini, A. & Pedersen, L. (2014). "Betting Against Beta." Journal of Financial Economics, 111(1), 1-25.
- Novy-Marx, R. (2013). "The Other Side of Value: The Gross Profitability Premium." Journal of Financial Economics, 108(1), 1-28.
Data: Ceta Research, 2000-2025. Full methodology: Methodology
Past performance does not guarantee future results. This is educational content, not investment advice.


