
Low Volatility Quality on Japanese Stocks (JPX): 6.38% CAGR, +2.98% vs Nikkei 225
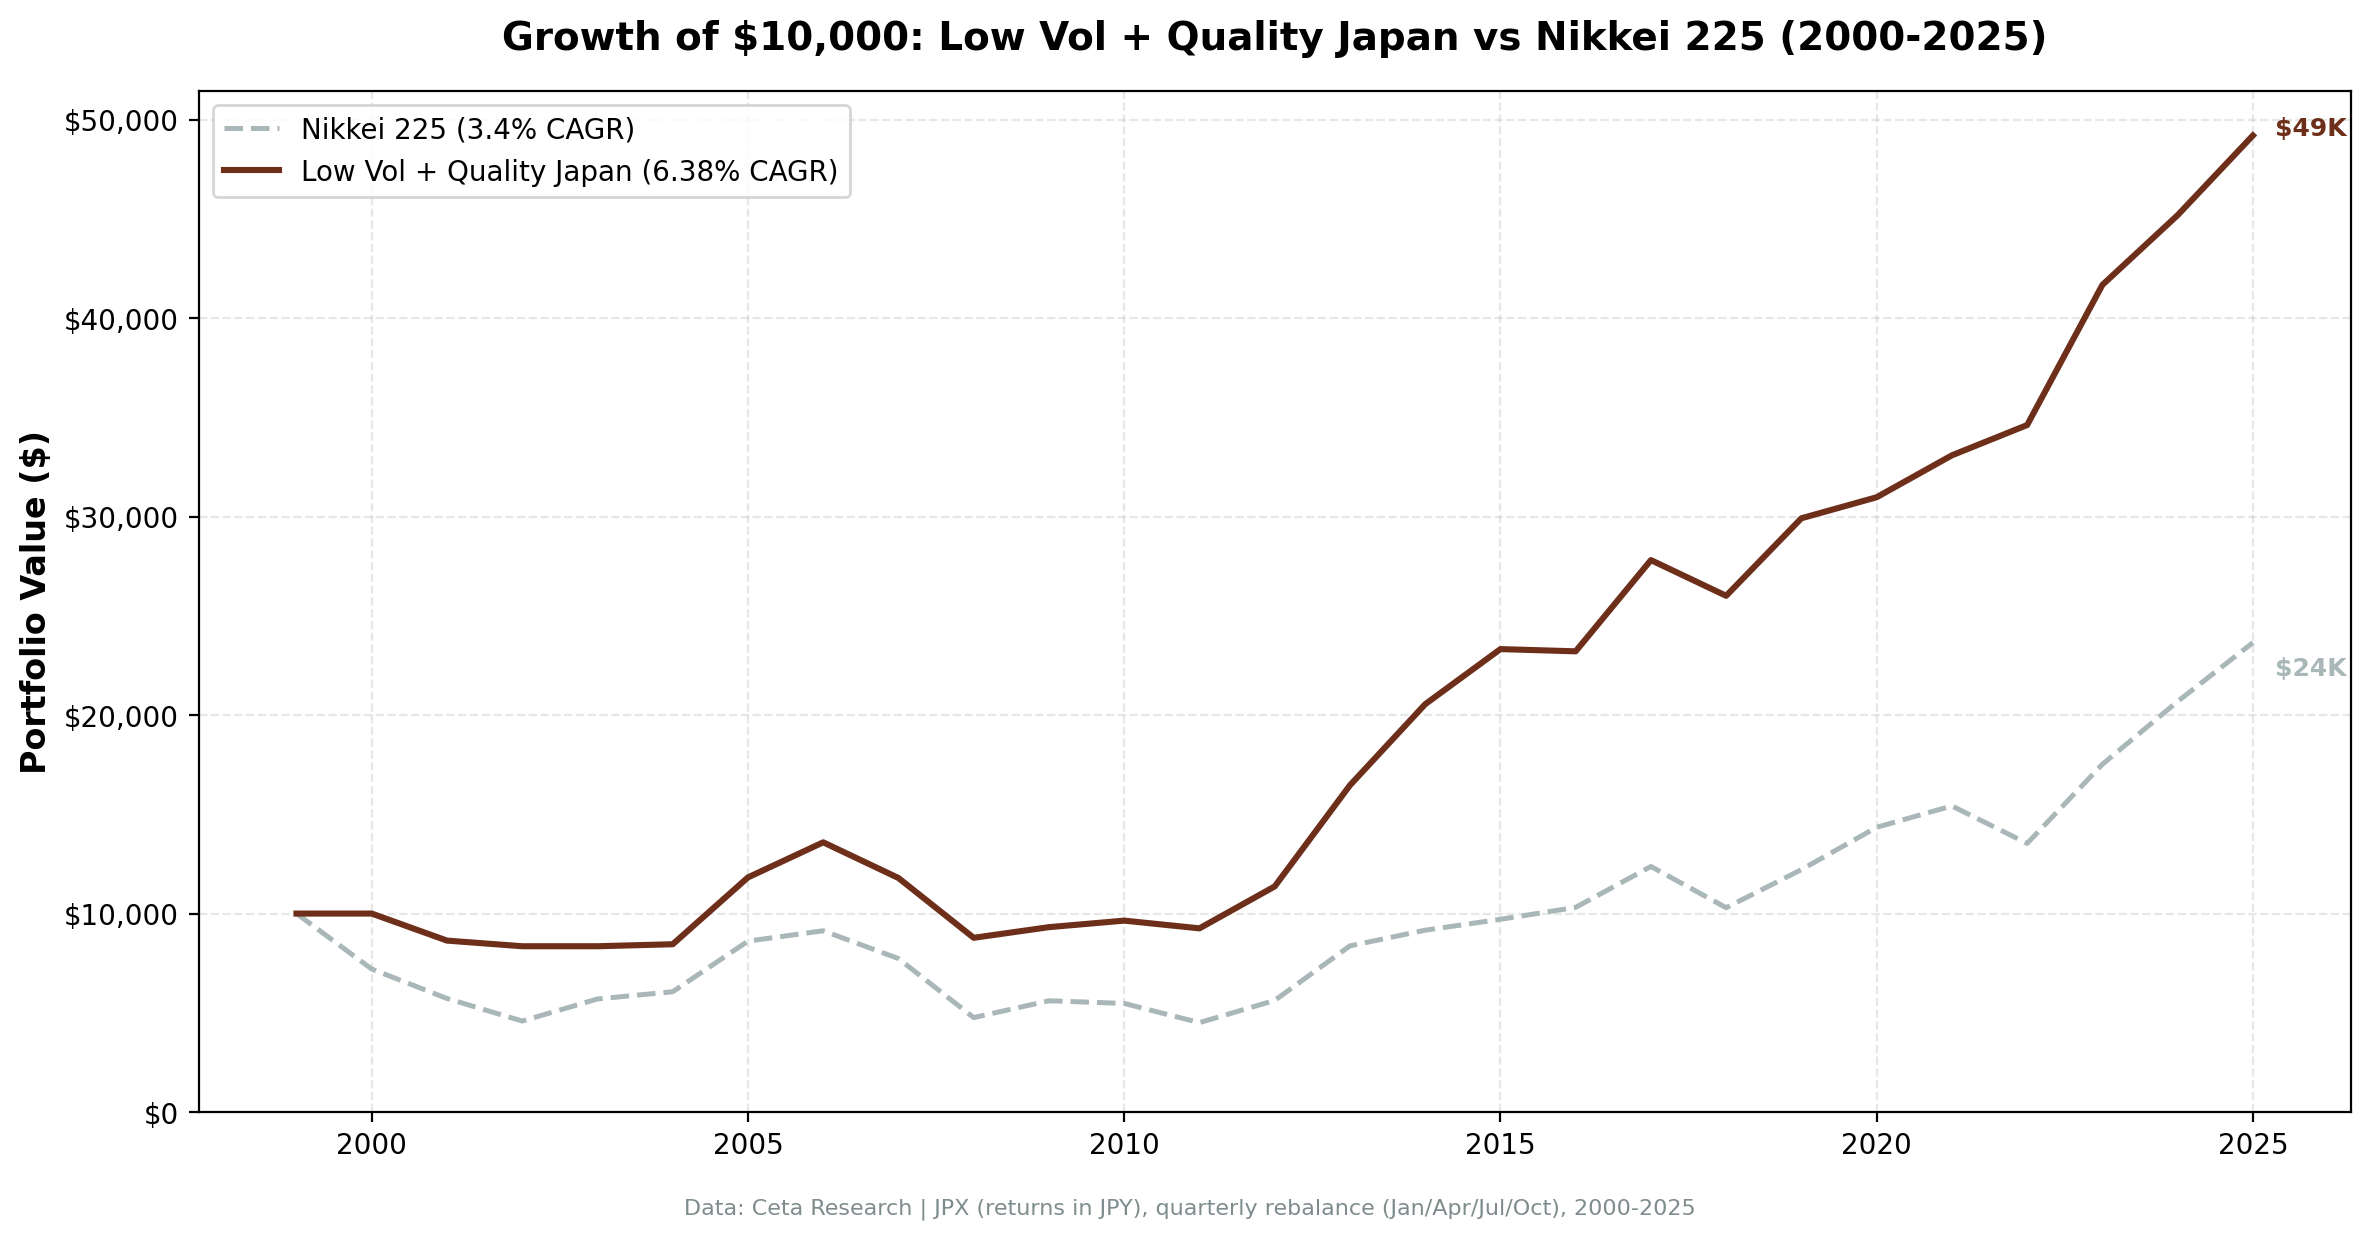
Low-vol quality stocks on the JPX returned 6.38% CAGR vs the Nikkei 225's 3.40% from 2000 to 2025. 0.398 Sharpe, 4.42% alpha, 58.25% win rate. Max drawdown of -42.16%. The strategy sat in cash for 14% of quarters due to late Japanese financial filings. Down capture of 43.22%.

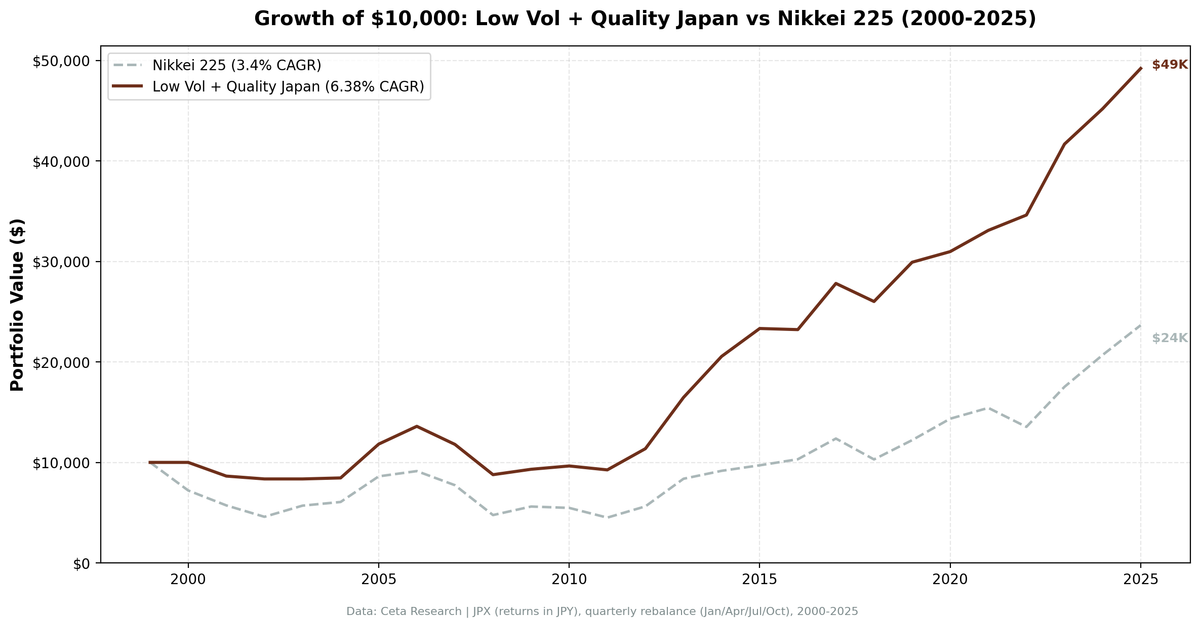
We screened the JPX for low-volatility quality stocks and backtested from 2000 to 2025. ROE > 10%, operating margin > 10%, market cap above ¥200B (~$1.3B USD), then ranked by lowest 252-day realized volatility and held the top 30. The portfolio returned 6.38% CAGR with a 0.398 Sharpe ratio vs the Nikkei 225's 3.40% CAGR. Max drawdown was -42.16%. The strategy sat in cash for 14 of 103 quarters because Japanese companies file annual reports later than their Western counterparts, leaving gaps in usable financial data.
Contents
- Method
- The Screen
- Results
- When It Works
- When It Struggles
- Limitations
- Part of a Series
- Run It Yourself
- Takeaway
- References
Japan's corporate culture naturally favors conservative, low-volatility companies. Stable employment, cross-shareholdings, and a preference for steady growth over aggressive expansion produce the kind of businesses this strategy targets. But that same culture creates a challenge: when most of the market already behaves "low-vol," the ranking has less to work with. The result is decent risk-adjusted performance (0.398 Sharpe) and +2.98% annual excess over the Nikkei, though absolute returns remain below faster-growing markets.
Data: FMP financial data warehouse, 2000–2025. Updated March 2026.
Method
Data source: Ceta Research (FMP financial data warehouse, 70K+ global stocks) Universe: JPX (Japan), market cap > ¥200B (~$1.3B USD) Period: January 2000 to March 2025 (25.8 years, 103 quarterly periods) Rebalancing: Quarterly (January, April, July, October) Benchmark: Nikkei 225 Cash rule: Portfolio holds cash if fewer than 10 stocks qualify Transaction costs: Size-tiered model (0.1% for large caps, 0.3% for mid caps, 0.5% for small caps) Data quality guards: 45-day lag on annual filings, minimum 200 trading days for vol computation, max single return capped at 200%, penny stocks (< $1) excluded
Signal filters:
| Filter | Threshold | Source |
|---|---|---|
| Return on equity | > 10% | key_metrics FY |
| Operating profit margin | > 10% | financial_ratios FY |
| Market cap | > ¥200B | key_metrics FY |
| 252-day realized volatility | Rank ASC, top 30 | stock_eod daily returns |
| Minimum trading days | >= 200 in 14-month window | stock_eod |
The ¥200B threshold is relatively high. Japan's equity market is deep (4,000+ listed companies on JPX), and a large-cap filter helps ensure the quality metrics are reliable. Many smaller Japanese firms don't report in formats that map cleanly to the FMP data warehouse.
Why 14% cash periods? Japanese fiscal years typically end March 31, with annual reports published in June or later. The 45-day filing lag means Q1 (January) and Q2 (April) rebalances often lack updated financials. When fewer than 10 stocks pass all filters with current data, the portfolio sits in cash. This is conservative by design, but it costs returns in strong market quarters.
The Screen
SELECT
  k.symbol,
  p.companyName,
  ROUND(k.returnOnEquityTTM * 100, 2) AS roe_pct,
  ROUND(f.operatingProfitMarginTTM * 100, 2) AS opm_pct,
  ROUND(k.marketCap / 1e9, 2) AS mktcap_b
FROM key_metrics_ttm k
JOIN financial_ratios_ttm f ON k.symbol = f.symbol
JOIN profile p ON k.symbol = p.symbol
WHERE k.returnOnEquityTTM > 0.10
  AND f.operatingProfitMarginTTM > 0.10
  AND k.marketCap > 200000000000
  AND p.exchange IN ('JPX')
ORDER BY k.marketCap DESC
LIMIT 30
Note: the market cap threshold is in the local currency unit used by the data warehouse. ¥200B = 200,000,000,000 yen. This produces the quality universe. The full strategy ranks these candidates by trailing 252-day volatility and selects the 30 lowest-volatility names.
Try the quality screen on Ceta Research
Results
| Metric | Low Vol + Quality (JPX) | Nikkei 225 |
|---|---|---|
| CAGR | 6.38% | 3.40% |
| Total Return | 391.87% | -- |
| Max Drawdown | -42.16% | -- |
| Annualized Volatility | 15.78% | -- |
| Sharpe Ratio | 0.398 | -- |
| Sortino Ratio | 0.625 | -- |
| Calmar Ratio | 0.151 | -- |
| VaR (95%) | -9.80% | -- |
| Beta | 0.566 | 1.0 |
| Alpha | 4.42% | -- |
| Up Capture | 69.16% | -- |
| Down Capture | 43.22% | -- |
| Win Rate | 58.25% | -- |
| Avg Stocks per Period | 28.9 | -- |
| Cash Periods | 14 of 103 (14%) | -- |
$10,000 invested in 2000 grew to $49,187 in the JPX low-vol quality portfolio. The strategy beat the Nikkei 225 by +2.98% annually, with 4.42% alpha. The Sortino ratio of 0.625 and a 58.25% win rate confirm the portfolio produces solid returns per unit of downside deviation.
The VaR (95%) at -9.80% shows the day-to-day risk is contained. The max drawdown (-42.16%) is painful but expected. Japan's "lost decades" and the 2008 global financial crisis hit the JPX hard regardless of quality or volatility screening.
The 14% cash rate is the most distinctive feature of the Japan result. Those quarters dragged on cumulative returns. In a market where the Nikkei gained 60%+ from 2012 to 2015 during Abenomics, sitting in cash for even a few quarters is expensive.
When It Works
Bear markets and rate shocks. Japan's best excess returns came when the Nikkei fell and the quality basket lost less or sat safely in cash.
| Year | Low Vol + Quality | Nikkei 225 | Excess |
|---|---|---|---|
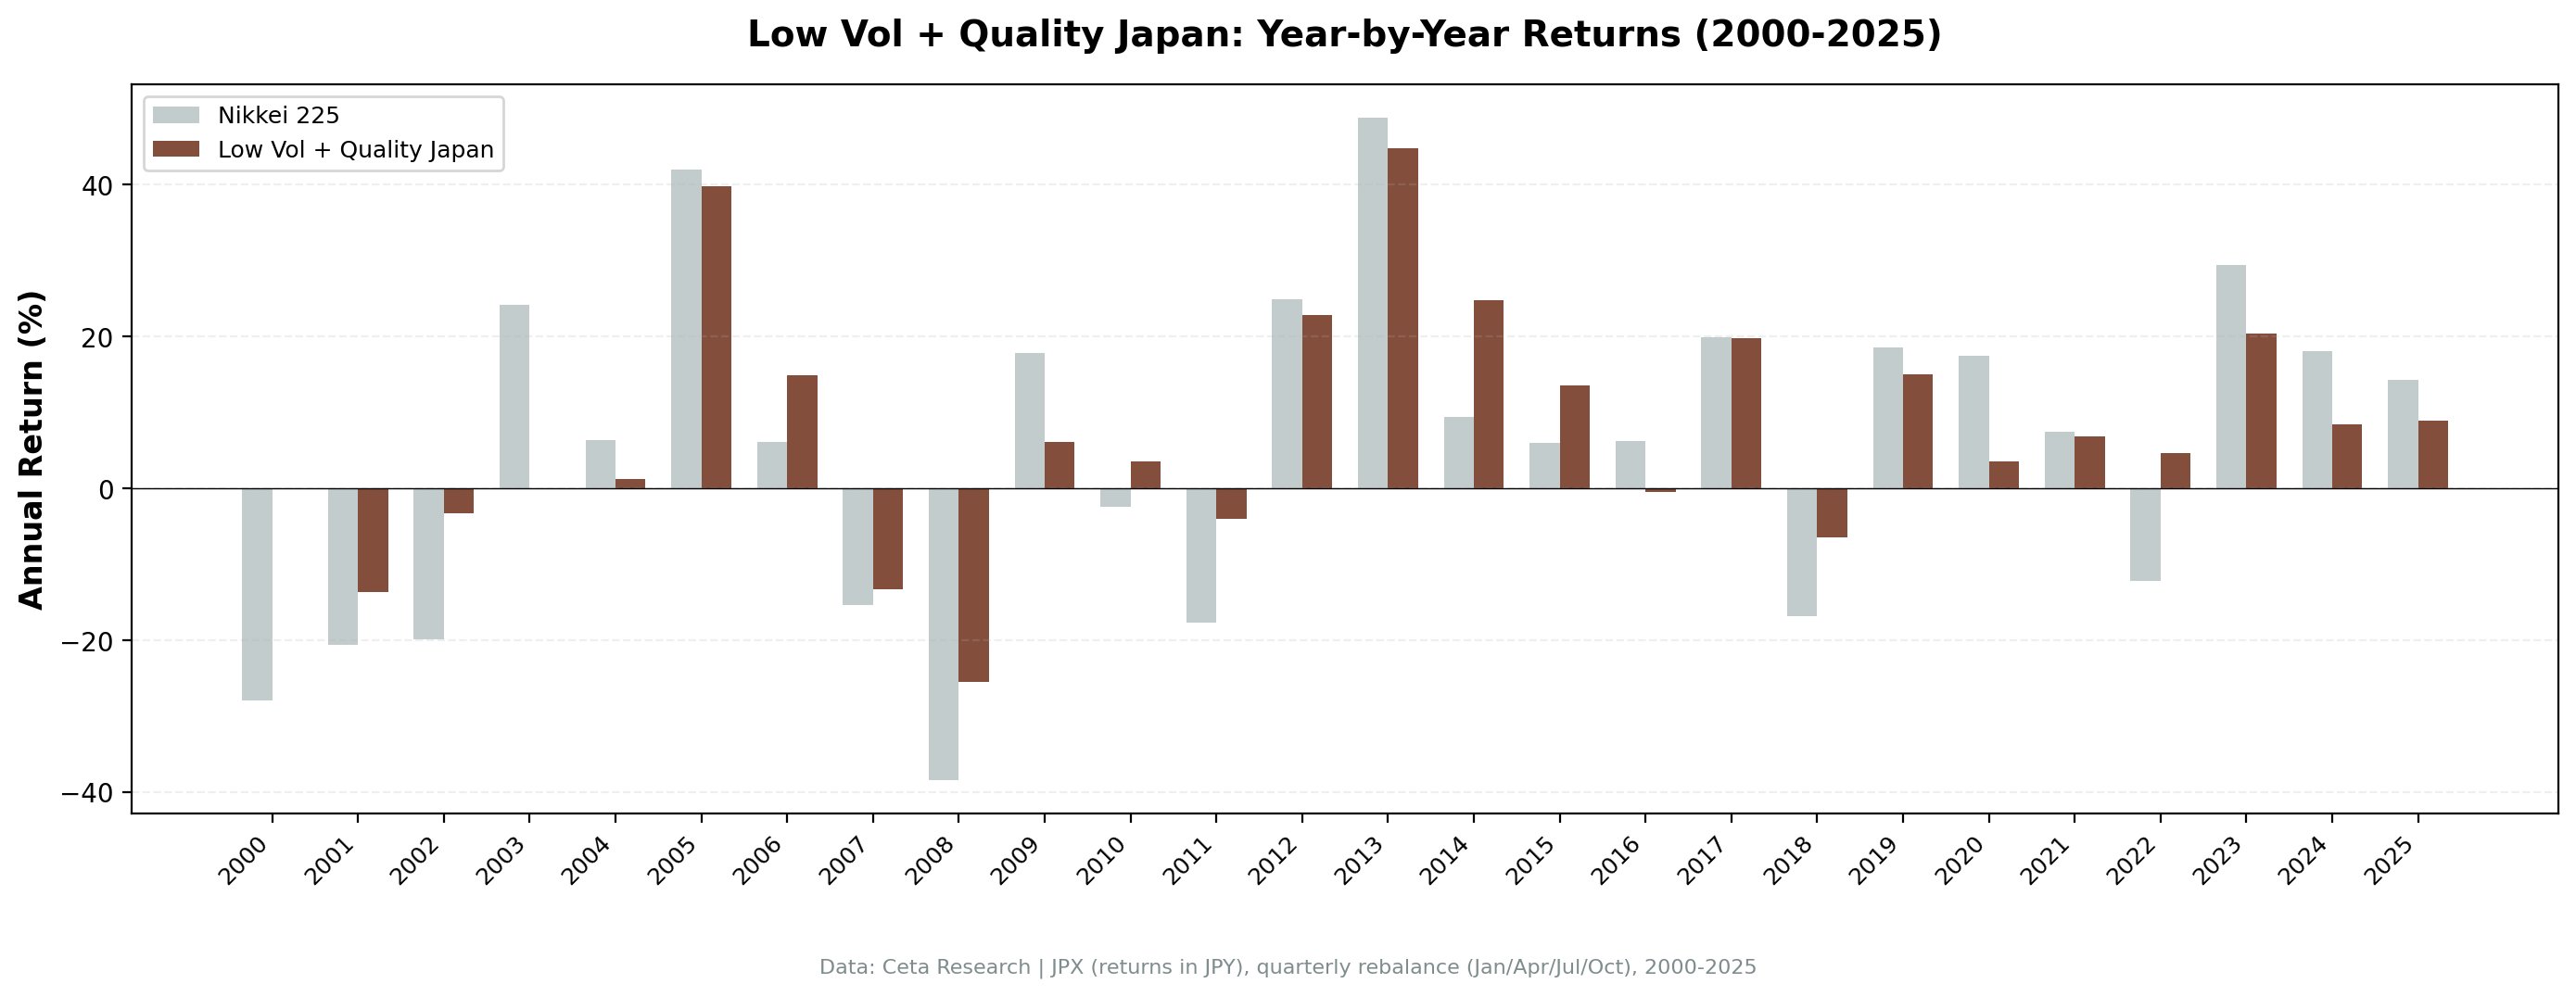
| 2000 | +0.0% | -27.9% | +27.9% |
| 2022 | +4.6% | -12.2% | +16.8% |
| 2002 | -3.3% | -19.9% | +16.6% |
| 2014 | +24.8% | +9.4% | +15.4% |
2000 and 2002 were pure downside protection. In 2000 the dot-com bear dragged the Nikkei down -27.9%, but the portfolio sat flat in cash (+0.0%) after filing-lag gaps left too few names qualifying. Sitting out a collapsing market handed the strategy +27.9% of excess without any equity risk. 2002 was the same story with capital deployed: the Nikkei fell -19.9% while the quality basket lost just -3.3%, a +16.6% edge. When Japan's market sells off, the low-vol quality tilt consistently loses less.
2014 is the cleanest outperformance year. The Nikkei posted a modest +9.4%, but the low-vol quality portfolio returned +24.8%. Quality exporters with stable margins captured the yen depreciation tailwind without the cyclical risk of broader market names.
2022 shows the same defensive edge in a rate-shock year. When global rates spiked and the Nikkei fell -12.2%, the JPX portfolio returned +4.6%. Japan was in a unique position: while the rest of the world tightened monetary policy, the BOJ maintained ultra-loose policy. The yen weakened to multi-decade lows, boosting export earnings for the quality names in the portfolio.
When It Struggles
Recovery rallies and risk-on years. When the market snaps back hard, low-vol misses the party.
2003 is the mirror image of 2000. Both were cash years driven by filing-lag gaps, but the outcomes flipped with the market. In 2003 the Nikkei surged +24.2% on a recovery led by banks and trading houses that had been hammered in the prior bear market, and the portfolio sat in cash (+0.0%), giving up -24.2% of excess. Holding cash protects on the way down but costs dearly when the market rips higher.
2009 lagged even while fully invested. The post-financial-crisis bounce favored cyclicals and financials. Japanese real estate companies and construction firms, both high-vol sectors, led the recovery. The quality basket returned +6.1% while the Nikkei jumped +17.8%, a -11.7% shortfall.
2020 was the sharpest miss with capital deployed. After the COVID crash, the Nikkei roared back +17.5% on a risk-on rally led by growth and technology. Semiconductor equipment makers and other high-beta plays drove the index, while the low-vol quality basket, tilted toward steady consumer and industrial names, managed just +3.5%, a -13.9% gap. The same defensiveness that protects in bear markets caps the upside in a liquidity-fueled melt-up.
The 58.25% win rate is actually favorable for this strategy. The portfolio beats the Nikkei in more than half of all quarters. With 69.16% up capture and only 43.22% down capture, the asymmetry compounds over time: the portfolio participates in most of the market's gains while avoiding nearly 60% of its losses.
Limitations
Cash drag is real. 14 of 103 quarters in cash means the portfolio missed roughly 3.5 years of market exposure. In a market that tripled from its 2012 lows, that's a meaningful cost. The cash rule is conservative. A lower threshold (say, 5 stocks instead of 10) would reduce cash periods but increase concentration risk.
Max drawdown still deep. At -42.16%, the drawdown protection is limited. The US version cut max drawdown substantially (-26.0% vs -43.9%). Japan's version barely improved on it. The 2008 crisis hit Japanese quality stocks hard because Japan's banks and trading houses contaminated the broader market.
Filing lag bias. Japanese companies report later than US or European peers. The 45-day lag assumption may still introduce look-ahead bias for some companies that report on the edge of the window. The cash periods partially mitigate this but don't eliminate it.
Survivorship bias. Exchange membership uses current company profiles. Historical delistings on JPX during 2000-2025 aren't fully captured.
Part of a Series
This post is part of our Low Volatility + Quality global exchange comparison. We ran the same strategy across 14 exchanges worldwide.
Low Volatility + Quality on US Stocks is the flagship post with full methodology, research context, and the complete 14-exchange comparison table.
Run It Yourself
Live screen:
python3 low-vol-quality/screen.py --preset japan
Backtest:
python3 low-vol-quality/backtest.py --preset japan --output results/returns_JPX.json --verbose
Code: github.com/ceta-research/backtests/tree/main/low-vol-quality
Takeaway
Japan is a paradox for the low-vol quality strategy. The country's corporate culture should be the perfect fit: conservative management, stable dividends, low leverage. And the quality filter does find strong companies. But two factors limit the edge. Filing delays push the portfolio into cash 14% of the time, and Japan's broad market already has lower volatility than emerging markets, leaving less room for the vol-ranking to differentiate.
Against the Nikkei 225, the story is positive. The portfolio's 6.38% CAGR beats the index's 3.40% by +2.98% annually, with 4.42% alpha and a 58.25% win rate. The Sortino ratio of 0.625 confirms the portfolio handles downside risk well. The 2022 rate shock (+16.8% excess vs Nikkei) and 2014 (+15.4% excess) show what happens when the quality filter separates from the broad market.
For investors with JPY-denominated liabilities or a Japan allocation mandate, the strategy offers a clear improvement over the Nikkei with lower downside capture (43.22%) and meaningful alpha. The cash drag from filing delays is the main cost.
References
- Baker, M., Bradley, B. & Wurgler, J. (2011). "Benchmarks as Limits to Arbitrage: Understanding the Low-Volatility Anomaly." Financial Analysts Journal, 67(1), 40-54.
- Ang, A., Hodrick, R., Xing, Y. & Zhang, X. (2006). "The Cross-Section of Volatility and Expected Returns." Journal of Finance, 61(1), 259-299.
- Frazzini, A. & Pedersen, L. (2014). "Betting Against Beta." Journal of Financial Economics, 111(1), 1-25.
- Novy-Marx, R. (2013). "The Other Side of Value: The Gross Profitability Premium." Journal of Financial Economics, 108(1), 1-28.
Data: Ceta Research, 2000-2025. Full methodology: Methodology
Past performance does not guarantee future results. This is educational content, not investment advice.


