
Low Volatility Quality on Indian Stocks: 16.9% CAGR, +5.8% vs Sensex Over 25 Years
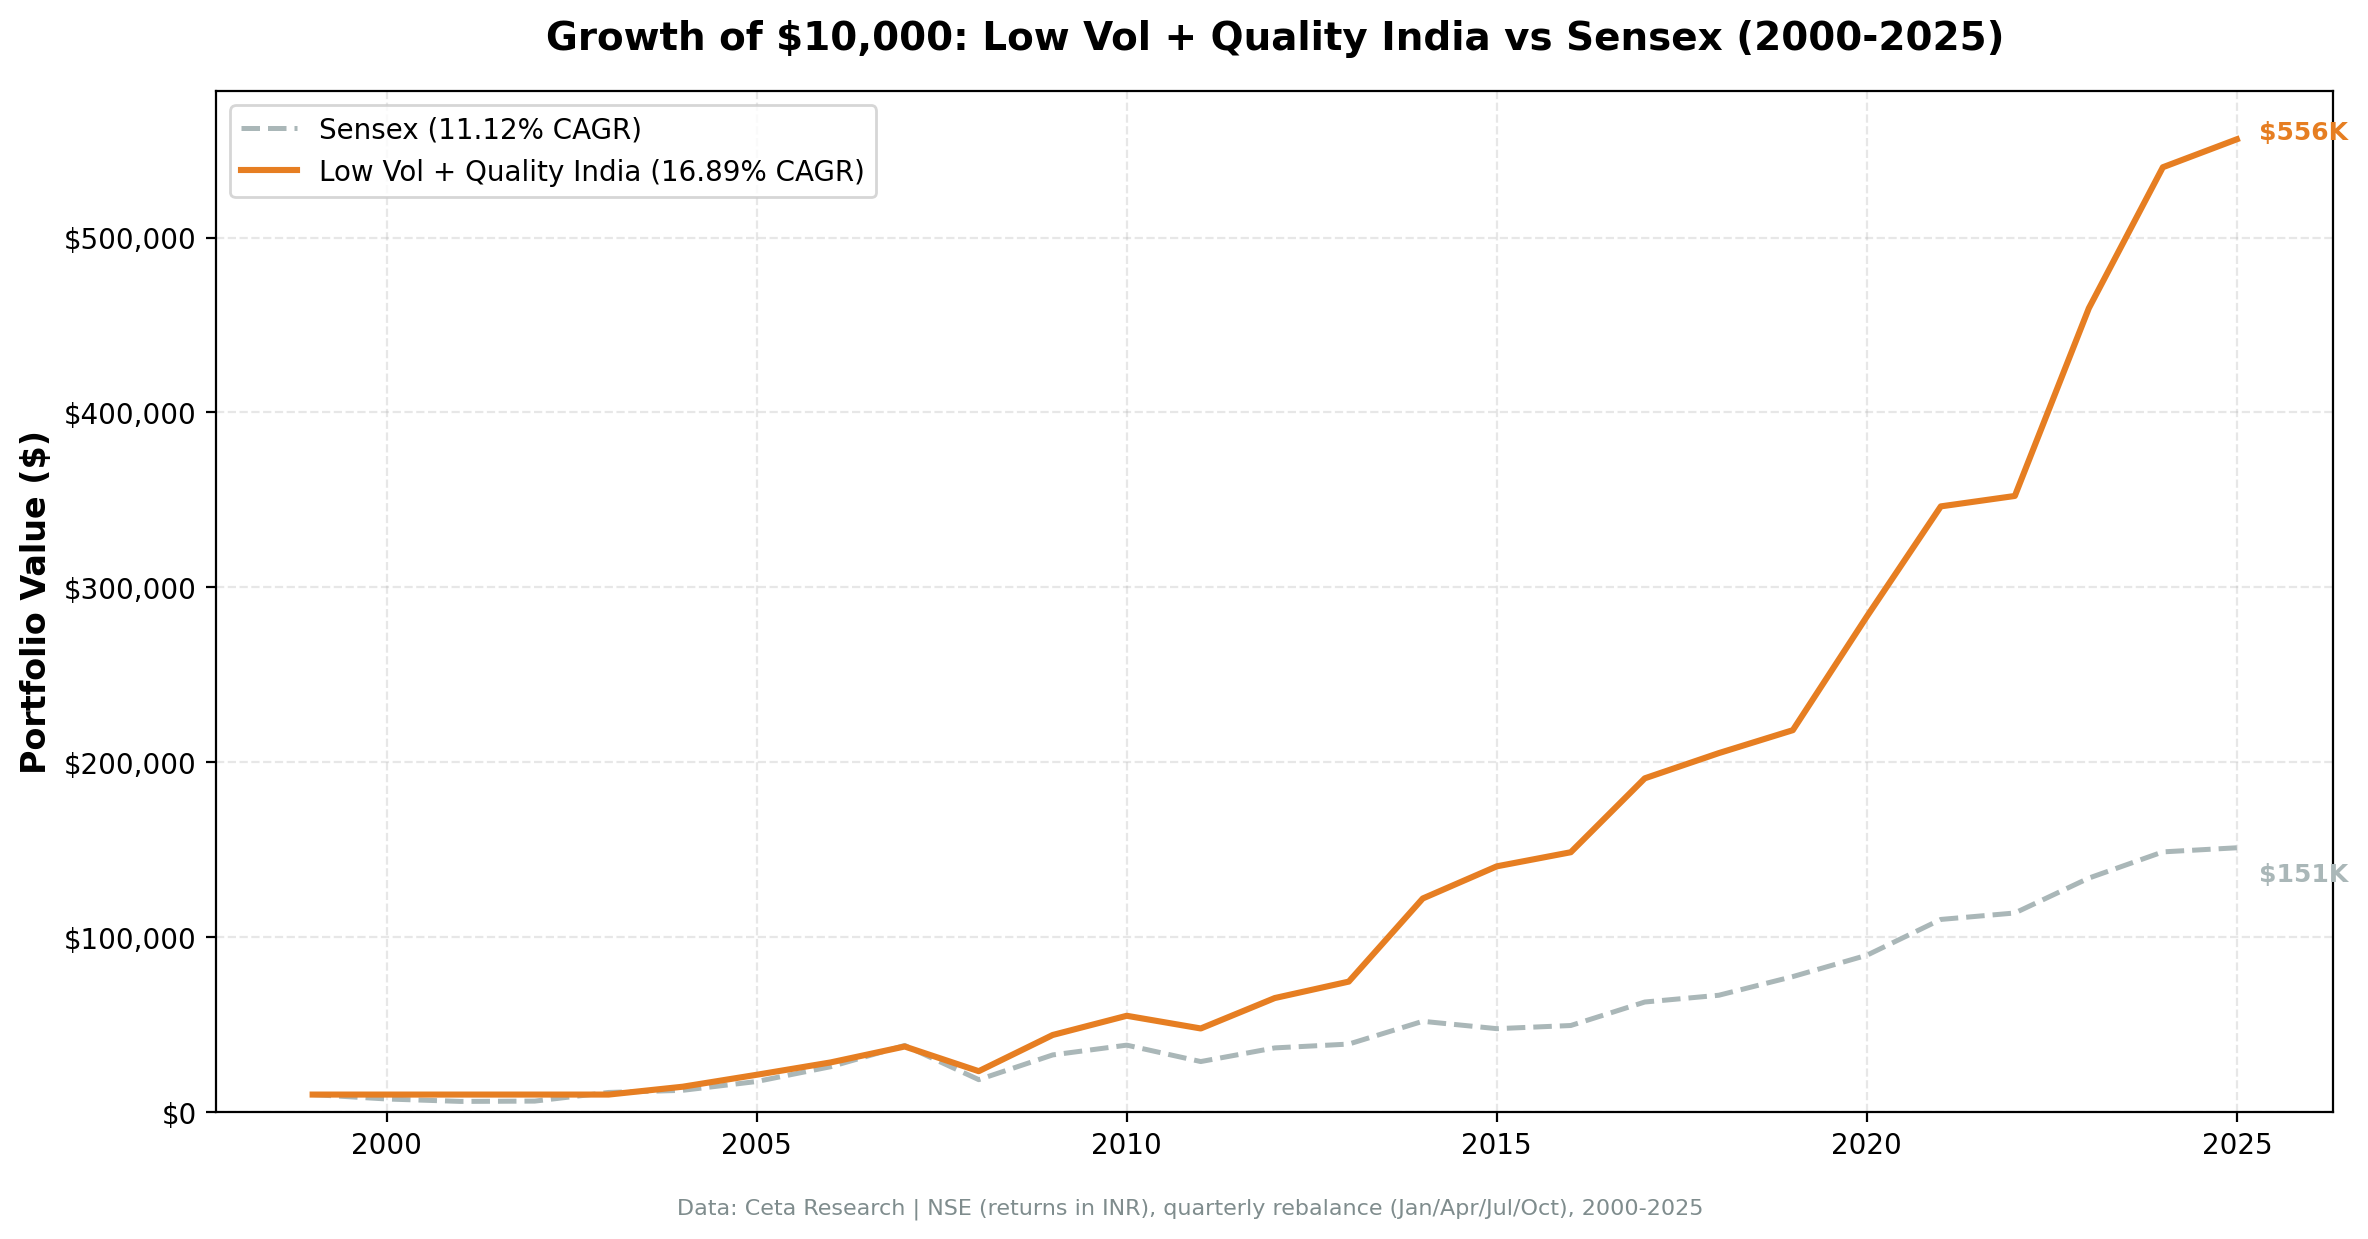
Low-vol quality stocks on NSE returned 16.89% CAGR with a 0.579 Sharpe ratio from 2000 to 2025. That is +5.8% annualized over the Sensex with 86.3% up capture and 37.1% down capture. $10,000 grew to roughly $556,000.


India is the standout market for this strategy. Low-vol quality stocks on NSE returned 16.89% CAGR from 2000 to 2025, turning $10,000 into roughly $556,000. That's +5.8% annualized excess over the Sensex (11.12% CAGR) with meaningfully lower drawdowns.
Contents
- Method
- The Screen
- Results
- When It Works
- When It Struggles
- Limitations
- Part of a Series
- Run It Yourself
- Takeaway
- References
The portfolio beat the Sensex in two-thirds of quarterly periods, with 86.3% up capture and 37.1% down capture. You got most of the market's upside while absorbing about a third of its downside. Over 25 years, that asymmetry compounds into a 3.7x difference in total return.
Data: FMP financial data warehouse, 2000–2025. Updated March 2026.
Method
| Parameter | Value |
|---|---|
| Universe | NSE (National Stock Exchange) |
| Filters | ROE > 10%, Operating Margin > 10% |
| Ranking | 252-day realized volatility, ascending |
| Rebalancing | Quarterly (January, April, July, October) |
| Max positions | 30 stocks, equal weight |
| Cash rule | Fewer than 10 qualifying stocks |
| Market cap | > 20B INR (~$240M USD) |
| Min trading days | >= 200 in 14-month window |
| Data source | FMP via Ceta Research warehouse |
| Benchmark | BSE Sensex (^BSESN) |
| Execution | Next-day close (MOC) |
| Period | 2000-2025 (25.8 years, 103 quarterly periods) |
For the full methodology and research context, see our US flagship post.
The Screen
-- Low Volatility Quality India (NSE) Screen
-- Run at: cetaresearch.com/data-explorer

SELECT
    k.symbol,
    p.companyName,
    ROUND(k.returnOnEquityTTM * 100, 2) AS roe_pct,
    ROUND(f.operatingProfitMarginTTM * 100, 2) AS opm_pct,
    ROUND(k.marketCap / 1e9, 2) AS mktcap_b_inr
FROM key_metrics_ttm k
JOIN financial_ratios_ttm f ON k.symbol = f.symbol
JOIN profile p ON k.symbol = p.symbol
WHERE k.returnOnEquityTTM > 0.10
    AND f.operatingProfitMarginTTM > 0.10
    AND k.marketCap > 20e9
    AND p.exchange = 'NSE'
ORDER BY k.marketCap DESC
LIMIT 30
This produces the quality universe. The full strategy ranks these candidates by trailing 252-day volatility (computed from daily returns) and selects the 30 lowest-volatility names.
Try the quality screen on Ceta Research
Results
| Metric | Low Vol + Quality | BSE Sensex |
|---|---|---|
| CAGR | 16.89% | 11.12% |
| Total Return | 5,460.77% | -- |
| Max Drawdown | -37.65% | -- |
| Annualized Volatility | 17.95% | -- |
| Sharpe Ratio | 0.579 | -- |
| Sortino Ratio | 1.116 | -- |
| Calmar Ratio | 0.449 | -- |
| VaR (95%) | -6.87% | -- |
| Beta | 0.576 | 1.0 |
| Alpha | 7.73% | -- |
| Up Capture | 86.25% | -- |
| Down Capture | 37.13% | -- |
| Win Rate | 65.05% | -- |
| Cash Periods | 18 of 103 | -- |
| Avg Stocks | 29.9 | -- |
$10,000 invested in 2000 grew to roughly $556,000 in the low-vol quality portfolio. Max drawdown of -37.65% is real pain, but the portfolio still delivered 7.73% annual alpha over the Sensex. The 0.576 beta means the portfolio captured just over half of the market's moves on a quarterly basis.
The 65.05% win rate shows the portfolio beat the Sensex in nearly two-thirds of all quarterly periods. That consistency, not any single blowout year, is what drives the 5,461% total return.
When It Works
Crisis recovery and domestic bull markets. India's largest excess returns came in years where the local economy boomed or the market bounced hard from a sell-off.
| Year | Low Vol + Quality | Sensex | Excess |
|---|---|---|---|
| 2004 | +44.9% | +10.8% | +34.0% |
| 2014 | +63.7% | +33.5% | +30.2% |
| 2015 | +15.1% | -8.1% | +23.2% |
| 2009 | +88.6% | +76.3% | +12.3% |
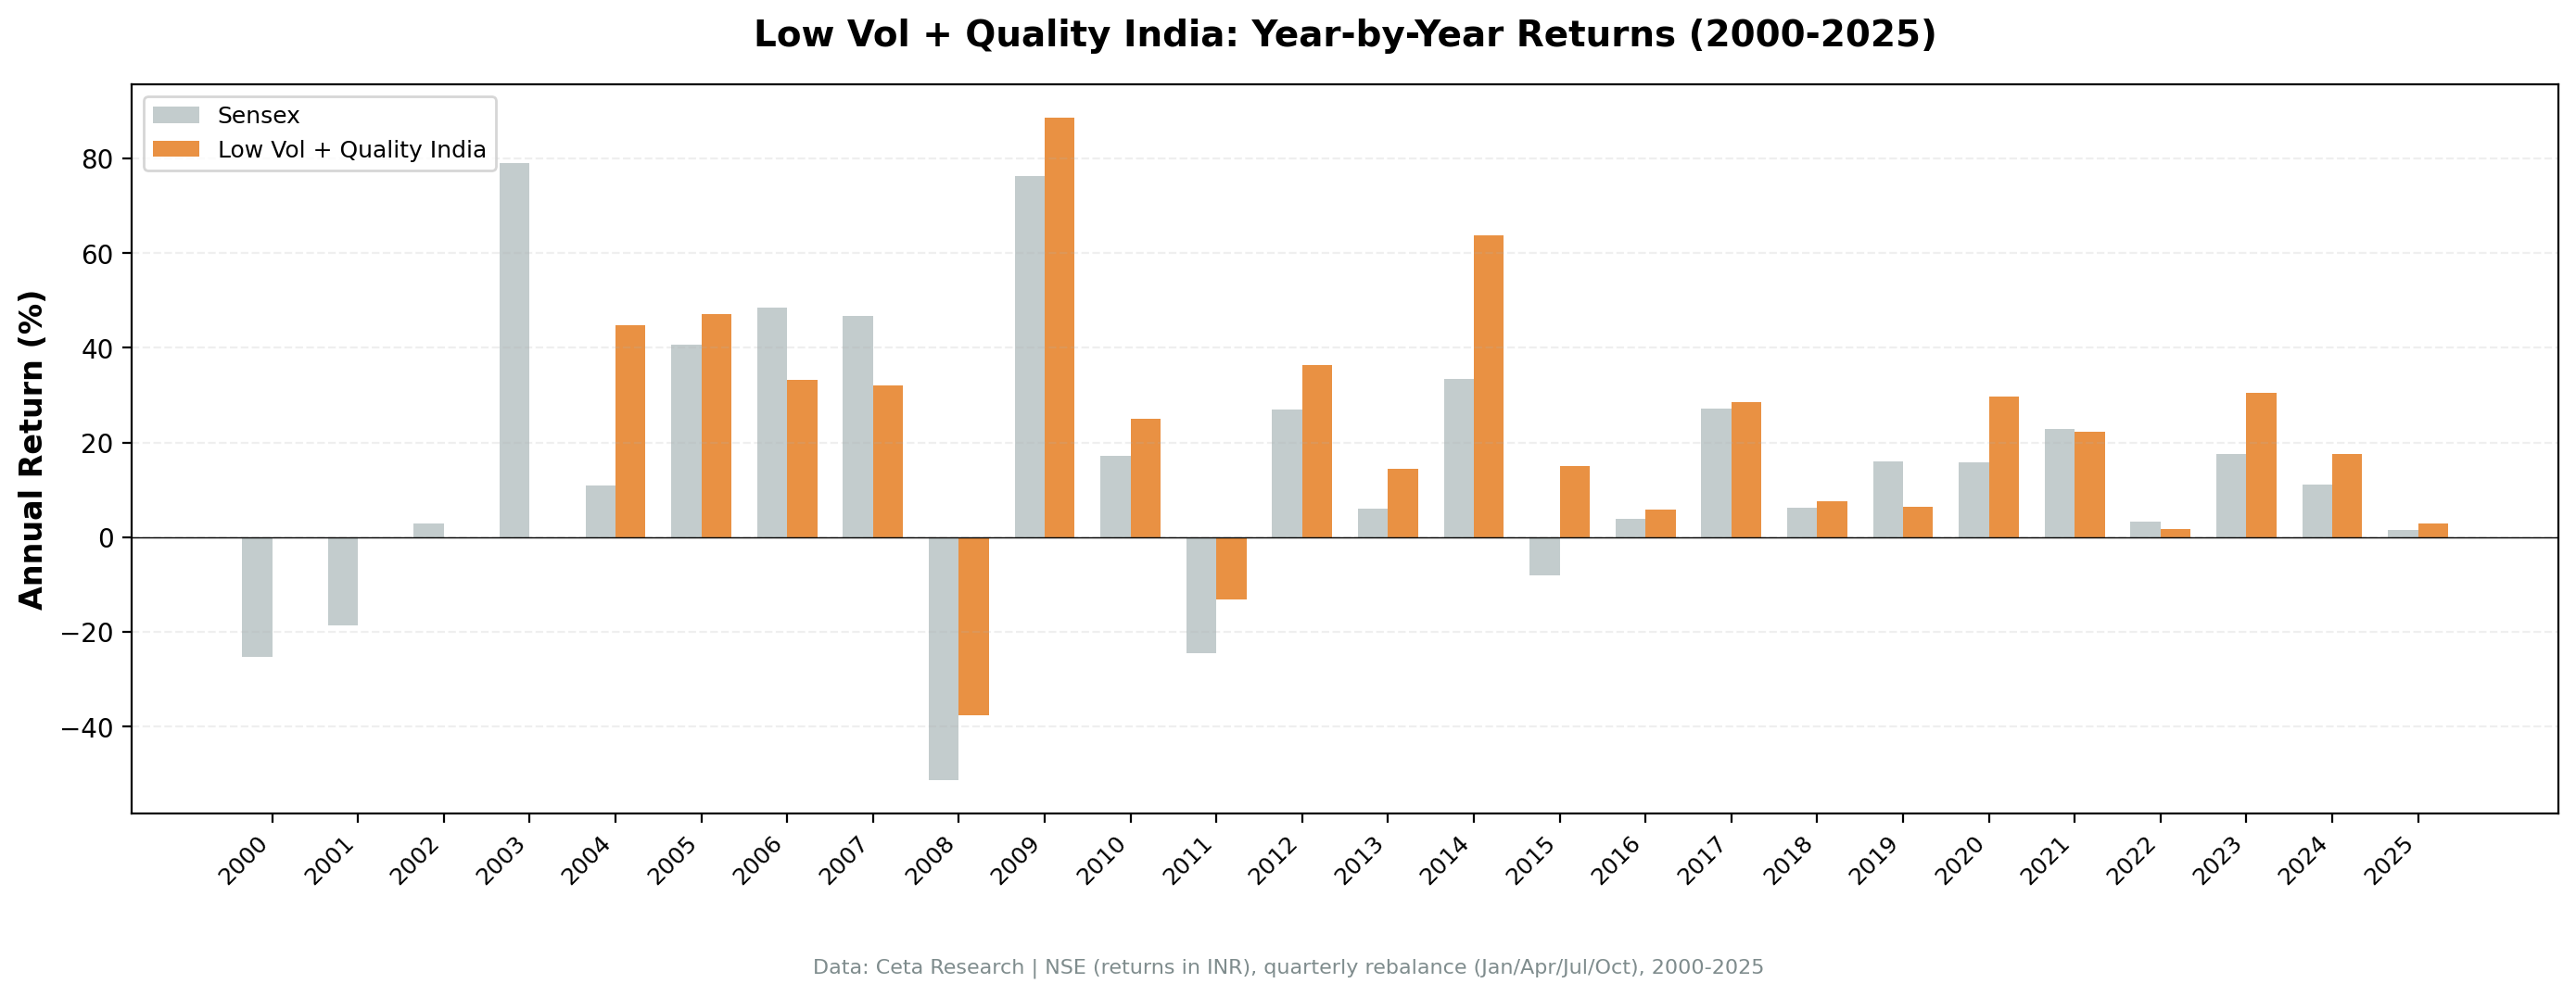
2004 produced the single largest excess year, +34.0%, as low-vol quality names compounded through a volatile election year while the Sensex managed only +10.8%. 2014 saw the Modi election rally lift domestic-facing industrials and consumer names, exactly the kind of profitable, stable businesses this strategy holds. The portfolio returned +63.7% vs +33.5% for the Sensex, a +30.2% excess. 2009 was an +88.6% return as Indian markets snapped back from the 2008 crisis. Quality companies with low vol survived the drawdown with their businesses intact, and they led the recovery.
Consistent compounding. Unlike many strategies that depend on a handful of blowout years, India's results are broadly distributed. The portfolio posted double-digit returns in 15 of 22 invested years. That consistency is what compounds $10,000 into $556,000.
When It Struggles
Broad-based rallies and momentum-driven years. The strategy lags when the Sensex rips higher on broad momentum and low-vol names can't keep up.
| Year | Low Vol + Quality | Sensex | Excess |
|---|---|---|---|
| 2003 | 0.0% (cash) | +79.1% | -79.1% |
| 2006 | +33.2% | +48.5% | -15.3% |
| 2007 | +32.0% | +46.8% | -14.8% |
| 2019 | +6.4% | +16.0% | -9.6% |
2003 was the worst relative year because the portfolio was still in cash (no qualifying stocks), while the Sensex surged 79.1% off the 2002 lows. 2006 and 2007 were broad-based Indian bull market years where high-beta names led and low-vol quality couldn't keep pace.
2019 saw the Sensex gain 16.0% driven by a narrow group of large-caps. The low-vol quality names, stable consumer staples and IT services, returned only 6.4%.
Early years (2000-2003) returned 0%. FMP coverage of Indian stocks was sparse before 2004. The strategy sat in cash because fewer than 10 stocks met the quality and market cap filters. The effective backtest starts around 2004. This drags the headline CAGR down versus the invested-period return.
Limitations
Returns are in INR. The Indian rupee depreciated roughly 60% against the USD over this period. International investors would see meaningfully lower dollar-denominated returns. Indian investors see the full 16.89% CAGR.
18 cash periods (17% of quarters). Most were in the early 2000s when data coverage was thin. The portfolio held an average of 29.9 stocks when invested, so the cash periods are a data coverage issue, not a strategy design flaw.
Max drawdown of -37.65% is significant. The strategy's worst drawdown came during 2008 when the portfolio fell 37.6%. That's better than the Sensex's -51.3% decline, but it still means losing more than a third of your capital. Holding through requires conviction.
India-specific risks. Regulatory changes (SEBI policy shifts), currency moves, and foreign institutional flow reversals can all hit the portfolio. These risks don't show up in backtested returns until they happen.
Part of a Series
Run It Yourself
Live screen:
python3 low-vol-quality/screen.py --preset india
Backtest:
python3 low-vol-quality/backtest.py --preset india --output results/returns_India.json --verbose
Code: github.com/ceta-research/backtests/tree/main/low-vol-quality
Takeaway
India produced the best results of any exchange we tested for low-vol quality. 16.89% CAGR, 0.579 Sharpe, 7.73% annual alpha over the Sensex. The portfolio captured 86.3% of up moves while absorbing only 37.1% of down moves, compounding that asymmetry over 25 years into a 5,461% total return.
The structural case is straightforward. India's quality universe is filled with domestically oriented consumer staples, private banks, IT services, and pharmaceutical companies. These businesses have stable cash flows, high margins, and limited correlation with global risk-off events. The low-vol filter picks the most stable of these already-stable names.
For INR-denominated investors, this is one of the strongest systematic strategies we've documented.
References
- Baker, M., Bradley, B. & Wurgler, J. (2011). "Benchmarks as Limits to Arbitrage: Understanding the Low-Volatility Anomaly." Financial Analysts Journal, 67(1), 40-54.
- Ang, A., Hodrick, R., Xing, Y. & Zhang, X. (2006). "The Cross-Section of Volatility and Expected Returns." Journal of Finance, 61(1), 259-299.
- Frazzini, A. & Pedersen, L. (2014). "Betting Against Beta." Journal of Financial Economics, 111(1), 1-25.
- Novy-Marx, R. (2013). "The Other Side of Value: The Gross Profitability Premium." Journal of Financial Economics, 108(1), 1-28.
Data: Ceta Research, 2000-2025. Full methodology: Methodology
Past performance does not guarantee future results. This is educational content, not investment advice.


