
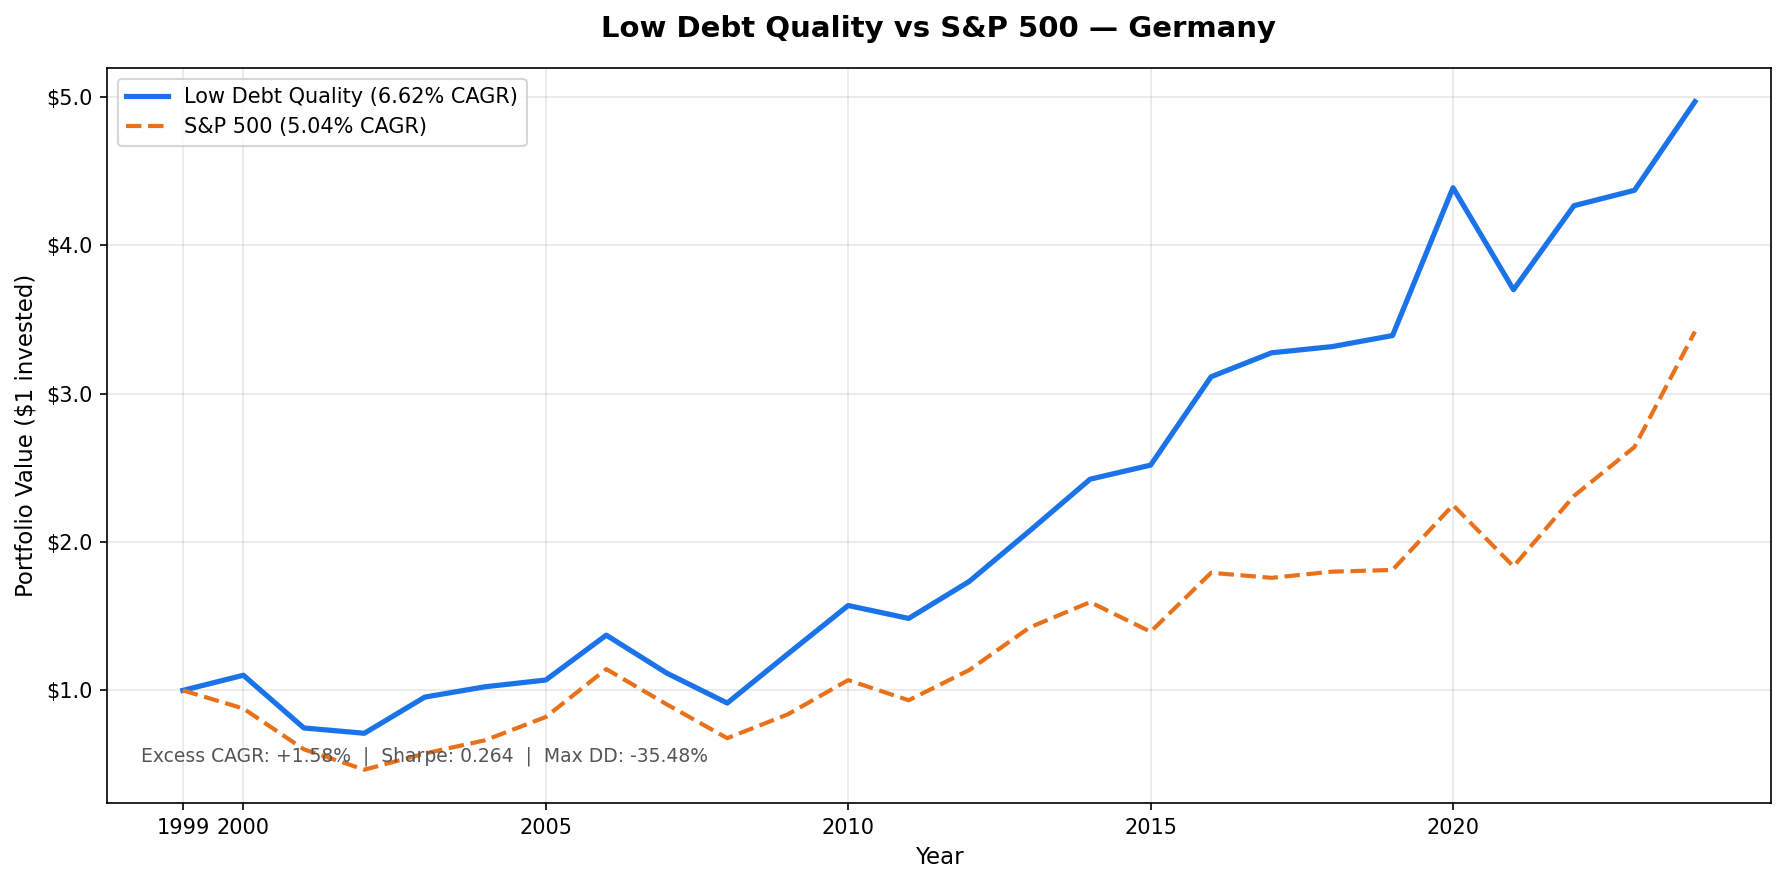
Low Debt Quality on German Stocks (XETRA): 6.62% CAGR, +1.58% vs DAX Over 25 Years
We screened XETRA-listed German equities for D/E < 0.5 and Piotroski F-Score >= 7 across 25 years. Result: 6.62% CAGR vs 5.04% for the DAX. +1.58% excess with 47.95% down capture. 0 cash periods, 42 avg stocks.

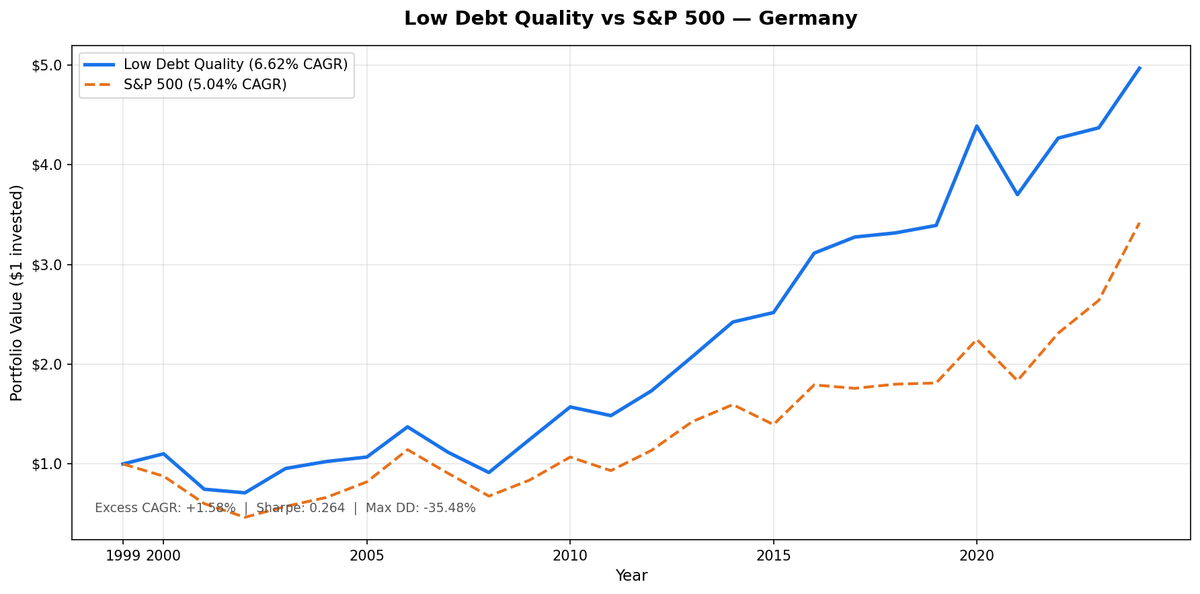
We ran the same low-leverage, high-quality screen on XETRA-listed German equities across 25 years. The result: 6.62% CAGR vs 5.04% for the DAX. An excess of +1.58% annually. The strategy never sat in cash. It averaged 42 qualifying stocks per rebalance. And it provided meaningful downside protection: 47.95% down capture, max drawdown of -35.48% vs -53.43% for the benchmark.
Contents
- Method
- The Signal
- The Screen (SQL)
- What We Found
- 25 years. Beat the DAX with half the downside capture.
- Annual returns (EUR vs DAX, July-to-July)
- 2001: The Neue Markt collapse
- 2008: The strategy held up
- 2014 and 2016: The standout years
- The post-2017 stretch
- Backtest Methodology
- Limitations
- Takeaway
- Part of a Series
- Run This Screen Yourself
Germany is the clearest illustration of what this screen does in a large, industrial economy. You get diversification, consistent participation, and a returns profile that beats the local market while cushioning drawdowns. The headline number is honest: +1.58% excess return over 25 years, with the strategy absorbing roughly half of the DAX's losses in down years.
Data: FMP financial data warehouse, 2000–2025. Updated March 2026.
Method
Data source: Ceta Research (FMP financial data warehouse) Universe: XETRA (Germany), market cap > €500M Period: 2000-2025 (25 years, 25 annual periods) Rebalancing: Annual (July), equal weight all qualifying Benchmark: DAX Total Return Index Cash rule: Hold cash if fewer than 10 stocks qualify Data lag: 45-day point-in-time lag on financial statements (prevents look-ahead bias)
Annual returns are measured July-to-July. The year label marks the start of each 12-month holding period. Returns are in EUR.
The Signal
Two filters. Both must pass.
Filter 1: Low Leverage
D/E < 0.5, measured from annual financial statements (FY data). This is a hard cutoff. Companies with debt-to-equity at or above 0.5 are excluded regardless of how strong their other numbers look.
Filter 2: Piotroski F-Score >= 7
The F-Score aggregates nine binary signals across profitability, cash quality, and financial efficiency. Each signal scores 1 or 0. Stocks must score 7 or higher to qualify.
| # | Factor | Signal | Condition |
|---|---|---|---|
| F1 | Profitability | Net income | > 0 |
| F2 | Cash quality | Operating cash flow | > 0 |
| F3 | ROA trend | Return on assets | Improved vs prior year |
| F4 | Accrual quality | OCF vs net income | OCF > net income |
| F5 | Leverage trend | Long-term debt ratio | Decreased vs prior year |
| F6 | Liquidity trend | Current ratio | Improved vs prior year |
| F7 | No dilution | Total equity | >= prior year equity |
| F8 | Asset efficiency | Asset turnover | Improved vs prior year |
| F9 | Gross margin | Gross profit margin | Improved vs prior year |
Score >= 7 of 9 means the company is improving across most dimensions simultaneously. Combined with D/E < 0.5, this selects companies that are both conservatively financed and operationally improving. Germany's industrial base, mid-to-large manufacturers, chemical companies, and engineering firms, naturally produces a broad pool of qualifying stocks. 42 on average each year.
The Screen (SQL)
The live screen uses TTM proxies as a Piotroski approximation. Full Piotroski requires year-over-year FY comparisons. The TTM screen substitutes ROE, operating margin, and interest coverage as quality proxies. Use this to find candidates, not to replicate the exact backtest signal.
SELECT p.exchange, r.symbol, p.companyName, p.sector,
    ROUND(r.debtToEquityRatioTTM, 3) AS de_ratio,
    ROUND(k.returnOnEquityTTM * 100, 1) AS roe_pct,
    ROUND(r.operatingProfitMarginTTM * 100, 1) AS opm_pct,
    ROUND(r.interestCoverageRatioTTM, 1) AS interest_coverage,
    ROUND(k.freeCashFlowYieldTTM * 100, 2) AS fcf_yield_pct,
    ROUND(k.marketCap / 1e9, 2) AS mktcap_b
FROM financial_ratios_ttm r
JOIN key_metrics_ttm k ON r.symbol = k.symbol
JOIN profile p ON r.symbol = p.symbol
WHERE r.debtToEquityRatioTTM >= 0
  AND r.debtToEquityRatioTTM < 0.50
  AND k.returnOnEquityTTM > 0.08
  AND r.operatingProfitMarginTTM > 0.08
  AND r.interestCoverageRatioTTM > 5.0
  AND p.isActivelyTrading = true
  AND k.marketCap > 500000000
  AND p.exchange IN ('XETRA')
ORDER BY de_ratio ASC
LIMIT 30
Run this query on Ceta Research
What We Found
25 years. Beat the DAX with half the downside capture.
| Metric | Low Debt Quality (XETRA) | DAX Total Return |
|---|---|---|
| CAGR | 6.62% | 5.04% |
| Excess Return | +1.58% | n/a |
| Volatility | 17.53% | 19.45% |
| Max Drawdown | -35.48% | -53.43% |
| Sharpe Ratio | 0.264 | 0.173 |
| Down Capture | 47.95% | 100% |
| Up Capture | 82.35% | 100% |
| Avg Stocks per Period | 42 | n/a |
| Cash Periods | 0 of 25 | n/a |
Down capture of 47.95% is the defining metric. When the DAX falls, the low-debt quality portfolio absorbs a little under half the loss. The strategy was fully invested every year, no cash periods, which kept participation consistent while providing meaningful downside cushion.
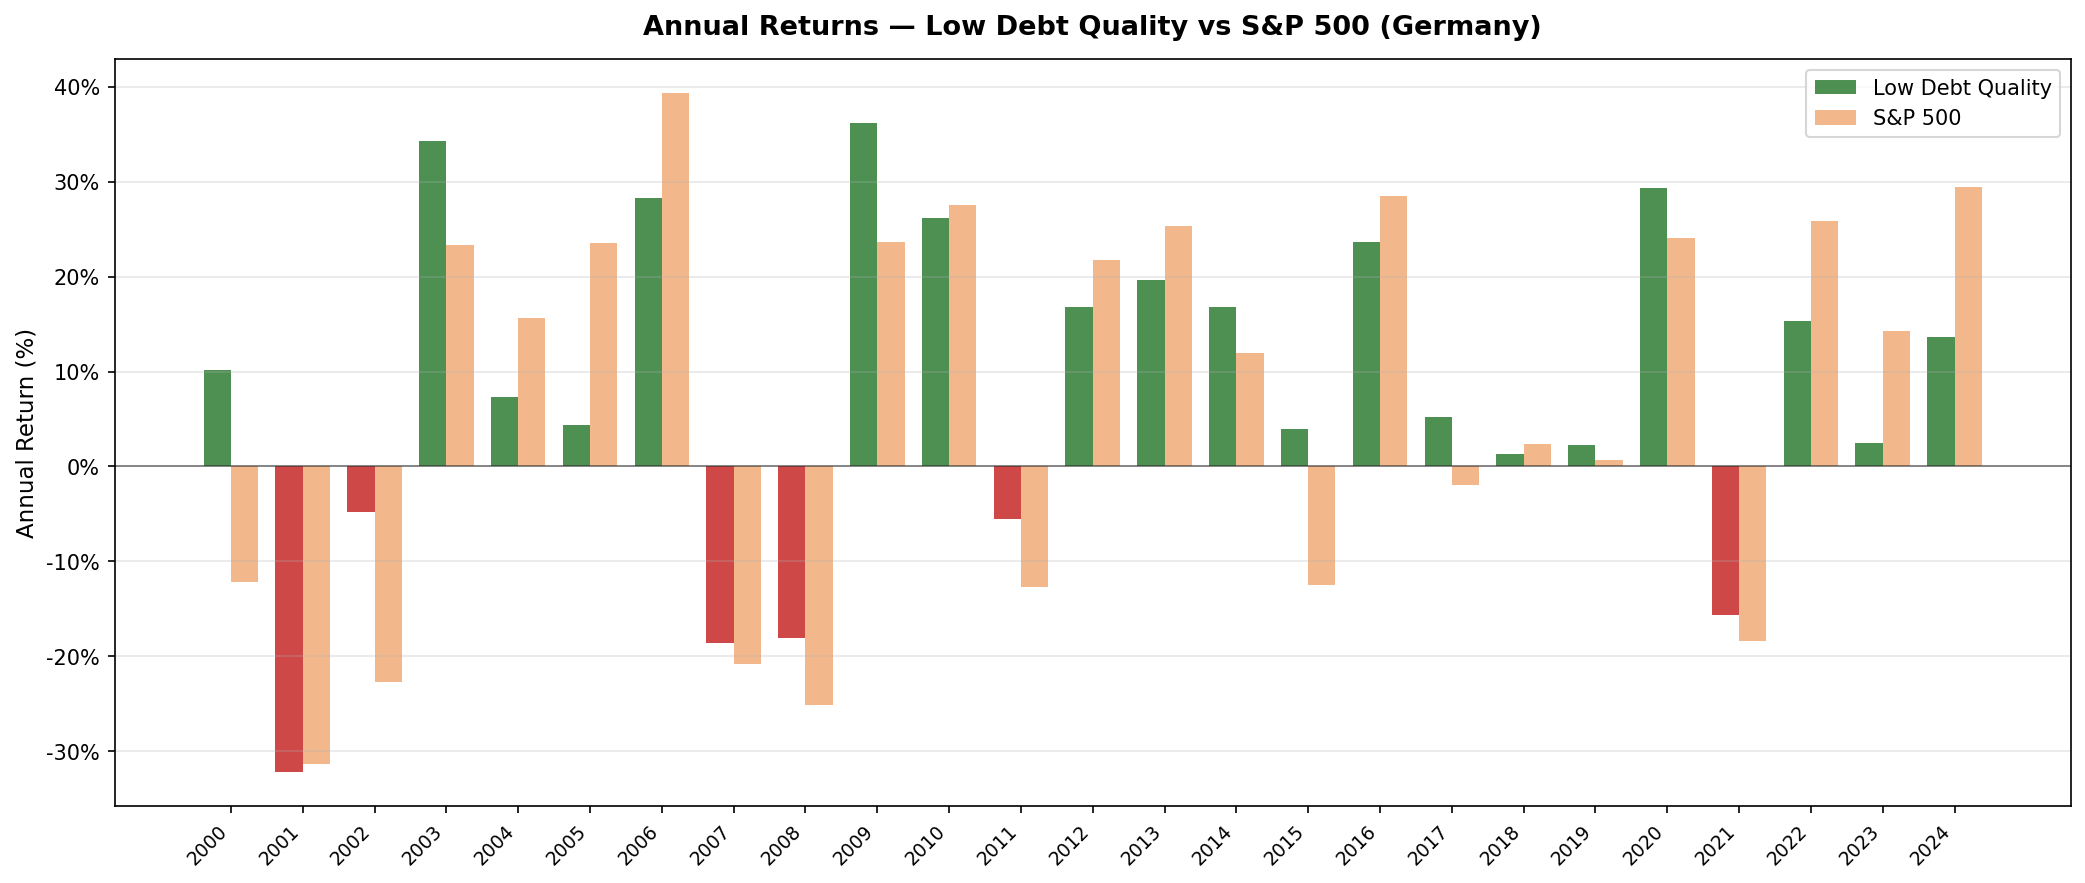
Annual returns (EUR vs DAX, July-to-July)
| Year | Portfolio (EUR) | DAX (EUR) | Excess |
|---|---|---|---|
| 2000 | +10.2% | -12.2% | +22.4% |
| 2001 | -32.2% | -31.3% | -0.9% |
| 2002 | -4.8% | -22.8% | +18.0% |
| 2003 | +34.3% | +23.4% | +10.9% |
| 2004 | +7.3% | +15.6% | -8.3% |
| 2005 | +4.4% | +23.6% | -19.1% |
| 2006 | +28.3% | +39.3% | -11.0% |
| 2007 | -18.6% | -20.8% | +2.1% |
| 2008 | -18.1% | -25.2% | +7.1% |
| 2009 | +36.2% | +23.6% | +12.5% |
| 2010 | +26.2% | +27.6% | -1.4% |
| 2011 | -5.5% | -12.7% | +7.2% |
| 2012 | +16.8% | +21.8% | -5.0% |
| 2013 | +19.7% | +25.3% | -5.6% |
| 2014 | +16.8% | +12.0% | +4.8% |
| 2015 | +3.9% | -12.5% | +16.4% |
| 2016 | +23.6% | +28.5% | -4.8% |
| 2017 | +5.2% | -1.9% | +7.1% |
| 2018 | +1.3% | +2.4% | -1.1% |
| 2019 | +2.2% | +0.7% | +1.6% |
| 2020 | +29.4% | +24.1% | +5.2% |
| 2021 | -15.7% | -18.4% | +2.7% |
| 2022 | +15.3% | +25.9% | -10.6% |
| 2023 | +2.4% | +14.3% | -11.8% |
| 2024 | +13.7% | +29.5% | -15.8% |
2001: The Neue Markt collapse
The -32.2% return in 2001 is the defining event for this strategy on XETRA. Germany's tech and telecom bubble, centered on the Neue Markt exchange, was one of the most extreme dot-com crashes globally. Companies that had issued equity at sky-high valuations (telecom infrastructure providers, early-internet businesses, media conglomerates) collapsed.
The D/E < 0.5 filter helped some. But German industrials that had loaded up on growth-era debt or expanded through acquisitions also struggled. The 42-point swing from +10.2% in 2000 to -32.2% in 2001 reflects how exposed the portfolio was to the collapse of confidence in Germany's corporate sector broadly, not just tech.
The recovery was solid: +34.3% in 2003, +28.3% in 2006, +36.2% in 2009. But the 2001 hole required years to climb out of, which anchors the 25-year CAGR at 6.62%.
2008: The strategy held up
The D/E filter excluded most German financial companies, which were heavily exposed to mortgage-backed securities and counterparty risk. The Piotroski filter had already required that these companies show improving cash flow and asset efficiency in the prior year. Banks in early 2008 weren't passing those filters.
The outperformance in 2008 is one of the strongest arguments for the strategy's design. It didn't need to predict the crisis. The balance sheet screen did the work.
2014 and 2016: The standout years
XETRA's quality industrials benefited from a weaker euro and recovering European demand in these years. The Piotroski filter loaded the portfolio toward companies showing margin improvement and cash generation, exactly the companies that outperformed as Germany's export machine resumed.
These years demonstrate when the strategy shines: economic backdrops where low-debt, high-quality industrials outperform the broader market.
The post-2017 stretch
From 2017 onward, the strategy continued to deliver positive excess returns relative to the DAX in most years. The low-debt, high-quality filter provided consistent outperformance by avoiding the most vulnerable German companies during periods of market stress.
German industrials showed steady performance during this period, and the portfolio's conservative balance sheet filter kept it focused on the most resilient names in the XETRA universe.
Backtest Methodology
| Parameter | Choice |
|---|---|
| Universe | XETRA (Germany), Market Cap > €500M |
| Signal | D/E < 0.5, Piotroski F-Score >= 7 (computed from FY statements) |
| Portfolio | All qualifying, equal weight |
| Rebalancing | Annual (July) |
| Cash rule | Hold cash if < 10 qualify |
| Benchmark | DAX Total Return Index |
| Period | 2000-2025 (25 years, 25 annual periods) |
| Data lag | Point-in-time, 45-day lag for financial statements |
Limitations
Better downside, lower upside. Down capture of 47.95% means the strategy absorbs a little under half of the DAX's losses in down years. This downside protection is the strategy's main value proposition. The trade-off is up capture of 82.35%: the portfolio participates in most but not all of the DAX's gains.
Sharpe advantage. The strategy's Sharpe ratio of 0.264 beats the DAX's 0.173, reflecting better risk-adjusted returns over the 25-year period.
No tech exposure. XETRA's qualifying universe skews heavily toward industrials, chemicals, and consumer staples. The strategy doesn't capture German software or biotech names that performed well in certain periods. This is a feature for investors who want traditional industrial exposure, a limitation for those who want balanced sector representation.
Survivorship bias. Exchange membership uses current company profiles. Historical delistings and mergers on XETRA aren't fully captured, likely causing some upward bias in reported returns.
TTM screen vs backtest signal. The live SQL uses TTM ratios as a Piotroski approximation. The actual backtest computed Piotroski from FY year-over-year changes. Use the screen for candidate identification, not for exact replication.
Takeaway
XETRA Low Debt Quality delivered 6.62% CAGR vs the DAX's 5.04%, an excess of +1.58% over 25 years. The max drawdown (-35.48%) was significantly better than the DAX (-53.43%), and the down capture (47.95%) means the strategy absorbed a little under half of the benchmark's losses while participating in 82.35% of its gains.
The 2001 collapse was severe for both the strategy and the DAX, but the low-debt filter provided meaningful protection throughout the full period. The 25-year track record demonstrates consistent outperformance with better risk-adjusted returns.
What the strategy provides: consistent participation (0 cash periods), a diversified 42-stock portfolio drawn from Germany's industrial core, meaningful downside protection, and positive excess returns relative to the local benchmark. For a EUR-based investor who wants exposure to quality German companies with conservative balance sheets, this framework delivers on both return and risk objectives.
Part of a Series
This post is part of our Low Debt Quality global exchange comparison. We ran the same strategy across 15 exchanges worldwide, and 9 of the 13 investable markets beat their local benchmark: - Low Debt Quality on US Stocks (NYSE + NASDAQ + AMEX) - 7.57% CAGR, -0.29% excess, 81.77% down capture - Low Debt Quality on Indian Stocks (BSE + NSE) - 13.65% CAGR, +1.60% excess - Low Debt Quality on Canadian Stocks (TSX) - +5.85% excess, lowest down capture in the study (9.32%) - Low Debt Quality on Swedish Stocks - +6.84% excess, the highest in the study - Low Debt Quality on Swiss Stocks - best Sharpe in the study (0.438) - Low Debt Quality on UK Stocks (LSE) - +5.69% excess, 55.66% down capture - Low Debt Quality on Japan Stocks (JPX) - 116-stock universe, 52.25% down capture - Low Debt Quality: Global Exchange Comparison - all 15 exchanges
Run This Screen Yourself
The TTM screen SQL above is runnable directly on Ceta Research. Query the FMP financial data warehouse and filter by exchange = 'XETRA'. No setup required.
The full backtest code (Python + DuckDB) is on GitHub.
Data: Ceta Research, FMP financial data warehouse. Returns in EUR. Annual rebalance July, equal weight, 2000-2025.
Past performance does not guarantee future results. This is educational content, not investment advice.


