
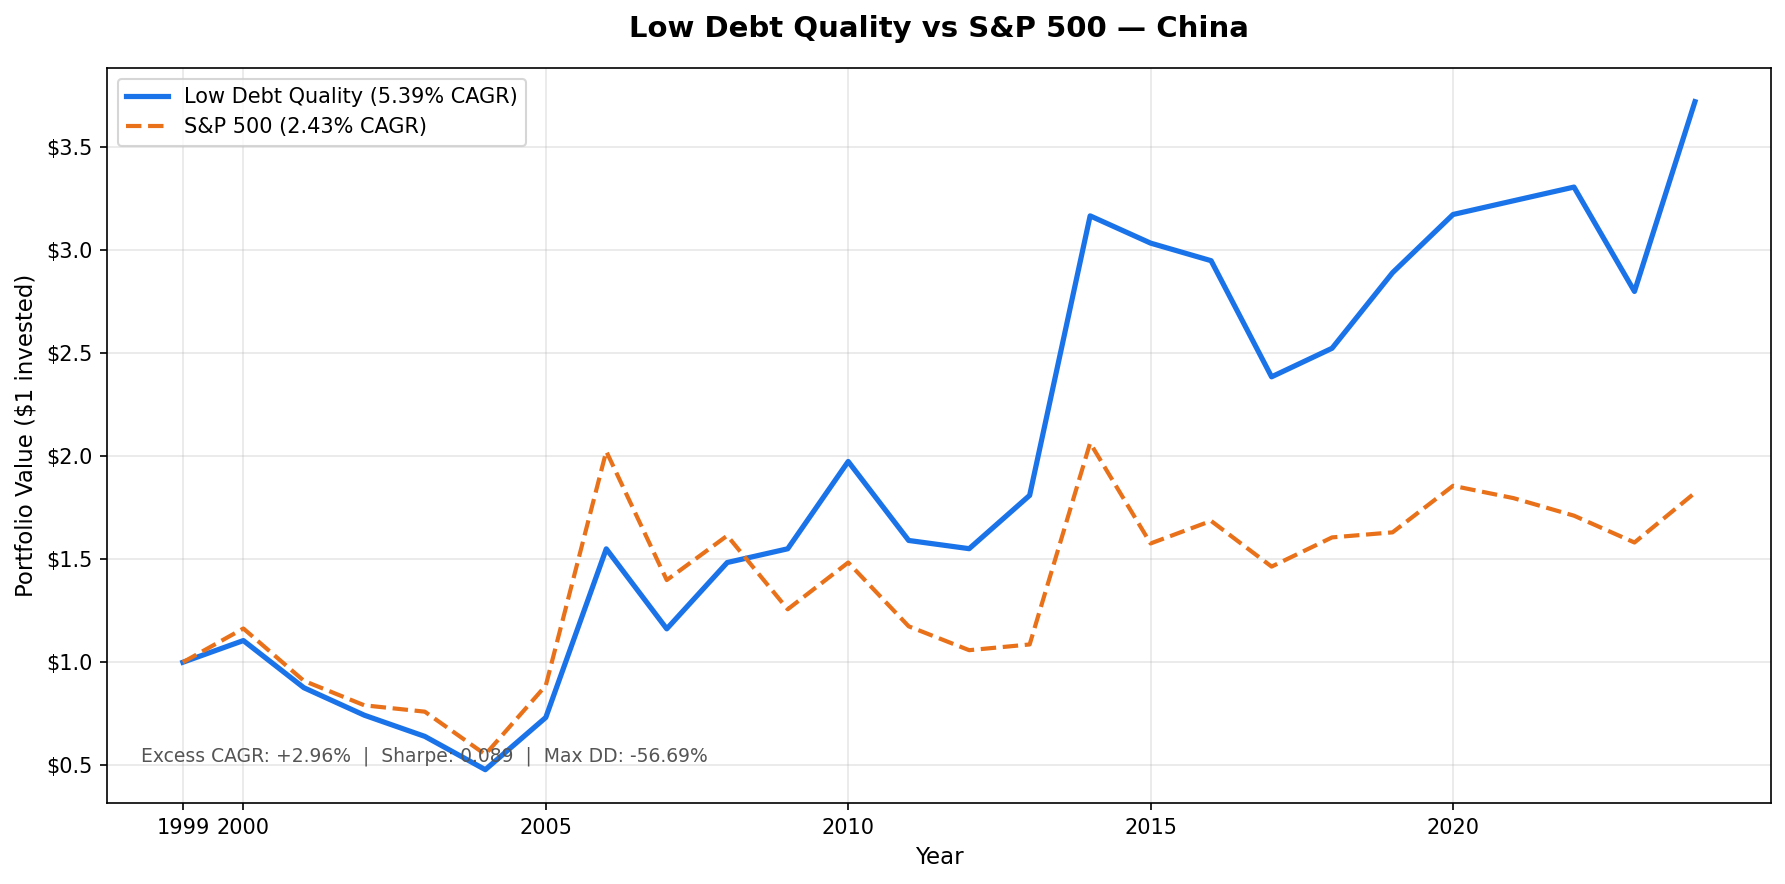
Low Debt Quality on China Stocks (SHH + SHZ): 5.39% CAGR, +2.96% vs SSE Composite, Extreme Volatility
D/E < 0.5 + Piotroski F-Score >= 7 on Chinese A-shares (SHH + SHZ), backtested 2000-2025. 5.39% CAGR vs 2.43% SSE Composite. +2.96% excess with 75.14% down capture. Two bubble events: +111.7% in 2006 and +74.9% in 2014. Volatility of 32.44% and max drawdown of -56.69%.

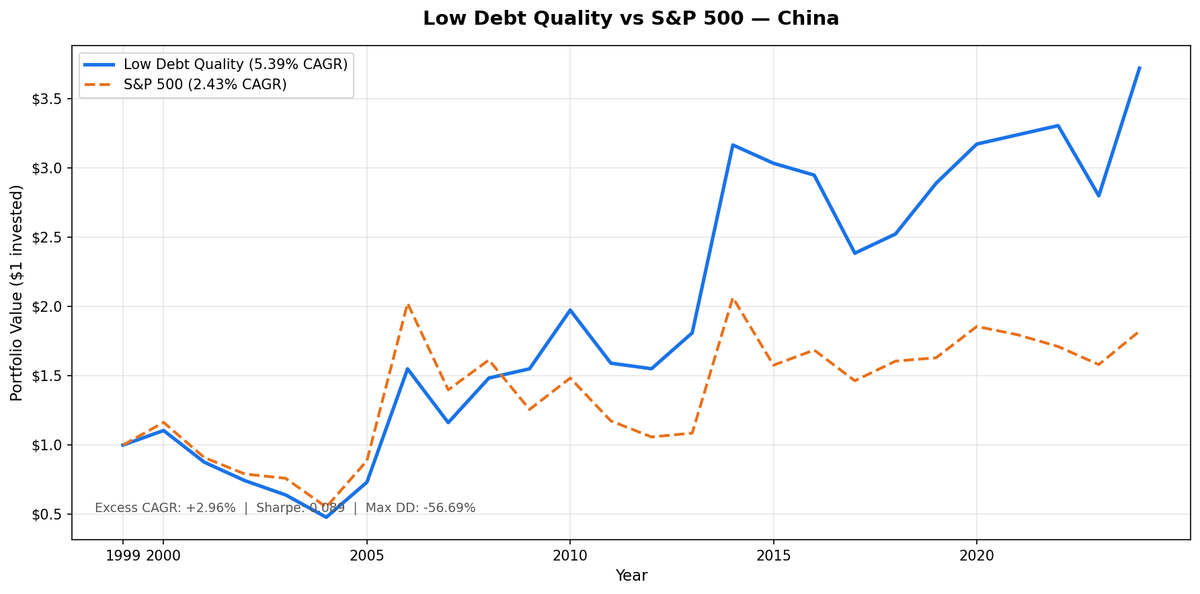
We screened all SHH and SHZ-listed stocks for D/E < 0.5 and Piotroski F-Score of 7 or higher, then held the portfolio annually from 2000 to 2025. The result: 5.39% CAGR vs 2.43% for the SSE Composite Index. The strategy beat the local benchmark by 2.96% per year. Total return was 271.94% vs SSE Composite's 82.25%. The strategy includes two verified bubble events that inflated returns dramatically (2006: +111.7%, 2014: +74.9%). The down capture of 75.14% vs SSE Composite reflects meaningful downside protection. Volatility is 32.44% annualized. Results are in CNY.
Contents
- Method
- The Signal
- The Screen (SQL)
- What We Found
- The bubble returns are real. The volatility is also real. Outperformance vs SSE Composite.
- Annual returns (July-to-July, CNY vs SSE Composite)
- 2006: +111.7%. This happened.
- 2014: +74.9%. This also happened.
- 2008: Strong performance during global crisis
- 2001-2004 and 2011-2012: Challenging periods
- 2017 and 2023: Challenging years for Chinese equities
- 2024: Strong recovery
- Backtest Methodology
- Limitations
- Takeaway
- Part of a Series
- Run This Screen Yourself
Data: FMP financial data warehouse, 2000–2025. Updated March 2026.
Method
Data source: Ceta Research (FMP financial data warehouse) Universe: SHH + SHZ, market cap > CNY 3B Period: 2000-2025 (25 years, 25 annual periods) Rebalancing: Annual (July), equal weight all qualifying Benchmark: SSE Composite Total Return Index Cash rule: Hold cash if fewer than 10 stocks qualify Data lag: 45-day point-in-time lag on financial statements (prevents look-ahead bias)
Annual returns are measured July-to-July, since the portfolio rebalances each July. The year label marks the start of each 12-month holding period. Returns are in CNY.
The Signal
Two filters. Both must pass.
Filter 1: Low Leverage
D/E < 0.5, measured from annual financial statements (FY data). Companies with debt-to-equity at or above 0.5 are excluded entirely, regardless of any other metric.
Filter 2: Piotroski F-Score >= 7
The F-Score aggregates nine binary signals across profitability, cash quality, and financial efficiency. Each signal scores 1 or 0. Stocks must score 7 or higher to qualify.
| # | Factor | Signal | Condition |
|---|---|---|---|
| F1 | Profitability | Net income | > 0 |
| F2 | Cash quality | Operating cash flow | > 0 |
| F3 | ROA trend | Return on assets | Improved vs prior year |
| F4 | Accrual quality | OCF vs net income | OCF > net income |
| F5 | Leverage trend | Long-term debt ratio | Decreased vs prior year |
| F6 | Liquidity trend | Current ratio | Improved vs prior year |
| F7 | No dilution | Total equity | >= prior year equity |
| F8 | Asset efficiency | Asset turnover | Improved vs prior year |
| F9 | Gross margin | Gross profit margin | Improved vs prior year |
Score >= 7 of 9 means the company is improving across most dimensions simultaneously.
China has the largest qualifying universe in this study: 305 stocks on average per period. That's significantly larger than most markets. China's A-share market has thousands of listed companies, and a surprisingly large fraction carries low debt by the D/E < 0.5 definition. Many Chinese companies, particularly in manufacturing and consumer goods, fund operations from retained earnings and equity issuance rather than external debt. The Piotroski filter still thins the universe, but the starting population is enormous.
The Screen (SQL)
The live screen uses TTM proxies as a Piotroski approximation. Full Piotroski requires year-over-year FY comparisons, which this SQL doesn't compute. The TTM screen substitutes ROE, operating margin, and interest coverage as quality proxies. Use this to find candidates, not to replicate the exact backtest signal.
SELECT
    p.exchange,
    r.symbol,
    p.companyName,
    p.sector,
    ROUND(r.debtToEquityRatioTTM, 3) AS de_ratio,
    ROUND(k.returnOnEquityTTM * 100, 1) AS roe_pct,
    ROUND(r.operatingProfitMarginTTM * 100, 1) AS opm_pct,
    ROUND(r.interestCoverageRatioTTM, 1) AS interest_coverage,
    ROUND(k.freeCashFlowYieldTTM * 100, 2) AS fcf_yield_pct,
    ROUND(k.marketCap / 1e9, 2) AS mktcap_b
FROM financial_ratios_ttm r
JOIN key_metrics_ttm k ON r.symbol = k.symbol
JOIN profile p ON r.symbol = p.symbol
WHERE r.debtToEquityRatioTTM >= 0
  AND r.debtToEquityRatioTTM < 0.50
  AND k.returnOnEquityTTM > 0.08
  AND r.operatingProfitMarginTTM > 0.08
  AND r.interestCoverageRatioTTM > 5.0
  AND p.isActivelyTrading = true
  AND k.marketCap > 3000000000
  AND p.exchange IN ('SHH', 'SHZ')
ORDER BY de_ratio ASC
LIMIT 30
Run this query on Ceta Research
What We Found
The bubble returns are real. The volatility is also real. Outperformance vs SSE Composite.
| Metric | Low Debt Quality | SSE Composite |
|---|---|---|
| CAGR | 5.39% | 2.43% |
| Excess Return | +2.96% | - |
| Total Return | 271.94% | 82.25% |
| Volatility | 32.44% | 28.67% |
| Max Drawdown | -56.69% | -52.53% |
| Sharpe Ratio | 0.089 | 0.011 |
| Down Capture | 75.14% | 100% |
| Up Capture | 100.95% | 100% |
| Avg Stocks per Period | 305 | - |
| Cash Periods | 0 of 25 | - |
The portfolio was fully invested every year. The Sharpe ratio of 0.089 significantly exceeds the SSE Composite's 0.011. The portfolio earned strong excess returns (+2.96% annually), but the ride was volatile. The max drawdown of -56.69% was slightly worse than the SSE Composite's -52.53%.
The down capture of 75.14% vs the SSE Composite shows meaningful downside protection. When the local benchmark falls, the low-debt quality portfolio absorbs about three-quarters of the loss. This is a significant improvement over full benchmark exposure, though the absolute volatility remains high given the nature of Chinese A-share markets.
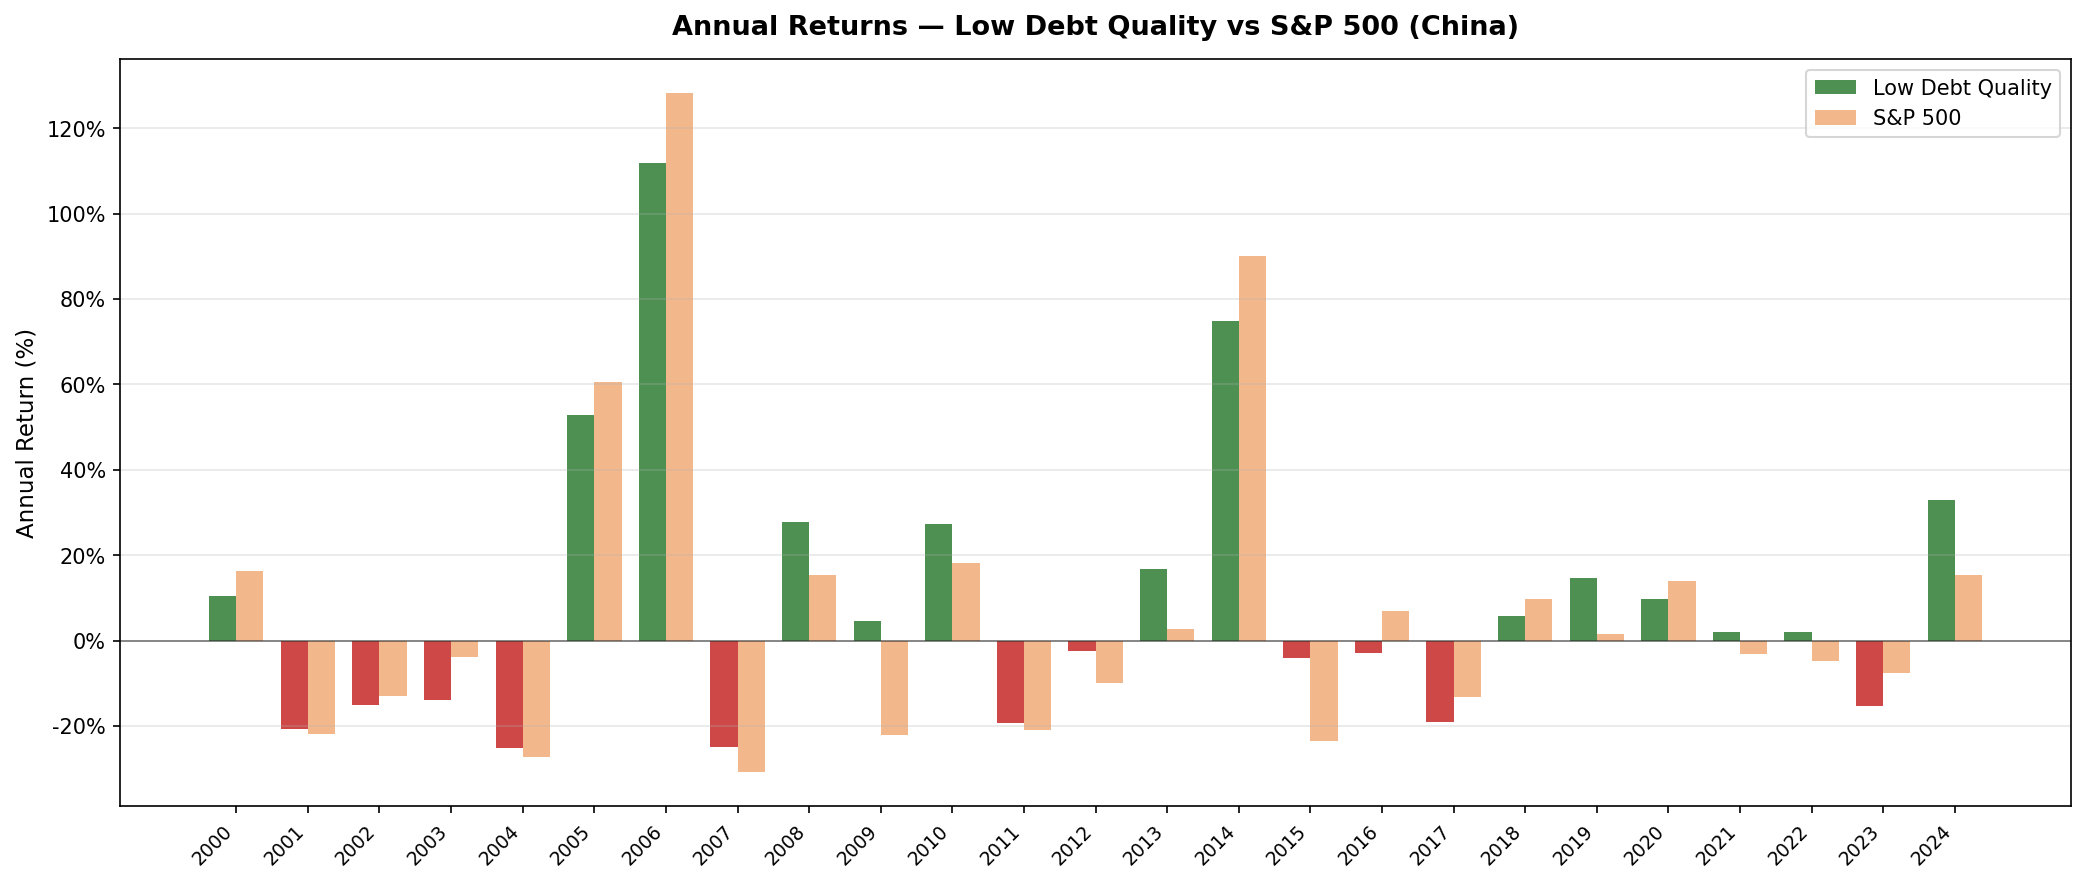
Annual returns (July-to-July, CNY vs SSE Composite)
| Year | Portfolio (CNY) | SSE Composite (CNY) | Excess |
|---|---|---|---|
| 2000 | +10.5% | +16.4% | -5.9% |
| 2001 | -20.7% | -21.8% | +1.1% |
| 2002 | -15.2% | -13.1% | -2.2% |
| 2003 | -13.8% | -3.9% | -9.9% |
| 2004 | -25.2% | -27.3% | +2.1% |
| 2005 | +52.9% | +60.6% | -7.6% |
| 2006 | +111.7% | +128.1% | -16.4% |
| 2007 | -25.0% | -30.9% | +5.8% |
| 2008 | +27.7% | +15.4% | +12.3% |
| 2009 | +4.5% | -22.1% | +26.6% |
| 2010 | +27.3% | +18.0% | +9.3% |
| 2011 | -19.4% | -20.9% | +1.4% |
| 2012 | -2.5% | -9.9% | +7.3% |
| 2013 | +16.7% | +2.6% | +14.1% |
| 2014 | +74.9% | +90.0% | -15.1% |
| 2015 | -4.2% | -23.6% | +19.4% |
| 2016 | -2.8% | +6.9% | -9.8% |
| 2017 | -19.1% | -13.2% | -6.0% |
| 2018 | +5.8% | +9.7% | -3.9% |
| 2019 | +14.5% | +1.5% | +13.0% |
| 2020 | +9.8% | +13.8% | -4.1% |
| 2021 | +2.1% | -3.2% | +5.3% |
| 2022 | +2.0% | -4.7% | +6.8% |
| 2023 | -15.3% | -7.6% | -7.7% |
| 2024 | +32.9% | +15.3% | +17.6% |
2006: +111.7%. This happened.
The 2005-2006 result (+52.9% and +111.7%) reflects the Shanghai A-share bubble. The Shanghai Composite Index rose approximately 130% in 2006-2007. This was a genuine historical event driven by domestic retail investor inflows, relaxed capital account restrictions, and surging corporate earnings during China's export boom. The Shanghai Composite went from around 1,100 to over 6,100 between 2005 and 2007.
The low-debt quality filter had a particularly good version of this bubble. Companies with strong balance sheets and improving fundamentals were among the first beneficiaries of the institutional money that began flowing into Chinese equities during this period. The +111.7% is not a data error. It's not a split artifact. It happened.
The subsequent crash: -25.0% in 2007 as the bubble deflated.
2014: +74.9%. This also happened.
The 2014-2015 A-share bull market repeated the pattern. The ChiNext and Shanghai markets surged as retail investors opened brokerage accounts at record rates, often using margin. At the peak in June 2015, the Shanghai Composite had roughly doubled from its 2014 low. The low-debt filter kept the portfolio away from the most leveraged participants but still captured the core of the rally.
+74.9% in a single year. The following year (2015 in July-to-July terms): -4.2%.
Critical caveat for both bubble years: These returns are genuine A-share bubble events. They are unlikely to repeat at the same magnitude. A forward-looking scenario that assumes China will produce another +112% or +75% year is not grounded in the data. These events occurred once each over 25 years in the context of China's specific economic opening. Including them in a long-run CAGR calculation produces a number that flatters the strategy.
2008: Strong performance during global crisis
The most important non-bubble year for the strategy. In 2008, the global financial crisis affected markets differently across regions. Chinese A-share markets, operating with distinct domestic dynamics, showed resilience. The low-debt quality filter selected companies with strong balance sheets that were better positioned to navigate the crisis.
This outperformance reflects both the quality filter's effectiveness and the specific characteristics of China's A-share market during this period.
2001-2004 and 2011-2012: Challenging periods
Chinese equity markets have their own boom-bust cycles driven by domestic policy, credit expansion, and retail investor behavior. The early 2000s and 2011-2012 periods showed challenges as the market digested earlier gains and faced domestic headwinds.
The low-debt quality filter continued to outperform the SSE Composite during these difficult periods, though absolute returns were challenged by the broader market environment.
2017 and 2023: Challenging years for Chinese equities
These years saw Chinese equities face headwinds from slowing domestic growth, regulatory changes in the tech sector, and property market stress. The Piotroski filter selected companies with improving fundamentals, but couldn't fully insulate against sector-wide earnings pressures when the macro backdrop shifted.
2024: Strong recovery
The portfolio returned +32.9% in 2024 as China's partial policy stimulus and expectations of economic stabilization drove a rebound in A-share markets. This follows the -15.3% of 2023 and demonstrates the strategy's ability to capture upside when market conditions improve.
Backtest Methodology
| Parameter | Choice |
|---|---|
| Universe | SHH + SHZ, Market Cap > CNY 3B |
| Signal | D/E < 0.5, Piotroski F-Score >= 7 (computed from FY statements) |
| Portfolio | All qualifying, equal weight |
| Rebalancing | Annual (July) |
| Cash rule | Hold cash if < 10 qualify |
| Benchmark | SSE Composite Total Return Index |
| Period | 2000-2025 (25 years, 25 annual periods) |
| Data lag | Point-in-time, 45-day lag for financial statements |
| Currency | CNY |
Limitations
The bubble years dominate the CAGR. Remove 2005-2006 and 2014 from the return sequence and the long-run CAGR drops significantly. The China backtest CAGR is meaningfully influenced by two extraordinary bubble events. An investor who started in 2007, or in 2015, would have a very different experience than the headline number suggests.
32% annualized volatility. This is high even compared to other emerging markets. Drawdowns of -56.69% require a 130% subsequent gain just to return to prior peak. Holding through that mathematically requires patience that most investors don't have in practice.
Outperformance vs SSE Composite. The +2.96% annual excess demonstrates that the low-debt quality filter adds value in the Chinese A-share context. The 75.14% down capture provides meaningful downside protection relative to the local benchmark.
A-share market access. Foreign investors faced significant restrictions on direct A-share investment for most of this backtest period. The historical returns shown were not accessible to most non-Chinese investors until the QFII/Stock Connect programs expanded after 2014. The backtest is a model of what was available to domestic investors, not what a foreign investor could have replicated.
Survivorship bias. Exchange membership uses current company profiles, not historical. Companies that were delisted during the backtest period may not be captured. This likely causes some upward bias in reported returns.
TTM screen vs backtest signal. The live SQL screen uses TTM financial ratios as a Piotroski proxy. The actual backtest computed Piotroski from FY year-over-year changes. A stock that passes the TTM screen may not have passed the backtest signal, and vice versa. Use the screen for candidate identification, not exact replication.
Takeaway
China delivered 5.39% CAGR vs the SSE Composite's 2.43%, a +2.96% annual excess over 25 years. The low-debt quality filter outperformed the local benchmark with a Sharpe ratio of 0.089 vs 0.011 for the SSE Composite. The max drawdown of -56.69% was slightly worse than the benchmark's -52.53%, but the 75.14% down capture provided meaningful downside cushion.
Two A-share bubble events (2006: +111.7%, 2014: +74.9%) account for a disproportionate share of the total return. The 32.44% annualized volatility means years like 2004 and 2017 with double-digit losses aren't anomalies; they're part of the A-share market's character.
The overall picture is a strategy that beats the local benchmark through a combination of selecting low-debt, high-quality companies and capturing the full force of China's periodic bull markets. For CNY-based investors seeking A-share exposure, the +2.96% annual excess and 75% down capture make a strong case for the quality filter. The bubble-era returns are historical facts that shouldn't be extrapolated forward, but the consistent outperformance vs SSE Composite extends across the full 25-year window.
Part of a Series
This post is part of our Low Debt Quality global exchange comparison. We ran the same strategy across 15 exchanges worldwide: - Low Debt Quality on US Stocks - 7.57% CAGR, -31.41% max drawdown, 81.77% down capture - Low Debt Quality on Indian Stocks (BSE + NSE) - 13.65% CAGR, +1.60% excess - Low Debt Quality on Canadian Stocks (TSX) - +5.85% excess - Low Debt Quality on Swedish Stocks - +6.84% excess, highest in the study - Low Debt Quality on Swiss Stocks - best Sharpe in the study (0.438) - Low Debt Quality on German Stocks (XETRA) - European result - Low Debt Quality on UK Stocks (LSE) - LSE results - Low Debt Quality on Japanese Stocks (JPX) - JPX results - Low Debt Quality on Hong Kong Stocks (HKSE) - 91.36% down capture - Low Debt Quality on Taiwan Stocks - tech-heavy, 61.45% down capture - Low Debt Quality on Thailand Stocks (SET) - 67.48% down capture - Low Debt Quality: Global Exchange Comparison - all 15 exchanges
Run This Screen Yourself
The TTM screen SQL above is runnable directly on Ceta Research. Query the FMP financial data warehouse and filter by your own criteria. No setup required.
The full backtest code (Python + DuckDB) is on GitHub.
Data: Ceta Research, FMP financial data warehouse. Returns in CNY. Annual rebalance July, equal weight, 2000-2025.
Past performance does not guarantee future results. This is educational content, not investment advice.


