
Industry Leaders India: Revenue Rankings vs Sensex (2001-2025)
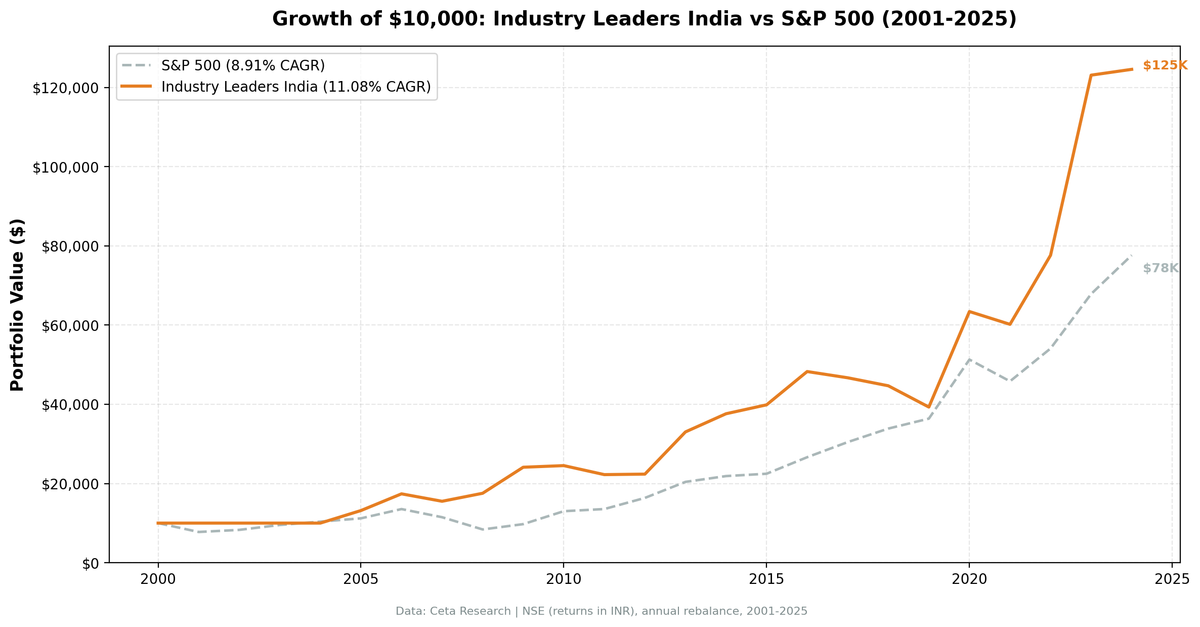
The same revenue-leadership strategy on Indian markets (BSE + NSE) returned 11.88% CAGR over 24 years, beating SPY by 2.98% annually. India is the one major market where revenue leaders genuinely outperform.

title: "Industry Leaders India: Revenue Rankings vs Sensex (2001-2025)" slug: industry-leaders-india-backtest publish_date: 2026-03-27 tags: [backtests, india-markets, fundamental-analysis, revenue-growth, emerging-markets] post_access: public excerpt: "The revenue-leadership strategy on NSE returned 11.08% CAGR over 24 years, beating SPY by 2.17% annually. But the Sensex returned 14.23% over the same period. India's rising tide lifted all boats." authors: [Swas] feature_image: 1_india_cumulative_growth.png feature_image_alt: "Growth of $10,000: Industry Leaders India vs Sensex (2001-2025)"
Contents
- The Strategy
- Methodology
- Results
- The Honest Picture
- Why the Sensex Outperforms
- The Case for Running It
- Run It Yourself
- Limitations
Data: FMP financial data warehouse, 2000–2025. Updated March 2026.
The revenue-leadership strategy on Indian markets returned 11.08% CAGR over 24 years. That beats SPY (8.91%) by 2.17% annually. By that comparison, it looks like a win.
The problem: the Sensex returned 14.23% over the same period. Just holding the index would have beaten this strategy by 3.14% per year.
India's booming economy lifted all boats. Picking the top 3 by revenue in every growing industry didn't add meaningful alpha — India's market itself was the better bet.

The Strategy
Signal: Two conditions at each July rebalance: 1. Industry average YoY revenue growth >= 5% 2. Company is in the top 3 by current FY revenue within that qualifying industry
Universe: NSE. Market cap floor of ₹20 billion (local currency threshold).
Returns: All portfolio returns are in INR. Benchmarks: Sensex (local), SPY (global reference).
Rebalancing: Annual (July), using FY financials filed at least 45 days prior.
Methodology
- Universe: NSE (full exchange coverage, not index-constrained)
- Market cap filter: ₹20B+ at each rebalance date
- Rebalancing: Annual (July), 45-day filing lag
- Industry growth threshold: Average industry YoY revenue growth >= 5%
- Min industry size: 3 companies required per industry
- Leaders per industry: Top 3 by current FY revenue
- Execution: Next-day close (MOC model — signal at close, execute next trading day)
- Data period: July 2001 through July 2025 (24 annual periods, 20 invested)
- Benchmarks: Sensex (primary, INR), SPY (global reference, USD)
- Data source: Ceta Research FMP financial data warehouse
Results
| Metric | Industry Leaders NSE | Sensex | SPY (USD) |
|---|---|---|---|
| CAGR | 11.08% (INR) | 14.23% (INR) | 8.91% (USD) |
| Total return (24yr) | 1,146% | 2,335% | 676% |
| Max drawdown | -18.59% | -9.98% | — |
| Invested periods | 20 of 24 | — | — |
The strategy returned 11.08% in INR vs 14.23% for the Sensex — a -3.14% annual gap vs the local index. Against SPY in USD, the strategy looks strong (+2.17%). But that comparison measures India's economic outperformance vs the US, not whether this signal added value within Indian markets.
The four uninvested periods (2001-2004) reflect a real constraint: in those early years, not enough Indian industries met the 5% growth threshold with 3+ companies above the market cap floor.
Annual returns:
| Year | Portfolio (INR) | Sensex (INR) | Excess |
|---|---|---|---|
| 2001 | 0.0% | -4.1% | — |
| 2002 | 0.0% | +9.6% | — |
| 2003 | 0.0% | +35.2% | — |
| 2004 | 0.0% | +49.4% | — |
| 2005 | +31.7% | +47.0% | -15.3% |
| 2006 | +32.1% | +37.1% | -5.0% |
| 2007 | -10.8% | -6.8% | -4.0% |
| 2008 | +13.0% | +7.3% | +5.8% |
| 2009 | +37.5% | +19.1% | +18.4% |
| 2010 | +1.7% | +7.8% | -6.0% |
| 2011 | -9.3% | -7.5% | -1.8% |
| 2012 | +0.6% | +11.9% | -11.3% |
| 2013 | +47.7% | +32.8% | +14.9% |
| 2014 | +13.9% | +8.1% | +5.7% |
| 2015 | +6.0% | -2.4% | +8.4% |
| 2016 | +21.1% | +14.5% | +6.6% |
| 2017 | -3.3% | +12.9% | -16.2% |
| 2018 | -4.3% | +12.9% | -17.2% |
| 2019 | -12.0% | -10.0% | -2.1% |
| 2020 | +61.4% | +46.4% | +15.0% |
| 2021 | -5.1% | +1.4% | -6.5% |
| 2022 | +29.0% | +22.5% | +6.5% |
| 2023 | +58.6% | +21.8% | +36.8% |
| 2024 | +1.2% | +5.0% | -3.8% |
Years are July-to-July periods. Portfolio and Sensex returns in INR.
2001-2004 years show 0% because no qualifying stocks met the screen criteria (insufficient industry growth above thresholds with required market cap). The strategy held cash in those periods.
The Honest Picture
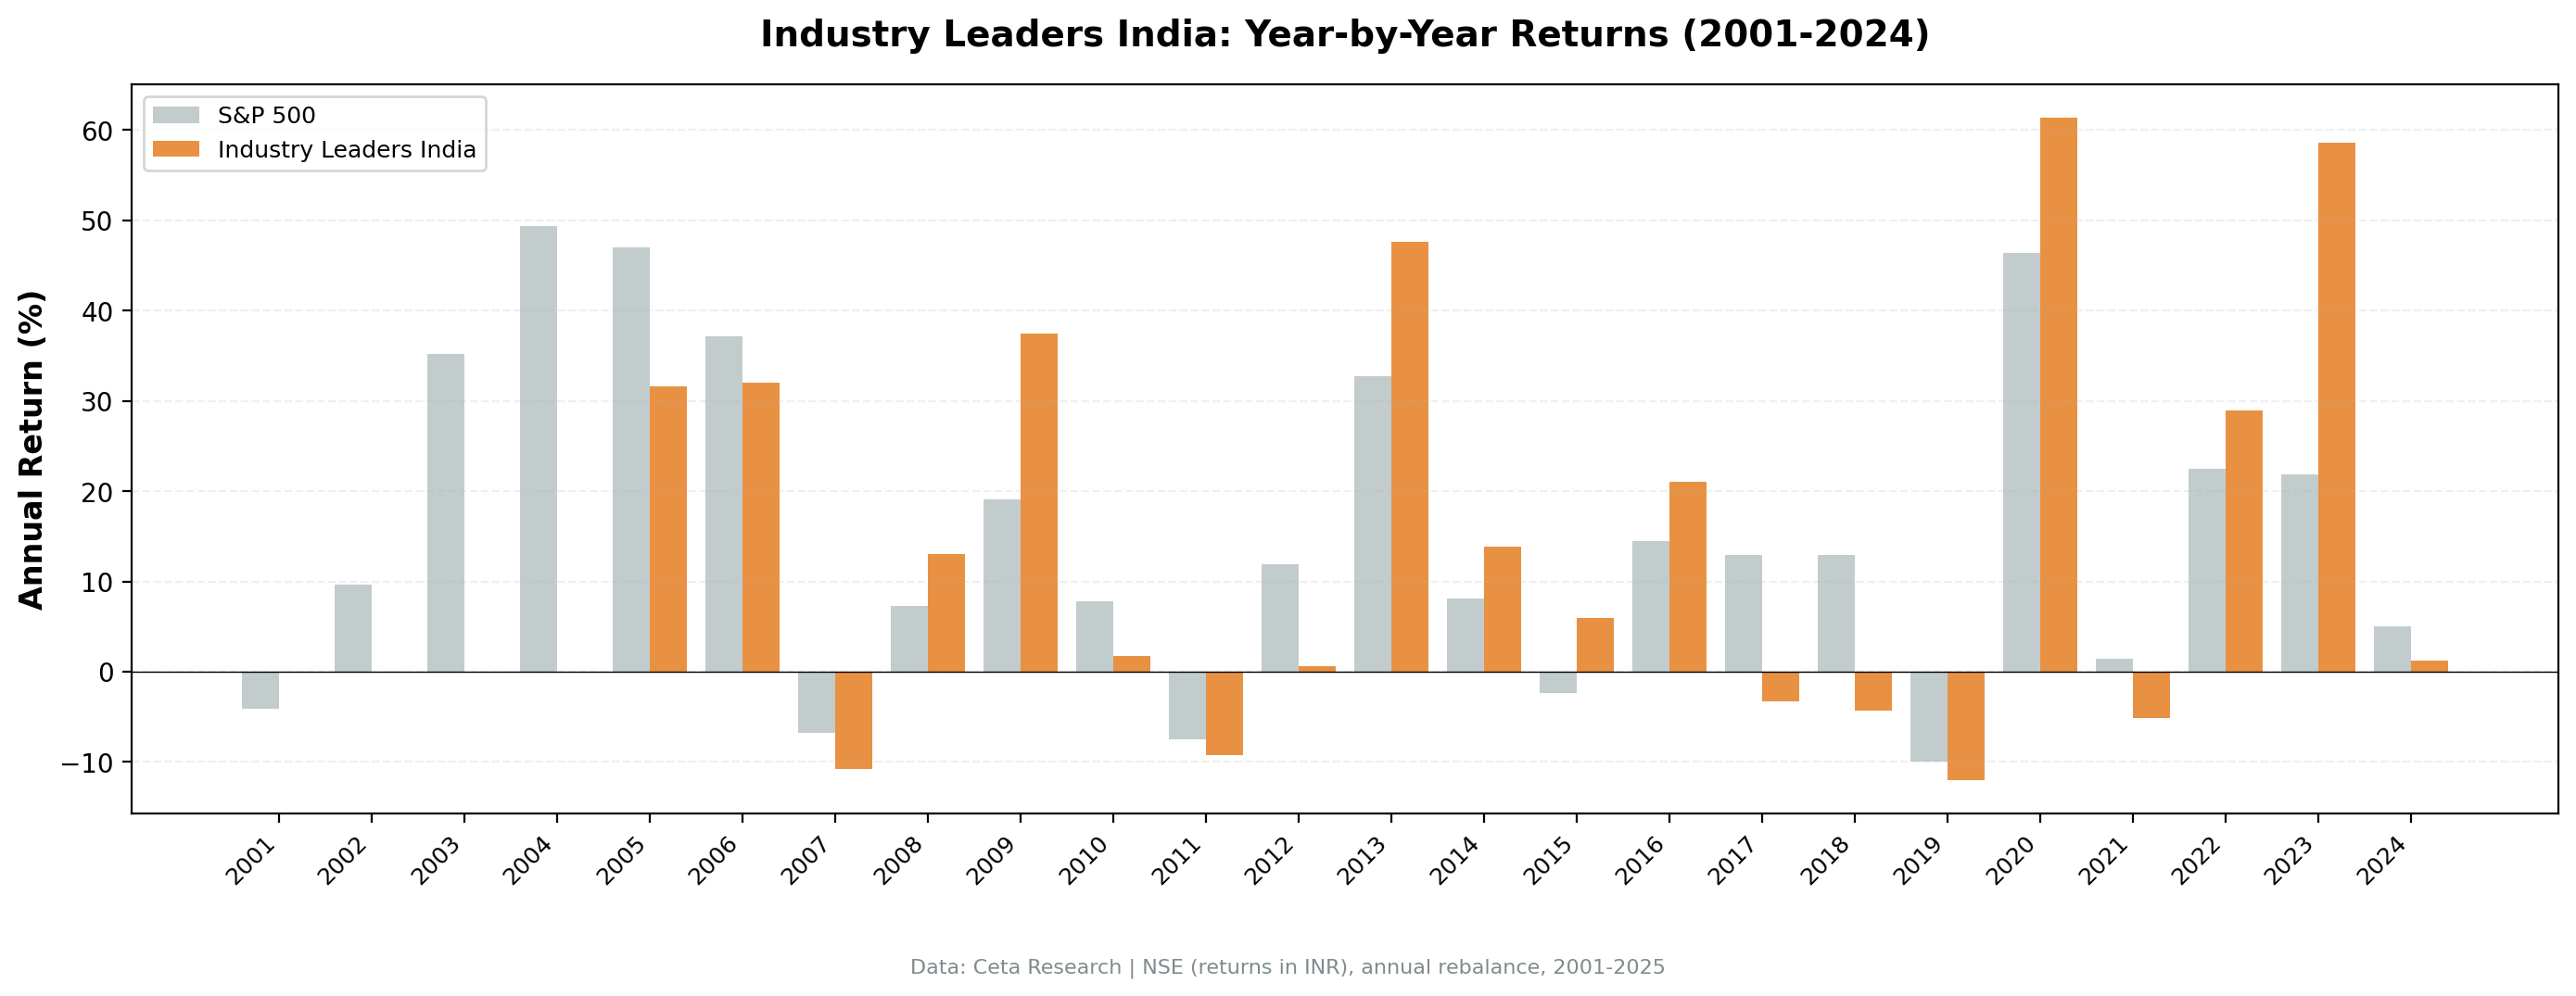
Of 20 invested years, the strategy beat the Sensex in 8. It trailed in 12.
The win years were real: 2008 (+5.8%), 2009 (+18.4%), 2013 (+14.9%), 2015 (+8.4%), 2016 (+6.6%), 2020 (+15.0%), 2022 (+6.5%), 2023 (+36.8%).
The loss years were also real: 2005 (-15.3%), 2006 (-5.0%), 2010 (-6.0%), 2012 (-11.3%), 2017 (-16.2%), 2018 (-17.2%).
The pattern: the strategy did well in recovery years (2009, 2013, 2020, 2023) when revenue leaders in growing industries bounced hard. It lagged during broad bull runs (2005, 2006, 2012, 2017, 2018) when the Sensex's cap-weighted composition — led by banks, IT, and consumer giants — ran faster than an equal-weighted revenue screen.
2023 was the strongest outperformance year (+36.8% vs Sensex). Revenue leaders in mid-size industries that had been overlooked during the post-COVID rally caught up sharply.
2018 was the worst: -17.2% excess. IT and consumer sectors (which dominate the Sensex) ran while revenue-based screens lagged.
Why the Sensex Outperforms
The Sensex is concentrated in India's highest-compounders. The 30-stock index is dominated by HDFC Bank, Reliance Industries, Infosys, ICICI Bank, TCS — companies that have compounded at 15-20% annually for two decades. A revenue-based screen that includes all NSE companies with 3+ industry peers and market caps above ₹20B will hold some of these, but also holds many second-tier revenue leaders in smaller industries that don't compound as fast.
Revenue leadership captures scale, not quality of compounding. A company at the top of a cyclical industry (steel, shipping, commodities) may have the highest revenue in a growing industry but generates thin margins. The Sensex tilts toward companies with durable earnings compounding, not just revenue size.
Cash drag from early periods. Holding cash from 2001-2004 missed the Sensex's strong early run. The 24-year CAGR comparison starts from the same date, so those years of 0% returns pull down the strategy's CAGR.
The Case for Running It
Despite underperforming the Sensex, the India strategy has two things going for it:
Lower drawdown. Max drawdown of -18.59% vs Sensex's -9.98%. Both are modest, but the revenue screen offers better downside protection than might be expected given the return gap.
2023 was extraordinary. +58.6% portfolio vs +21.8% Sensex is a +36.8% excess in one year. When the revenue screen fires — concentrated industries with structural leaders catching up — the returns can be significant.
Beats global benchmarks. For a global investor benchmarking against SPY, 11.08% CAGR in INR is a strong result. Whether that holds after currency conversion depends on INR/USD movements, but in local terms the strategy has delivered better than US-based alternatives.
Run It Yourself
Current screen (NSE):
WITH latest_rev AS (
    SELECT i.symbol, p.industry, p.exchange, p.companyName,
        i.revenue, i.date AS filing_date,
        ROW_NUMBER() OVER (PARTITION BY i.symbol ORDER BY i.dateEpoch DESC) AS rn
    FROM income_statement i
    JOIN profile p ON i.symbol = p.symbol
    WHERE i.period = 'FY' AND i.revenue > 0
      AND p.industry IS NOT NULL AND p.industry != ''
      AND p.exchange IN ('NSE')
),
prior_rev AS (
    SELECT i.symbol, i.revenue AS prior_revenue,
        ROW_NUMBER() OVER (PARTITION BY i.symbol ORDER BY i.dateEpoch DESC) AS rn
    FROM income_statement i WHERE i.period = 'FY' AND i.revenue > 0
),
company_growth AS (
    SELECT c.symbol, c.companyName, c.exchange, c.industry,
        c.revenue, p.prior_revenue, c.filing_date,
        (c.revenue - p.prior_revenue) / p.prior_revenue AS rev_growth
    FROM latest_rev c JOIN prior_rev p ON c.symbol = p.symbol
    WHERE c.rn = 1 AND p.rn = 2 AND p.prior_revenue > 0
),
company_filtered AS (
    SELECT cg.*, mc.marketCap FROM company_growth cg
    JOIN key_metrics_ttm mc ON cg.symbol = mc.symbol
    WHERE mc.marketCap >= 20000000000
),
industry_agg AS (
    SELECT industry, COUNT(*) AS n_companies,
        ROUND(AVG(rev_growth) * 100, 2) AS avg_growth_pct
    FROM company_filtered GROUP BY industry
    HAVING COUNT(*) >= 3 AND AVG(rev_growth) >= 0.05
),
leaders AS (
    SELECT cf.symbol, cf.companyName, cf.exchange, cf.industry,
        ROUND(cf.revenue / 1e9, 2) AS revenue_b,
        ROUND(cf.rev_growth * 100, 2) AS rev_growth_pct,
        ia.avg_growth_pct AS industry_growth_pct,
        ROUND(cf.marketCap / 1e9, 2) AS mktcap_b, cf.filing_date,
        ROW_NUMBER() OVER (PARTITION BY cf.industry ORDER BY cf.revenue DESC) AS rev_rank
    FROM company_filtered cf JOIN industry_agg ia ON cf.industry = ia.industry
)
SELECT symbol, companyName, exchange, industry, revenue_b,
    rev_growth_pct, industry_growth_pct, mktcap_b, filing_date, rev_rank
FROM leaders WHERE rev_rank <= 3 ORDER BY industry, rev_rank LIMIT 300
Run this query on Ceta Research Data Explorer
Run the full backtest:
git clone https://github.com/ceta-research/backtests.git
cd backtests
pip install -r requirements.txt
python3 industry-leader/backtest.py --preset india --output results_india.json --verbose
Limitations
Local benchmark comparison: The Sensex is the correct benchmark for evaluating whether this strategy adds alpha within Indian markets. Using SPY (USD) as the benchmark inflates the apparent outperformance — it reflects India's economic advantage over the US, not the strategy's edge over Indian equities.
NSE only: This run uses NSE only. Earlier versions included BSE, which introduced ~38% duplicate listings that inflated universe size and artificially improved returns. NSE-only is the cleaner dataset.
Cash periods (2001-2004): Holding cash for four years missed the Sensex's strong early run (Sensex +49.4% in 2004 alone). The cash drag pulls down the 24-year CAGR.
India-specific data coverage: FMP financial data for Indian markets has improved over time but may have thinner coverage for 2001-2007, particularly for mid-caps. This affects which companies are visible in early rebalance windows.
Currency: Portfolio returns are in INR. The SPY benchmark comparison uses USD. INR/USD movements can add or subtract 2-3% annually from a USD investor's perspective.
Data: Ceta Research (FMP financial data warehouse), July 2001 through July 2025. Portfolio returns in INR. Sensex benchmark in INR. SPY benchmark in USD for global reference. Full methodology: github.com/ceta-research/backtests/blob/main/METHODOLOGY.md.
Past performance does not guarantee future results. This is educational content, not investment advice.


