
Industry Leaders Global: Revenue Rankings Tested Across 13 Markets (2001-2025)
We ran the Industry Leader strategy on 13 exchanges. Only India outperforms SPY. Most markets trail by 1-5% annually. Here's what the data shows about where revenue leadership actually matters.

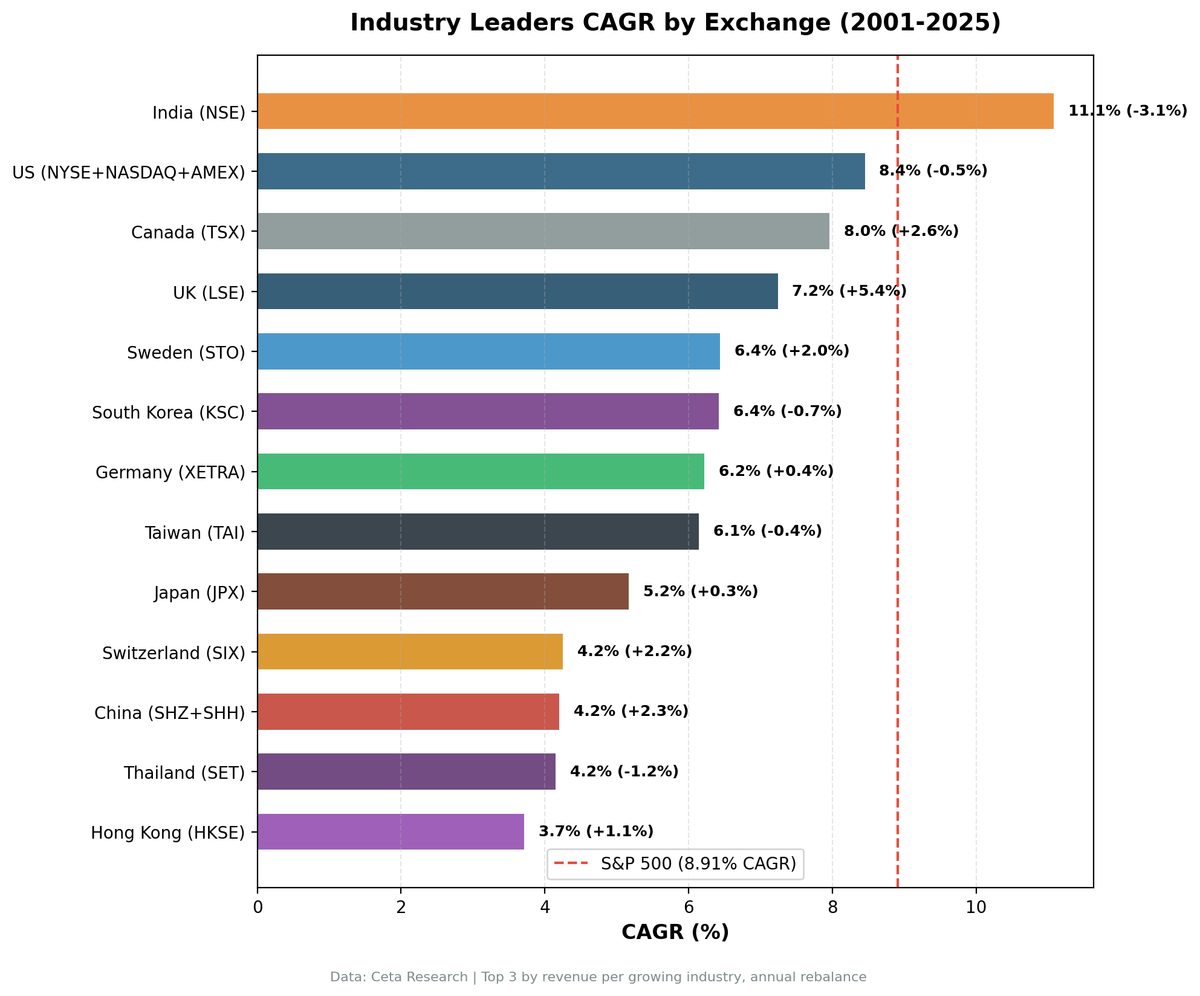
title: "Industry Leaders Global: Revenue Rankings Tested Across 13 Markets (2001-2025)" slug: industry-leaders-global-comparison publish_date: 2026-03-29 tags: [backtests, global-markets, fundamental-analysis, revenue-growth, exchange-comparison] post_access: public excerpt: "We ran the Industry Leader strategy on 13 exchanges. Against local benchmarks, most markets show positive excess. India is the exception: it beats SPY but trails the Sensex. The UK has the highest excess vs its local index." authors: [Swas] feature_image: 1_comparison_cagr.png feature_image_alt: "Industry Leaders CAGR by Exchange (2001-2025)"
Contents
- The Strategy
- Results: All 13 Exchanges
- Two Ways to Read This
- India: The Reversed Story
- UK: The Notable Positive
- The Pattern Across All Markets
- Japan and UK: Notable Markets
- Exchanges Excluded
- Run It Yourself
- Limitations
Data: FMP financial data warehouse, 2000–2025. Updated March 2026.
We ran the same strategy on 13 stock exchanges: take the top 3 companies by revenue in every industry showing 5%+ growth, hold equal weight, rebalance annually. The test ran from 2001 to 2025.
The benchmark matters. Against SPY (used as a global USD reference), only India outperforms. Against each exchange's own local index, most markets show positive excess. The story changes depending on what you're measuring.

The Strategy
Signal (applied to each exchange separately): 1. Industry average YoY revenue growth >= 5% 2. Company is in the top 3 by current FY revenue within that qualifying industry
Portfolio: Equal weight. Annual July rebalance. Exchange-specific market cap floors.
Execution: Next-day close (signal at close, execute next trading day). Eliminates same-bar entry bias.
Full methodology at backtests/METHODOLOGY.md.
Results: All 13 Exchanges
| Exchange | Market | CAGR | vs SPY | vs Local Benchmark | Local Index |
|---|---|---|---|---|---|
| NSE | India | 11.08% | +2.17% | -3.14% | Sensex (14.23%) |
| NYSE+NASDAQ+AMEX | US | 8.45% | -0.46% | -0.46% | S&P 500 (8.91%) |
| TSX | Canada | 7.96% | -0.95% | +2.64% | TSX Composite (5.32%) |
| LSE | UK | 7.24% | -1.67% | +5.44%† | FTSE 100 (1.80%)† |
| STO | Sweden | 6.44% | -2.47% | +2.03% | OMX S30 (4.40%) |
| KSC | South Korea | 6.42% | -2.49% | -0.65% | KOSPI (7.07%) |
| XETRA | Germany | 6.22% | -2.69% | +0.39% | DAX (5.83%) |
| TAI | Taiwan | 6.14% | -2.77% | -0.44% | TAIEX (6.58%) |
| JPX | Japan | 5.17% | -3.74% | +0.32% | Nikkei 225 (4.85%) |
| SIX | Switzerland | 4.25% | -4.66% | +2.17% | SMI (2.08%) |
| SHZ+SHH | China | 4.20% | -4.71% | +2.31% | SSE Composite (1.89%) |
| SET | Thailand | 4.15% | -4.76% | -1.16% | SET Index (5.31%) |
| HKSE | Hong Kong | 3.71% | -5.20% | +1.14% | Hang Seng (2.57%) |
CAGR in local currency. SPY (8.91% CAGR) used as global USD reference. "vs Local" = strategy CAGR minus local index CAGR.
†FTSE 100 is a price-return index. Portfolio stocks use dividend-adjusted prices (adjClose). This inflates the UK excess figure. On a total-return basis, the FTSE 100 would show a higher CAGR and reduce the apparent excess.
Two Ways to Read This
Against SPY (global reference): Only India beats it (+2.17%). Everyone else trails. This is the standard "can this strategy beat a passive US investment?" test, and it mostly says no.
Against local benchmarks: Most markets show positive excess. UK (+5.44%), Canada (+2.64%), China (+2.31%), Sweden (+2.03%), Switzerland (+2.17%), and Hong Kong (+1.14%) all beat their local index. India, surprisingly, doesn't: the Sensex returned 14.23% CAGR vs the strategy's 11.08%.
The SPY comparison is partly measuring country economic performance. An Indian strategy generating 11% in INR looks great vs SPY's 8.91% in USD. But that comparison captures India's economic growth advantage, not strategy alpha. Against Sensex — which reflects that same Indian economic growth — the strategy underperforms.
India: The Reversed Story
India deserves a separate look. In prior publications, India was presented as the one market where revenue leadership clearly worked. Against SPY, it still appears to (+2.17%). Against the Sensex, it doesn't.
The Sensex returned 14.23% CAGR over 24 years. The strategy returned 11.08%. That's a -3.14% annual gap vs the local index — 12 losses out of 20 invested years.
The reason: the Sensex is 30 stocks dominated by India's highest-compounding businesses (HDFC Bank, Reliance, Infosys, ICICI Bank, TCS). A revenue screen across 100+ NSE companies includes cyclical revenue leaders in steel, commodities, and shipping that grow revenue fast but don't compound earnings the same way. India's booming economy lifted all boats. Picking the top 3 by revenue added diversification but not alpha vs the index.
UK: The Notable Positive
The UK strategy returned 7.24% CAGR with a +5.44% excess vs the FTSE 100 (1.80% CAGR). That's the largest local excess of any exchange tested.
The caveat: the FTSE 100 is a price-return index. Portfolio stocks use dividend-adjusted prices. The UK market is known for high dividend yields (3-5% annually for many FTSE components). On a total-return basis, the FTSE 100 would show a significantly higher CAGR, reducing the apparent excess. This makes UK the most important case where benchmark methodology affects the result.
Even with that caveat, UK revenue leaders in growing industries generated solid absolute returns (7.24%). The maximum drawdown (-34.19%) is reasonable for a 24-year period.
The Pattern Across All Markets
Against local indices, most markets show positive excess. The markets that don't — India, South Korea, Taiwan, Thailand, US — tend to have high-performing local indices that ran faster than the equal-weighted revenue screen.
Equal weighting hurts in concentrated market rallies. Whether it's Sensex, KOSPI, or TAIEX, when a local market's index is dominated by high-compounding large caps, an equal-weighted revenue screen across a broader universe can't keep up.
High-nominal-growth markets have a different problem. India, Thailand, and Korea all had strong economic growth over the test period. Their indices compounded fast. The revenue screen generated good absolute returns but missed the highest-compounding businesses by spreading weight too broadly.
Low-index-CAGR markets show the most excess. UK, China, Switzerland, and Hong Kong all have local indices with low or moderate CAGRs. Revenue leadership in growing industries outran these indices because the bar was lower.
Japan and UK: Notable Markets
Japan (JPX): 5.17% CAGR, +0.32% vs Nikkei 225
Japan's Nikkei 225 returned 4.85% CAGR over 24 years. The strategy barely beat it (+0.32%). The large drawdown (-52.97%) reflects Japan's market structure: high cyclicality and significant volatility even for large-cap revenue leaders. The Nikkei 225 itself was deeply volatile over this period (lost 80% from 1990 peak to 2009 before recovering).
UK (LSE): 7.24% CAGR, +5.44% vs FTSE 100 (price-return)
UK results show the highest local excess, but this comparison is partly a dividend accounting effect. The FTSE 100 price index started around 6,200 in 2001 and is around 8,700 today — modest appreciation — but distributions to shareholders through dividends aren't captured in that number. Portfolio stocks using adjClose do capture dividends. A total-return FTSE 100 comparison would reduce this excess significantly.
Exchanges Excluded
ASX (Australia) and SAO (Brazil): Excluded due to confirmed data quality issues in adjusted close prices (split adjustment artifacts that inflate backtest returns). Results are not reliable.
JNB (South Africa): The strategy held cash in 10 of 24 periods due to insufficient qualifying stocks. With only 14 invested periods and a universe of ~270 stocks, statistical significance is low. No local index data available in FMP; falls back to SPY benchmark.
SES (Singapore): Only 17 of 24 periods had qualifying stocks, with fewer than 15 average holdings. Thin universe limits reliability.
Run It Yourself
Current global screen:
WITH latest_rev AS (
    SELECT i.symbol, p.industry, p.exchange, p.companyName,
        i.revenue, i.date AS filing_date,
        ROW_NUMBER() OVER (PARTITION BY i.symbol ORDER BY i.dateEpoch DESC) AS rn
    FROM income_statement i
    JOIN profile p ON i.symbol = p.symbol
    WHERE i.period = 'FY' AND i.revenue > 0
      AND p.industry IS NOT NULL AND p.industry != ''
),
prior_rev AS (
    SELECT i.symbol, i.revenue AS prior_revenue,
        ROW_NUMBER() OVER (PARTITION BY i.symbol ORDER BY i.dateEpoch DESC) AS rn
    FROM income_statement i WHERE i.period = 'FY' AND i.revenue > 0
),
company_growth AS (
    SELECT c.symbol, c.companyName, c.exchange, c.industry,
        c.revenue, p.prior_revenue, c.filing_date,
        (c.revenue - p.prior_revenue) / p.prior_revenue AS rev_growth
    FROM latest_rev c JOIN prior_rev p ON c.symbol = p.symbol
    WHERE c.rn = 1 AND p.rn = 2 AND p.prior_revenue > 0
),
company_filtered AS (
    SELECT cg.*, mc.marketCap FROM company_growth cg
    JOIN key_metrics_ttm mc ON cg.symbol = mc.symbol
    WHERE mc.marketCap > 0
),
industry_agg AS (
    SELECT exchange, industry, COUNT(*) AS n_companies,
        ROUND(AVG(rev_growth) * 100, 2) AS avg_growth_pct
    FROM company_filtered GROUP BY exchange, industry
    HAVING COUNT(*) >= 3 AND AVG(rev_growth) >= 0.05
),
leaders AS (
    SELECT cf.symbol, cf.companyName, cf.exchange, cf.industry,
        ROUND(cf.revenue / 1e9, 2) AS revenue_b,
        ROUND(cf.rev_growth * 100, 2) AS rev_growth_pct,
        ia.avg_growth_pct AS industry_growth_pct,
        ROUND(cf.marketCap / 1e9, 2) AS mktcap_b, cf.filing_date,
        ROW_NUMBER() OVER (PARTITION BY cf.exchange, cf.industry ORDER BY cf.revenue DESC) AS rev_rank
    FROM company_filtered cf JOIN industry_agg ia ON cf.exchange = ia.exchange AND cf.industry = ia.industry
)
SELECT symbol, companyName, exchange, industry, revenue_b,
    rev_growth_pct, industry_growth_pct, mktcap_b, filing_date, rev_rank
FROM leaders WHERE rev_rank <= 3 ORDER BY exchange, industry, rev_rank LIMIT 500
Run this query on Ceta Research Data Explorer
Limitations
Benchmark methodology: Local indices from FMP may be price-return only (no dividends). Portfolio stocks use dividend-adjusted prices. This creates an inconsistency that inflates apparent excess vs local benchmarks, most significantly for the UK (high dividend yield market) but also relevant for China, Hong Kong, and Switzerland.
Local currency returns vs USD benchmark: Each exchange's portfolio returns are in local currency. The SPY benchmark is in USD. Exchange rate movements aren't reflected in the "vs SPY" comparison.
Varying data quality by exchange: FMP financial data quality varies. Some exchanges have thinner coverage in early years (2001-2006). This is most relevant for Thailand, Taiwan, and Korea in the early periods.
Different market cap thresholds: Each exchange uses a market cap threshold calibrated in local currency. This keeps the selectivity roughly consistent but doesn't create perfectly comparable universes.
Data: Ceta Research (FMP financial data warehouse), July 2001 through July 2025. Returns in local currency per exchange. SPY (8.91% CAGR) used as global USD reference. Full methodology: github.com/ceta-research/backtests/blob/main/METHODOLOGY.md.
Past performance does not guarantee future results. This is educational content, not investment advice.


