
Income Quality on UK Stocks: The Signal That Can't Separate
We tested income quality (OCF/NI) on 25 years of LSE data. The spread between high and low quality is just 0.5% per year. All three buckets returned nearly identical CAGRs. The UK market is too cash-generative for this signal to separate.

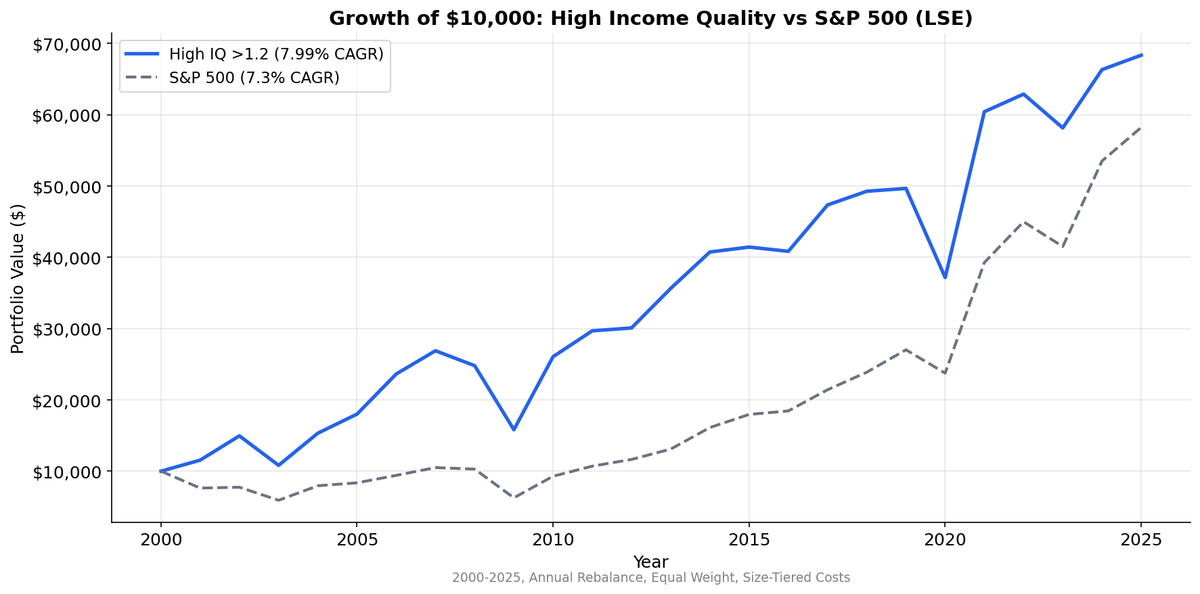
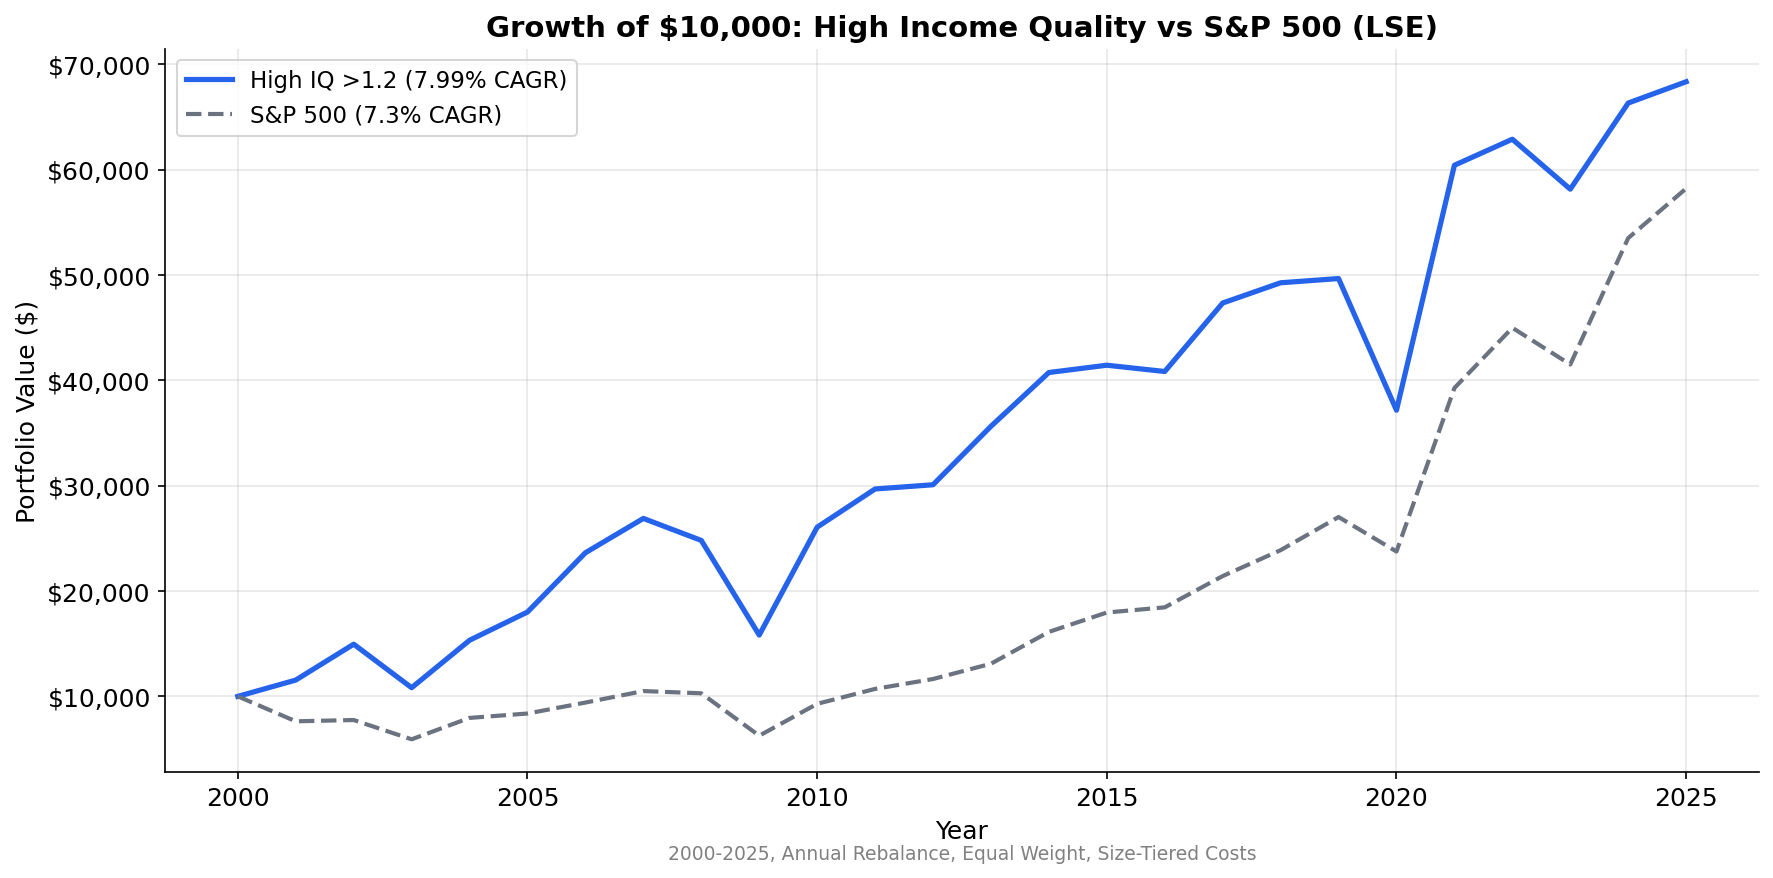
Income quality works in US equities. High cash conversion beats low cash conversion by 4% annually. We tested the same signal on the London Stock Exchange over 25 years. The spread: -0.5%. Negative. Medium IQ stocks (8.4% CAGR) beat high IQ stocks (7.2%) by 1.2% per year. The ranking inverted.
Contents
- Method
- What We Found
- 25-Year Summary
- Why the UK Flattens the Spread
- The Down Capture Story
- Limitations
- Takeaway
But all three buckets crushed the FTSE 100, which returned just 1.15% annually with a -41.9% max drawdown. Income quality stocks don't separate from each other in the UK, but they collectively avoid the index's terrible performers. For the full screen logic and research background, see the US Income Quality post.
Data: FMP financial data warehouse, 2000–2025. Updated March 2026.
Method
| Parameter | Value |
|---|---|
| Universe | LSE (London Stock Exchange) |
| Market cap filter | > £500M (~$635M USD) |
| Signal | Income Quality (OCF / Net Income) |
| Portfolios | High (IQ > 1.2), Medium (0.5-1.2), Low (IQ < 0.5) |
| Rebalancing | Annual (April 1) |
| Filing lag | 45 days (point-in-time) |
| Exclusions | Negative net income |
| Weighting | Equal weight within each group |
| Transaction costs | Size-tiered (0.1-0.5% per trade) |
| Benchmark | FTSE 100 (^FTSE, GBP) |
| Period | 2000-2025 |
What We Found
25-Year Summary
| Metric | High IQ (>1.2) | Medium IQ (0.5-1.2) | Low IQ (<0.5) | FTSE 100 |
|---|---|---|---|---|
| CAGR | 7.2% | 8.4% | 7.8% | 1.15% |
| Volatility | 21.5% | — | — | 16.5% |
| Sharpe | 0.173 | — | — | -0.142 |
| Max Drawdown | -35.7% | — | — | -41.9% |
| Down Capture | 43.8% | — | — | 100% |
| Beta | 1.130 | — | — | 1.0 |
| Alpha | +6.38% | — | — | — |
| Win Rate | 72% | — | — | — |
| Excess vs FTSE | +6.08% | +7.28% | +6.63% | — |
| Avg Stocks | 222 | 116 | 74 | — |
The spread between high and low income quality is -0.5%. Negative. Medium IQ stocks returned 8.4%, beating both high (7.2%) and low (7.8%). The expected monotonic ranking failed. The signal doesn't discriminate between quality tiers on the LSE.
But all three buckets crushed the FTSE 100. The index returned 1.15% annually with a -41.9% max drawdown. High IQ stocks beat it by +6.1%, medium by +7.3%, low by +6.6%. The key insight: income quality stocks collectively avoid the FTSE's worst performers (energy majors that struggled, financials that crashed in 2008). The signal works as an index-avoidance tool, not a quality ranker.
Why the UK Flattens the Spread
The FTSE universe is dominated by mature, cash-generative businesses. Energy majors like Shell and BP produce enormous operating cash flows. Mining companies like Rio Tinto and BHP convert earnings to cash reliably. Financial services firms, consumer staples, and utilities round out the index with similarly high cash conversion.
When most companies in the universe already have strong cash conversion, the signal can't separate. It's the same dynamic you'd see testing "does the company have revenue?" on the S&P 500. Yes, they all do. The filter doesn't filter.
The UK lacks the US's deep pool of high-growth, accrual-heavy technology companies. In the US, the low income quality basket fills with software firms capitalizing development costs, biotech companies burning cash while reporting license revenue, and tech firms stretching revenue recognition. These are the names that drag down the low IQ basket and widen the spread. The LSE doesn't have enough of them to create that separation.
There's also a structural element. UK accounting standards (IFRS, adopted in 2005) handle certain accruals differently than US GAAP. IFRS revaluation of assets and different treatment of development costs changes the OCF/NI ratio's distribution. The ratio still measures cash conversion, but the baseline differs.
The Down Capture Story
The more interesting finding isn't the spread. It's the downside profile.
Down capture of 82% means the high IQ portfolio fell less than SPY in negative markets. The 0.913 beta confirms the portfolio carries less market risk. This makes sense: high cash conversion companies are typically mature, with stable cash flows, lower leverage, and consistent dividend policies. They're not going to crash as hard as the index in a panic.
But you don't need the income quality signal to get this exposure. Any large-cap, low-beta UK screen would produce similar downside characteristics. The income quality ratio is adding structural safety, not alpha.
Limitations
Spread is not statistically significant. A 0.5% annual spread over 25 years, with 24% volatility, is well within noise. You can't reject the null hypothesis that all three quality buckets have the same expected return.
Large portfolio sizes dilute signal. The high IQ basket averages 239 stocks. That's a broad index, not a concentrated factor bet. With that many names, extreme winners and losers average out, compressing the return distribution.
Currency embedded. Returns include GBP/USD movements. The pound weakened significantly post-Brexit (2016-2025), which affects USD-denominated returns. The signal's performance in GBP terms may differ.
Sector concentration. The FTSE's tilt toward energy, mining, and financials means the portfolio is effectively a sector bet dressed as a quality screen. The income quality ratio isn't adding differentiation beyond what sector allocation provides.
Takeaway
Income quality works in the US because the market has enough accrual-heavy, low-cash-conversion companies to create a meaningful "bad" basket. The UK doesn't have that dynamic. The LSE's sector composition, heavy on mature cash generators, means the signal starts strong and has nowhere to go. All three quality buckets returned within 0.5% of each other.
The practical implication: if you're screening UK stocks, income quality is a fine sanity check but not a ranking tool. Use it to flag the rare company with suspiciously low cash conversion, not to build a systematic portfolio. The alpha isn't there.
Data: Ceta Research, FMP financial data warehouse. Universe: LSE, market cap > £500M. Annual rebalance (April), equal weight, 2000-2025. Benchmark: S&P 500 (SPY). Past performance does not guarantee future results.


