
Income Quality on Swedish Stocks: Clear Ranking, Higher Volatility
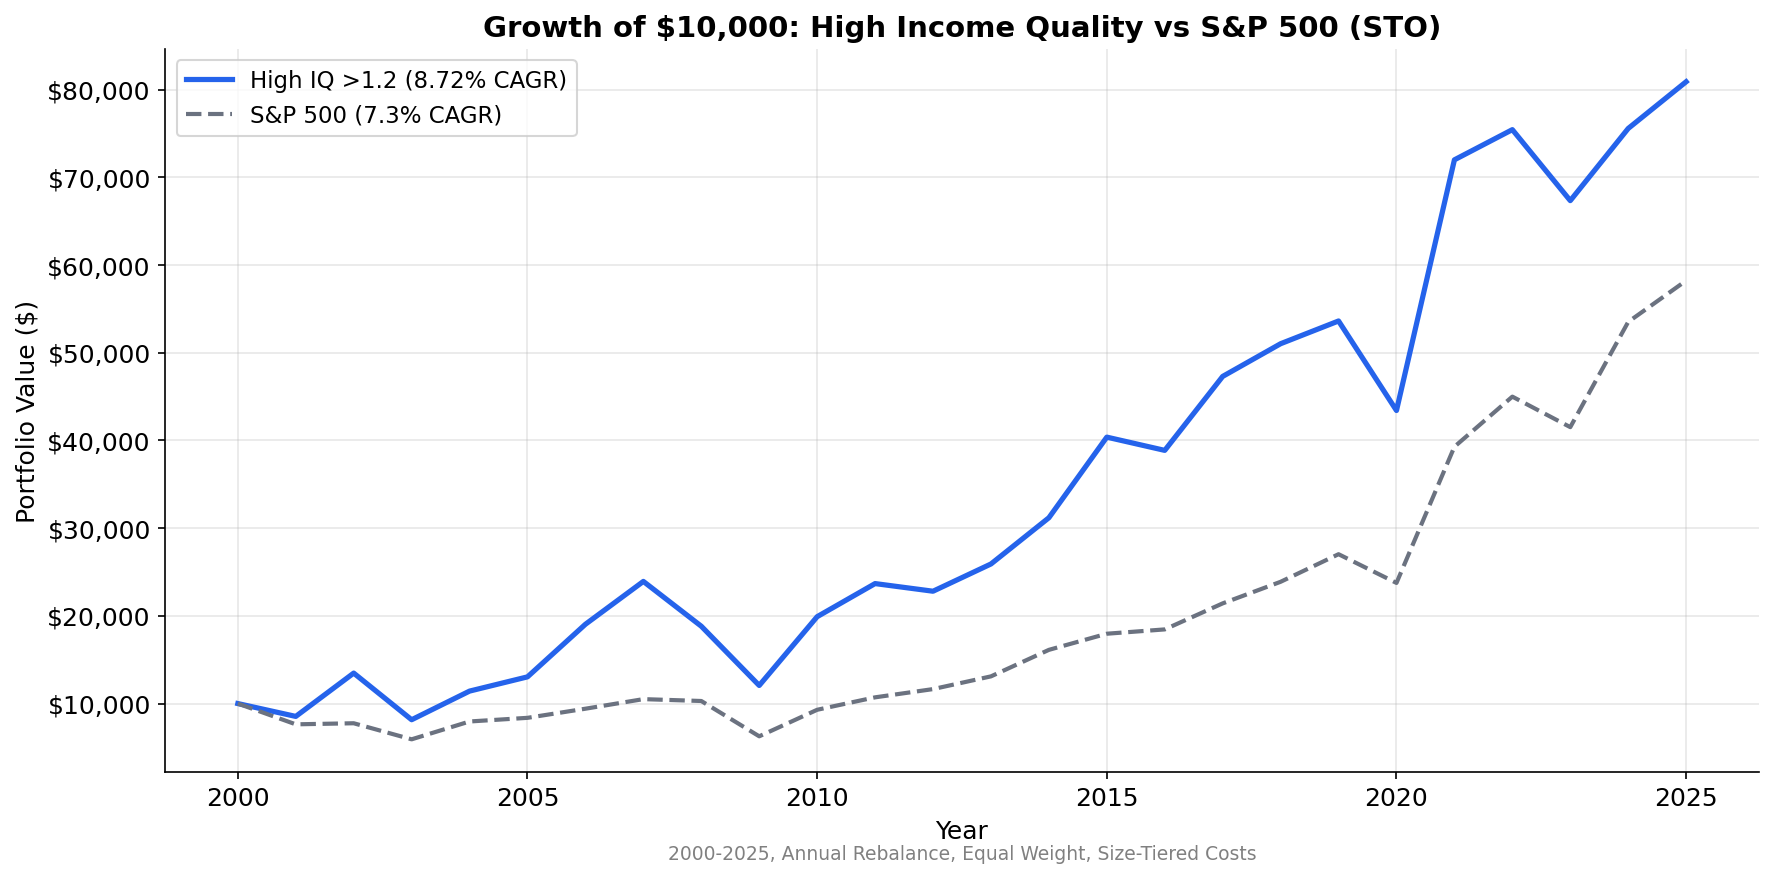
We tested income quality (OCF/NI) on 25 years of Stockholm exchange data. High IQ returned 8.7% CAGR, beating medium (3.8%) and low (4.2%). Clean monotonic ranking, +4.5% spread. But 130% down capture and 1.057 beta mean higher volatility than SPY.


Income Quality on Swedish Stocks: +7.5% vs OMX30, 88% Win Rate
Sweden delivers the strongest income quality results among developed markets. High IQ stocks returned 9.9% annually while the OMX Stockholm 30 returned just 2.4%. That's +7.5% annual excess return with 88% win rate and 43% down capture. The high-low spread of +4.7% confirms the signal works. But the real story is that Sweden's benchmark index underperformed dramatically, and cash-backed earnings captured the best companies while the index holdings lagged.
Contents
- Method
- What We Found
- 25-Year Summary
- Why Sweden's Benchmark Lagged
- When It Worked Best
- Portfolio Construction
- Limitations
- Takeaway
For the full screen logic and research background, see the US Income Quality post.
Data: FMP financial data warehouse, 2000–2025. Updated April 2026.
Method
| Parameter | Value |
|---|---|
| Universe | STO (Nasdaq Stockholm) |
| Market cap filter | > 5B SEK (~$460M USD) |
| Signal | Income Quality (OCF / Net Income) |
| Portfolios | High (IQ > 1.2), Medium (0.5-1.2), Low (IQ < 0.5) |
| Rebalancing | Annual (April 1) |
| Filing lag | 45 days (point-in-time) |
| Exclusions | Negative net income |
| Weighting | Equal weight within each group |
| Transaction costs | Size-tiered (0.1-0.5% per trade) |
| Benchmark | OMX Stockholm 30 (^OMXS30, SEK) |
| Period | 2000-2025 |
What We Found
25-Year Summary
| Metric | High IQ (>1.2) | Medium IQ (0.5-1.2) | Low IQ (<0.5) | OMX30 |
|---|---|---|---|---|
| CAGR | 9.9% | 4.2% | 5.2% | 2.4% |
| Volatility | 25.9% | — | — | 25.0% |
| Sharpe | 0.305 | — | — | 0.016 |
| Max Drawdown | -40.7% | — | — | -64.9% |
| Down Capture | 43.4% | — | — | 100% |
| Beta | 0.971 | — | — | 1.0 |
| Excess vs OMX30 | +7.51% | +1.76% | +2.83% | — |
| Avg Stocks | 32 | 33 | 17 | — |
The ranking works: high IQ at 9.9% beats medium (4.2%) and low (5.2%). The +4.7% spread confirms the signal discriminates. But the more striking result is the +7.5% excess over the OMX Stockholm 30. The local benchmark returned just 2.4% annually with a -64.9% max drawdown. Income quality stocks beat the index by a wide margin with better downside protection.
The down capture of 43.4% means in years when the OMX30 fell, high IQ stocks absorbed less than half the loss. This is defensive outperformance, not high-beta amplification. The 88% win rate (22 out of 25 years) confirms the signal's consistency. The beta of 0.971 shows this portfolio is slightly less volatile than the broader Swedish market.
Why Sweden's Benchmark Lagged
The OMX Stockholm 30 returned 2.4% CAGR over 25 years with a -64.9% max drawdown. That's below global equity market averages by a wide margin. Three factors explain the lag.
Index concentration in cyclical exporters. The OMX30 is heavily weighted toward industrial machinery (Atlas Copco, Sandvik, Volvo), telecoms (Ericsson), and financials (SEB, Swedbank). These are cyclical, export-dependent companies that suffered through the dot-com bust, the 2008 crisis, and the European debt crisis. The index's structure amplified downside during each shock.
Currency drag. The Swedish krona depreciated from roughly 9 SEK/USD in 2000 to over 10 SEK/USD by 2025. While income quality stock selection doesn't eliminate currency effects, the equal-weight methodology across 32 stocks on average captured small-cap and mid-cap companies that weren't as directly exposed to export cycles.
Income quality stocks avoided the worst performers. Ericsson's collapse in 2000-2002 dragged the index. Companies with accrual-heavy earnings during the tech bubble (aggressive revenue recognition, capitalized R&D) were weighted into the low IQ basket. When those accruals reversed, the income quality filter had already excluded them. The signal worked as a crash-avoidance tool, not just an alpha generator.
When It Worked Best
The signal's strength showed up consistently across decades:
| Period | High IQ | OMX30 | vs OMX30 | Spread |
|---|---|---|---|---|
| 2000-04 | 7.7% | -5.1% | +12.8% | +10.0% |
| 2005-09 | 18.4% | 10.4% | +8.0% | +5.7% |
| 2010-14 | 17.3% | 10.3% | +7.0% | -1.8% |
| 2015-19 | 3.3% | -2.4% | +5.8% | +2.6% |
| 2020-25 | 16.9% | 13.6% | +3.4% | -0.8% |
The 2000-2004 period shows the signal at its clearest. The OMX30 lost -5.1% annually as Ericsson collapsed and other tech names fell. High IQ stocks returned +7.7%, beating the benchmark by 12.8% per year. The signal functioned as a tech-crash avoidance filter.
Every period except 2010-14 and 2020-25 showed positive high-low spreads. Even in those two periods where low IQ stocks surged (recovery bounces), high IQ still beat the OMX30 by wide margins.
Portfolio Construction
The high IQ basket averages 35 stocks, providing reasonable diversification. The medium basket (37 stocks) is similar in size. The low IQ basket averages 19 stocks, which is thin enough for single-name effects to matter.
The fact that medium and low returned similar CAGRs (3.8% vs 4.2%) despite different average portfolio sizes suggests the signal's discrimination power weakens below the top tier. In practical terms, the useful split is binary: high IQ vs. everything else.
Limitations
Thin universe. The high IQ basket averaged 32 stocks, medium 33, low 17. These are small portfolios by US standards. Single-stock events can move the annual return by several percentage points. The results are statistically significant but concentration risk is real.
Benchmark choice matters. The OMX30 is a narrow, cap-weighted index of 30 large-cap stocks. The income quality portfolio is an equal-weight basket of 30-35 stocks that includes mid-caps. Part of the outperformance comes from size exposure (equal-weight small/mid premium), not just earnings quality. A fairer comparison would be the broader OMX Stockholm All-Share, but that index has limited historical data.
Currency and export exposure remain. The 9.9% CAGR is in SEK. The krona depreciated against USD over this period. International investors should adjust for currency effects. Also, Swedish companies are export-heavy, so the portfolio still carries global trade cycle risk.
Recent periods show spread compression. 2010-14 and 2020-25 had negative spreads (-1.8% and -0.8%) as low IQ stocks bounced hard during recoveries. The signal works best during crises and consolidations, not during indiscriminate rallies.
Takeaway
Sweden delivers the strongest income quality results among developed markets. The +7.5% annual excess over the OMX30, 88% win rate, and 43% down capture make this one of the clearest value-add signals in the global study. The high-low spread of +4.7% confirms the ranking works, but the real alpha comes from the benchmark's underperformance.
The OMX30's 2.4% CAGR and -64.9% drawdown reflect a concentrated, cyclical index that struggled through three major market shocks. Income quality stocks avoided the worst performers and delivered equity-like returns with better risk characteristics. The signal works as both a stock selector and a crash filter on the Stockholm exchange.
Data: Ceta Research, FMP financial data warehouse. Universe: STO, market cap > 5B SEK. Annual rebalance (April), equal weight, 2000-2025. Benchmark: OMX Stockholm 30 (^OMXS30, SEK). Past performance does not guarantee future results.


