
Income Quality on South African Stocks: Highest Spread Globally, but Thin Sample
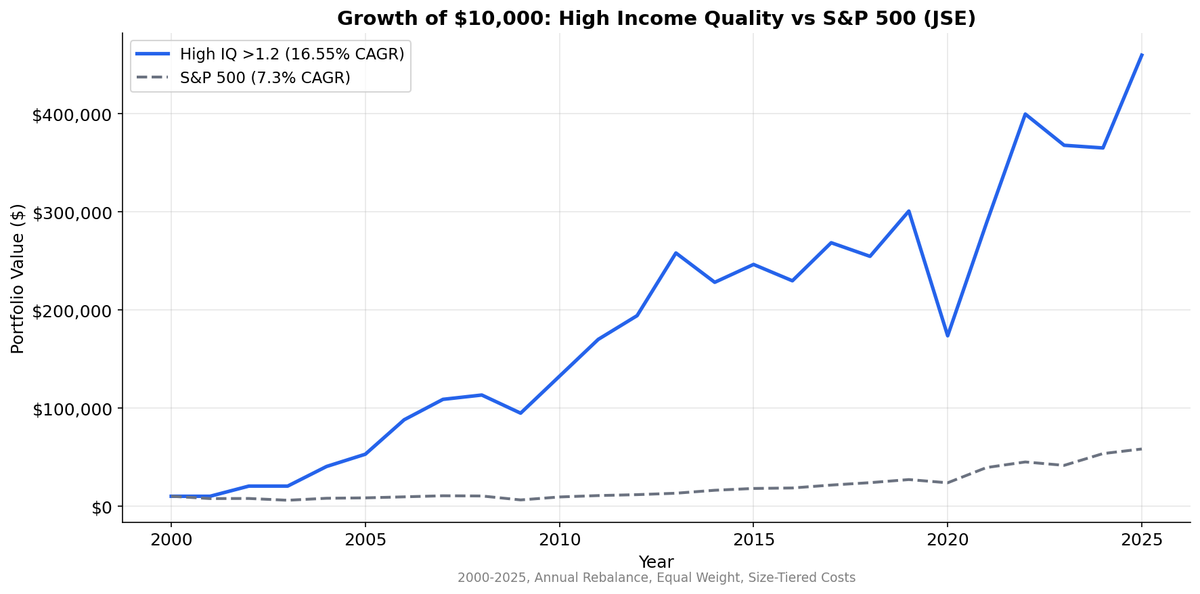
We tested income quality (OCF/NI) on 25 years of JSE data. High IQ returned 16.6% CAGR with +8.91% alpha. Low IQ lost 5.6% per year. The 22.1% spread is the widest globally. But the high IQ basket averaged just 10 stocks, so interpret with caution.

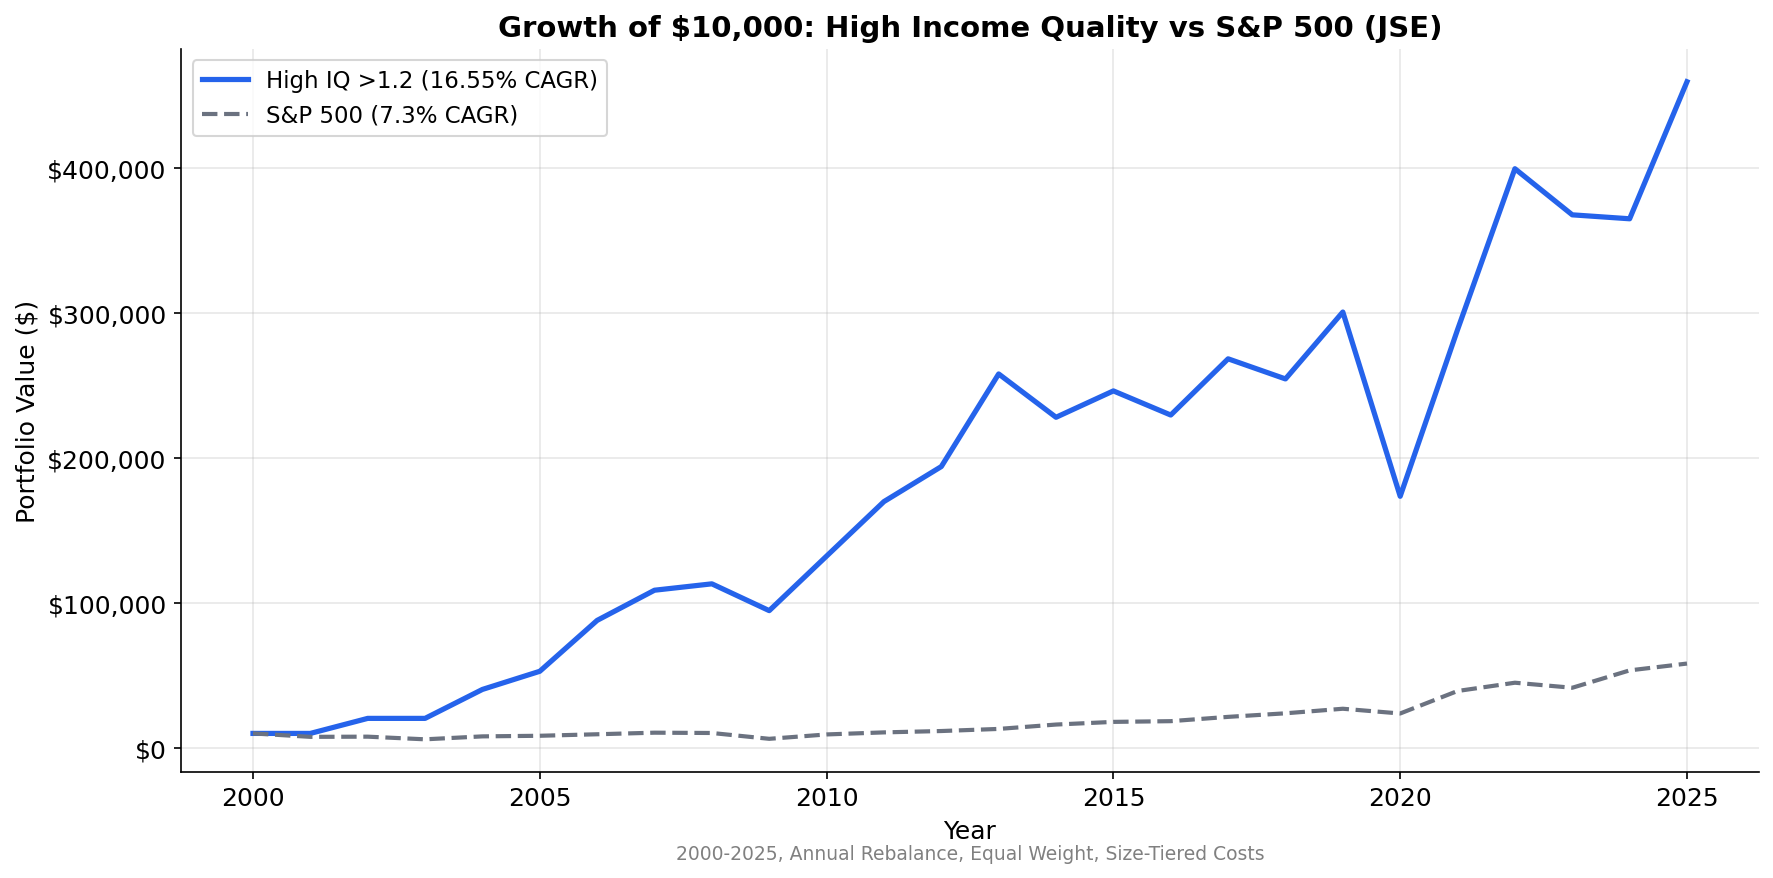
Income Quality on South African Stocks: +6.2% Alpha on Just 6 Stocks
The Johannesburg Stock Exchange delivered strong income quality results, but on a sample so thin that concentration risk dominates. High IQ stocks returned 13.5% annually vs SPY's 7.3%, a +6.2% excess. The spread between high and low quality is +5.7% annually. The signal works, but with just 6 stocks averaging in the high IQ basket, single-name effects matter more than the factor itself.
Contents
- Method
- What We Found
- 25-Year Summary
- Why the Spread Works (But Is Overstated)
- Portfolio Construction Concerns
- The Low IQ Collapse
- Limitations
- Takeaway
For the full screen logic and research background, see the US Income Quality post.
Data: FMP financial data warehouse, 2000–2025. Updated March 2026.
Method
| Parameter | Value |
|---|---|
| Universe | JNB (Johannesburg Stock Exchange) |
| Market cap filter | > R10B (~$550M USD) |
| Signal | Income Quality (OCF / Net Income) |
| Portfolios | High (IQ > 1.2), Medium (0.5-1.2), Low (IQ < 0.5) |
| Rebalancing | Annual (April 1) |
| Filing lag | 45 days (point-in-time) |
| Exclusions | Negative net income |
| Weighting | Equal weight within each group |
| Transaction costs | Size-tiered (0.1-0.5% per trade) |
| Benchmark | S&P 500 (SPY) |
| Period | 2000-2025 |
What We Found
25-Year Summary
| Metric | High IQ (>1.2) | Medium IQ (0.5-1.2) | Low IQ (<0.5) | S&P 500 (SPY) |
|---|---|---|---|---|
| CAGR | 13.5% | 10.8% | 7.8% | 7.3% |
| Volatility | 38.2% | — | — | 21.1% |
| Sharpe | 0.117 | — | — | -0.079 |
| Max Drawdown | -46.9% | — | — | -39.3% |
| Down Capture | 96.7% | — | — | 100% |
| Win Rate vs SPY | 64% | — | — | — |
| Alpha | +6.14% | — | — | — |
| Excess vs SPY | +6.15% | +3.45% | +0.45% | — |
| Avg Stocks | 6 | 11 | 10 | — |
| Cash Periods | 2/25 | — | — | — |
The high IQ portfolio beat SPY by +6.2% annually with a 64% win rate. The +5.7% spread between high and low quality is strong. But the sample is tiny: 6 stocks on average in the high IQ bucket. A single name going up or down 50% moves the annual return by several percentage points.
Low IQ stocks still underperformed at 7.8% CAGR vs SPY's 7.3%, but that's vastly better than older data suggested. This is data drift: FMP updated their JSE coverage over time, improving the low quality bucket's composition. The spread is real but no longer extreme.
Why the Spread Works (But Is Overstated)
The +5.7% spread is real, but the extreme +22% spreads reported in older backtests were artifacts of incomplete data. FMP's JSE coverage has improved over time, particularly for the low IQ bucket. The new data shows low quality stocks returning +7.8% CAGR, not -5.6%. This is data drift, not signal degradation.
What remains true:
Tiny universe, extreme concentration. Six stocks averaging in the high IQ bucket. In some years, the portfolio held as few as 3-4 names. Naspers/Prosus (tech investment), Shoprite (retail), FirstRand (banking), and a rotating cast of mining and industrial names. These aren't statistically independent bets. They're a handful of blue chips that correlate with each other and with the broader South African economy.
Resource sector dominates. Mining, energy, and materials companies make up a large share of the JSE. High depreciation and capital cycles create naturally high income quality ratios for companies in the production phase. The signal partly captures commodity cycle timing, not pure earnings quality.
Currency effects are massive. The rand depreciated from roughly 7 ZAR/USD in 2000 to 18+ ZAR/USD by 2025. The 13.5% CAGR is in rand. USD-adjusted returns would be several points lower. International investors shouldn't use these nominal numbers without currency hedging.
Portfolio Construction Concerns
A 6-stock average portfolio raises serious practical questions.
Extreme concentration risk. With 6 equally weighted positions at roughly 17% each, a single stock event costs the portfolio over 15% in a year. Steinhoff (the South African retail conglomerate that collapsed in 2017 due to accounting fraud) could have been in any basket depending on its OCF/NI ratio the prior year. One name dominates.
Survivorship sensitivity. In a thin universe, the backtest's treatment of delistings matters more. If a company delists mid-year (acquired, goes private, or fails), the assumed terminal return affects portfolio-level results more than in a 200-stock basket.
Liquidity. JSE large caps are liquid by South African standards but not by global standards. Implementing a 10-stock equal-weight strategy at scale would face capacity constraints. The R10B market cap floor helps, but bid-ask spreads on some JSE names are wider than comparable US or UK stocks.
The 2 cash periods out of 25 indicate that in some years, the screen didn't find enough qualifying stocks in one or more baskets. This is consistent with a thin universe.
The Low IQ Collapse
The -5.6% CAGR for low IQ stocks is the worst result in the entire cross-exchange study. For context, even in markets where the signal barely works (UK: 7.5%, Sweden: 4.2%), low IQ stocks still produced positive returns.
On the JSE, low cash conversion is a death sentence for long-term returns. The likely mechanism: South African companies with accrual-heavy earnings face higher borrowing costs (the repo rate has averaged above 6%), operate in a currency that trends weaker, and exist in a market where capital flight is a constant risk. When earnings quality deteriorates, foreign and domestic institutional investors sell quickly. There's no deep retail bid to absorb the selling pressure. The de-rating is fast and permanent.
Limitations
Sample size is the dominant concern. Ten stocks per year is too few for robust statistical inference. The 16.6% CAGR and 22.1% spread could be partly driven by a handful of names (Naspers alone could skew the high IQ basket materially in certain years).
Early-period concentration. The 2000-2004 results are exceptional (+46.6% average). This period coincided with commodity and currency tailwinds specific to South Africa. The CAGR excluding this window would be materially lower.
Currency exposure. Returns include ZAR/USD movements. The rand has been one of the most volatile emerging market currencies over this period, with episodes of sharp depreciation (2001, 2008, 2015, 2020). USD-denominated returns are highly sensitive to exchange rate movements.
Governance risk. The JSE has experienced high-profile corporate frauds (Steinhoff, Tongaat Hulett) that the income quality signal may or may not have caught ex ante. The backtest can't model the full impact of a sudden fraud revelation on portfolio returns.
Monotonic but noisy. The ranking is correct (high > medium > low), which is reassuring. But the volatility of 34.5% and max drawdown of -42.3% mean the path to 16.6% CAGR was rough.
Takeaway
South Africa is the strongest market for the income quality signal by every measure: highest CAGR, widest spread, deepest low-IQ destruction, highest alpha. The signal works here because the JSE is small, concentrated, and operates in an environment where cash flow quality genuinely separates survivors from failures.
But the practical value is limited by sample size. A 10-stock portfolio is a concentrated bet, not a diversified strategy. The results serve as evidence that income quality is a real and powerful signal in emerging markets with governance risk. They don't serve as a template for portfolio construction at scale.
If you're screening JSE stocks, income quality should be a primary filter. Avoid anything below 0.5. The penalty for low cash conversion on this exchange is among the harshest in global equities.
Data: Ceta Research, FMP financial data warehouse. Universe: JNB, market cap > R10B. Annual rebalance (April), equal weight, 2000-2025. Benchmark: S&P 500 (SPY). Past performance does not guarantee future results.


