
Income Quality on Korean Stocks: Medium Beats High
We tested income quality (OCF/NI) on 25 years of KSC data. The medium quality basket (7.1% CAGR) beat the high quality basket (5.5%). The signal works as a filter against low quality (1.4% CAGR) but the top tier underperforms, likely due to chaebol cash flow structures.

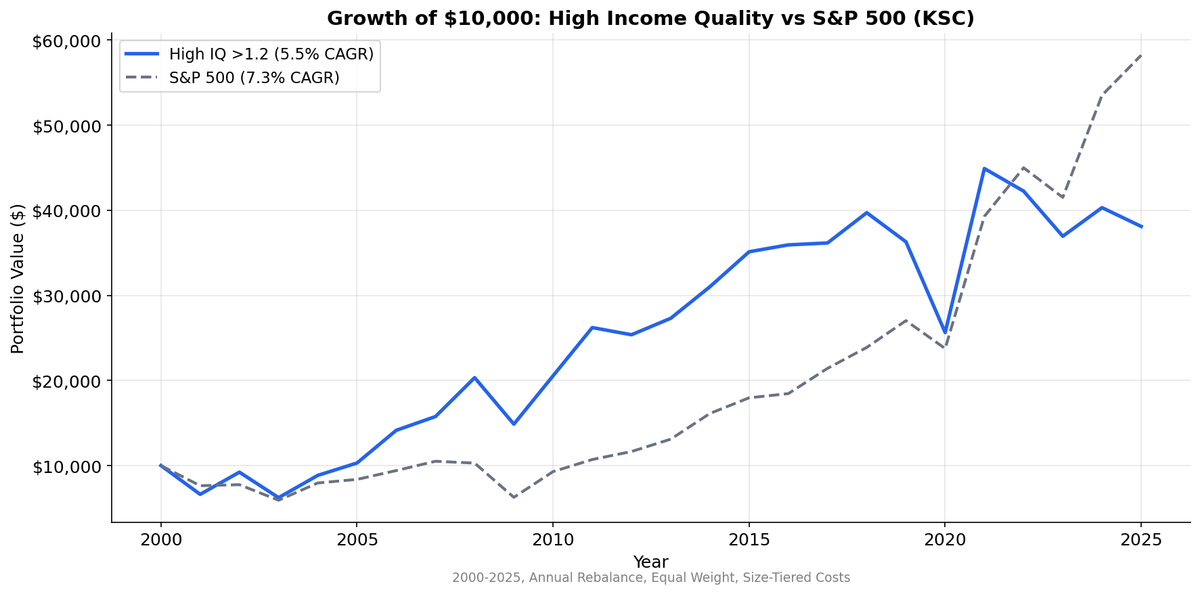
South Korea breaks the income quality playbook. In most markets, higher cash conversion predicts higher returns. On the KSC from 2000 to 2025, the medium income quality basket (OCF/NI between 0.5 and 1.2) returned 7.1% annually. The high quality basket (OCF/NI above 1.2) returned 5.5%. The stocks with the best cash conversion underperformed the middle of the pack by 1.6% per year.
Contents
- Method
- What We Found
- 25-Year Summary
- Why Medium Outperforms High
- The Low IQ Collapse
- Portfolio Characteristics
- Limitations
- Takeaway
That's backwards. The spread between high and low IQ is +4.1%, which looks healthy. But the outperformance comes from avoiding the worst stocks, not from picking the best ones. For the full screen logic and research background, see the US Income Quality post.
Data: FMP financial data warehouse, 2000–2025. Updated March 2026.
Method
| Parameter | Value |
|---|---|
| Universe | KSC (Korea Stock Exchange) |
| Market cap filter | > 500B KRW (~$370M USD) |
| Signal | Income Quality (OCF / Net Income) |
| Portfolios | High (IQ > 1.2), Medium (0.5-1.2), Low (IQ < 0.5) |
| Rebalancing | Annual (April 1) |
| Filing lag | 45 days (point-in-time) |
| Exclusions | Negative net income |
| Weighting | Equal weight within each group |
| Transaction costs | Size-tiered (0.1-0.5% per trade) |
| Benchmark | KOSPI (^KS11, KRW) |
| Period | 2000-2025 |
What We Found

25-Year Summary
| Metric | High IQ (>1.2) | Medium IQ (0.5-1.2) | Low IQ (<0.5) | KOSPI |
|---|---|---|---|---|
| CAGR | 6.1% | 7.4% | 1.6% | 4.4% |
| Volatility | 26.1% | — | — | 30.3% |
| Sharpe | 0.117 | — | — | 0.068 |
| Max Drawdown | -36.5% | — | — | -40.0% |
| Down Capture | 79.8% | — | — | 100% |
| Beta | 0.796 | — | — | 1.0 |
| Excess vs KOSPI | +1.61% | +2.95% | -2.84% | — |
| Win Rate | 64.0% | — | — | — |
| Avg Stocks | 87 | 32 | 36 | — |
The most striking result: medium IQ stocks beat high IQ stocks by 1.3% per year. This inverts the expected monotonic relationship. The signal still works as a filter against the bottom (low IQ returned just 1.6%, trailing KOSPI by -2.8%), but you'd have been better off buying the middle quality tier than the top.
Both high and medium beat the KOSPI. High IQ's +1.6% excess and medium's +3.0% excess show that income quality stocks outperformed the local benchmark. The KOSPI returned 4.4% CAGR, well below both quality tiers.
Why Medium Outperforms High
Korean corporate structure explains the inversion. The KSC is dominated by chaebols, the large industrial conglomerates (Samsung, Hyundai, SK, LG) that account for a disproportionate share of market cap and economic activity.
Chaebol subsidiaries often have extremely high cash conversion ratios. Parent companies route cash flows through subsidiaries via transfer pricing, internal transactions, and dividend pipelines. A subsidiary with an OCF/NI ratio of 2.0 or 3.0 isn't necessarily a better business. It might just be a cash conduit within a conglomerate structure. The high IQ basket fills with these entities.
Medium IQ companies (0.5 to 1.2) are more likely to be standalone businesses reinvesting their cash flows into growth. They convert earnings to cash at a reasonable rate but plow it back into capex, R&D, and working capital. In Korea's export-driven economy, that reinvestment drives future earnings growth. These companies grow faster than the cash-hoarding subsidiaries in the high IQ basket.
There's also a valuation dimension. Korean investors apply a "Korea discount" to conglomerate subsidiaries due to governance concerns, cross-shareholding complexity, and minority shareholder risk. High cash conversion doesn't translate into higher valuation multiples the way it does in the US or Europe. The market already discounts these names.
The Low IQ Collapse
The signal's real value in Korea isn't ranking the top. It's flagging the bottom.
Low income quality stocks (OCF/NI below 0.5) returned 1.4% annually, trailing the high IQ basket by 4.1% and SPY by 5.9%. These are companies where reported earnings aren't backed by cash. In Korea's accounting environment, which has historically had less transparency than US GAAP, low cash conversion is a louder warning signal.
Korean companies with accrual-heavy earnings are more exposed to write-downs, receivable impairments, and sudden profit revisions. The 2008 crisis and the 2015-2016 emerging market slowdown hit these names hardest. The pattern is consistent with what Sloan documented in the US: accruals reverse, and when they do, the stock price adjusts.
Portfolio Characteristics
The high IQ basket averages 92 stocks, providing broad diversification. But the medium basket holds only 33 names on average, and the low basket just 39. The tighter portfolio sizes in the medium and low baskets introduce more idiosyncratic risk.
Down capture of 98% means the high IQ portfolio offers almost no downside protection relative to SPY. Beta of 0.956 is close to 1.0. Korean equities move with global risk sentiment, and the income quality signal doesn't change that. The 2008 crisis and the 2020 COVID crash hit KSC stocks broadly regardless of cash conversion.
Limitations
Chaebol structure distorts the signal. Intra-group cash flows inflate OCF/NI for subsidiaries without reflecting genuine business quality. A sector-adjusted or standalone-company-only test would provide cleaner results.
Small medium and low baskets. With 33 and 39 average stocks respectively, single-name effects can move the basket-level returns materially. The medium IQ outperformance may partly reflect a few strong performers rather than a systematic pattern.
Currency exposure. Returns include KRW/USD movements. The won has been volatile over this period, with significant depreciation during crisis episodes. USD-denominated investors face currency risk that the backtest doesn't separate.
Korea discount. Governance and structural risks specific to Korean equities affect all three baskets. The signal is operating within a market that's structurally discounted relative to US peers, which limits absolute return comparisons.
Takeaway
Income quality on the KSC works as a filter, not a ranking tool. Avoiding low IQ stocks saves you from a 1.4% CAGR disaster. But the signal doesn't reward you for reaching into the top tier. Medium quality outperformed high quality by 1.6% per year, likely because Korea's chaebol structure inflates the cash conversion of subsidiaries that aren't actually better investments.
If you're screening Korean equities, use income quality as a floor (exclude IQ below 0.5) rather than a ceiling (don't over-weight IQ above 1.2). The signal's value here is in what it helps you avoid.
Data: Ceta Research, FMP financial data warehouse. Universe: KSC, market cap > 500B KRW. Annual rebalance (April), equal weight, 2000-2025. Benchmark: S&P 500 (SPY). Past performance does not guarantee future results.


