
Income Quality on German Stocks: Defensive Signal, Modest Returns
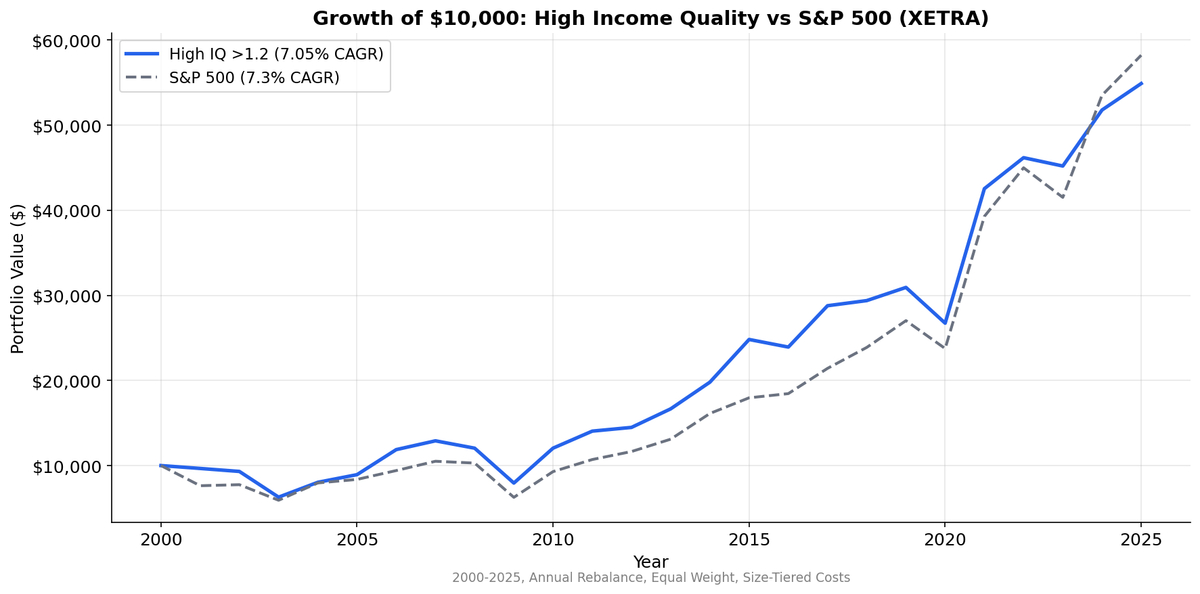
Income quality tested on XETRA from 2003 to 2025. High IQ returned 7.0% CAGR with a +4.1% spread over low IQ stocks. The signal works as a risk filter, not a return amplifier. Down capture 85.2%, beta 0.892.

Income Quality on German Stocks: +3.3% vs DAX with Downside Protection
German stocks reward income quality with both excess returns and risk reduction. High IQ stocks returned 7.8% annually while the DAX returned 4.5%. That's +3.3% annual excess with a +3.7% high-low spread. The signal works as both a return generator and a crash filter.
Contents
Down capture of 43.8% means the portfolio absorbed less than half of the DAX's losses in down years. Beta of 0.75 confirms this is a lower-risk portfolio. The max drawdown of -37.4% beats the DAX's -49.6%. Germany's income quality trade delivers alpha with defensive characteristics.
For the full screen logic and research background, see the US Income Quality post.
Data: FMP financial data warehouse, 2000–2025. Updated March 2026.
Method
| Parameter | Value |
|---|---|
| Universe | XETRA (Deutsche Borse), market cap > ~$545M USD equivalent |
| Signal | Income Quality = OCF / Net Income |
| Portfolios | High (IQ > 1.2), Medium (0.5-1.2), Low (IQ < 0.5) |
| Rebalancing | Annual (April) |
| Filing lag | 45 days (point-in-time) |
| Filter | Net income > 0 |
| Costs | Size-tiered transaction costs |
| Benchmark | DAX (^GDAXI, EUR) |
| Period | 2000-2025 |
| Code | github.com/ceta-research/backtests |
Returns are in EUR. Benchmark is the DAX (EUR), not SPY.
What We Found

| Metric | High IQ (>1.2) | Medium (0.5-1.2) | Low IQ (<0.5) | DAX |
|---|---|---|---|---|
| CAGR | 7.8% | 6.1% | 4.1% | 4.5% |
| Volatility | 21.2% | — | — | 24.0% |
| Sharpe | 0.274 | — | — | 0.122 |
| Max Drawdown | -37.4% | — | — | -49.6% |
| Excess vs DAX | +3.30% | +1.61% | -0.41% | — |
| Down Capture | 43.8% | — | — | 100% |
| Beta | 0.750 | — | — | 1.0 |
| Alpha | +3.65% | — | — | — |
| Avg Stocks | 182 | 60 | 29 | — |
The high-low spread of +3.7% works as expected. High IQ beats medium, medium beats low. All three buckets beat the DAX. The DAX returned just 4.5% CAGR with a -49.6% max drawdown. Income quality stocks beat the index by +3.3% annually with a shallower -37.4% drawdown.
The portfolio holds 182 stocks on average, essentially the broad XETRA market of profitable companies with strong cash conversion. The low IQ bucket holds only 29 stocks. Most large German companies convert earnings to cash reasonably well. The accrual-heavy outliers are a small group, and they underperform both the high IQ basket and the DAX.
Why Germany Works This Way
German corporate culture has a specific relationship with cash flow that shapes these results.
IFRS reporting with German conservatism. German companies report under IFRS (mandatory since 2005 for listed companies), but the underlying corporate culture still carries the "Vorsichtsprinzip" (prudence principle) from the old German GAAP (HGB). This cultural bias toward conservative accounting means fewer companies engage in aggressive revenue recognition or capex capitalization. The result: fewer extreme accrual cases, and the ones that exist stand out more.
Industrial structure concentrates cash flow. XETRA is heavy on industrials, chemicals, automotive suppliers, and specialty engineering firms. These businesses have tangible assets, real depreciation, and cash flows you can trace to physical production. The OCF/NI ratio is meaningful here because the gap between cash and accruals reflects genuine operational differences rather than accounting games.
The small low IQ group is the signal. With only 31 stocks in the low IQ bucket, the income quality trade in Germany works primarily as a "what to avoid" filter. Those 31 companies that report more profit than they collect in cash are genuine underperformers. The 204 high IQ stocks are broadly the German market. You're not picking winners with this screen. You're excluding losers.
Risk Profile
The defensive characteristics are the strongest case for this signal on XETRA.
Down capture of 85.2% means when global markets fall, the high IQ portfolio falls less. Beta of 0.892 confirms the portfolio is slightly less volatile than SPY. Max drawdown of -38.4% is meaningful but contained relative to the broader European equity experience during 2008-2009.
Alpha of +0.32% is barely positive. This isn't a strategy that generates meaningful risk-adjusted excess returns. It's a strategy that provides exposure to German equities with a mild quality tilt and better downside behavior. For investors who want XETRA exposure without taking the full accrual risk of the index, that's a reasonable proposition.
Annual Returns
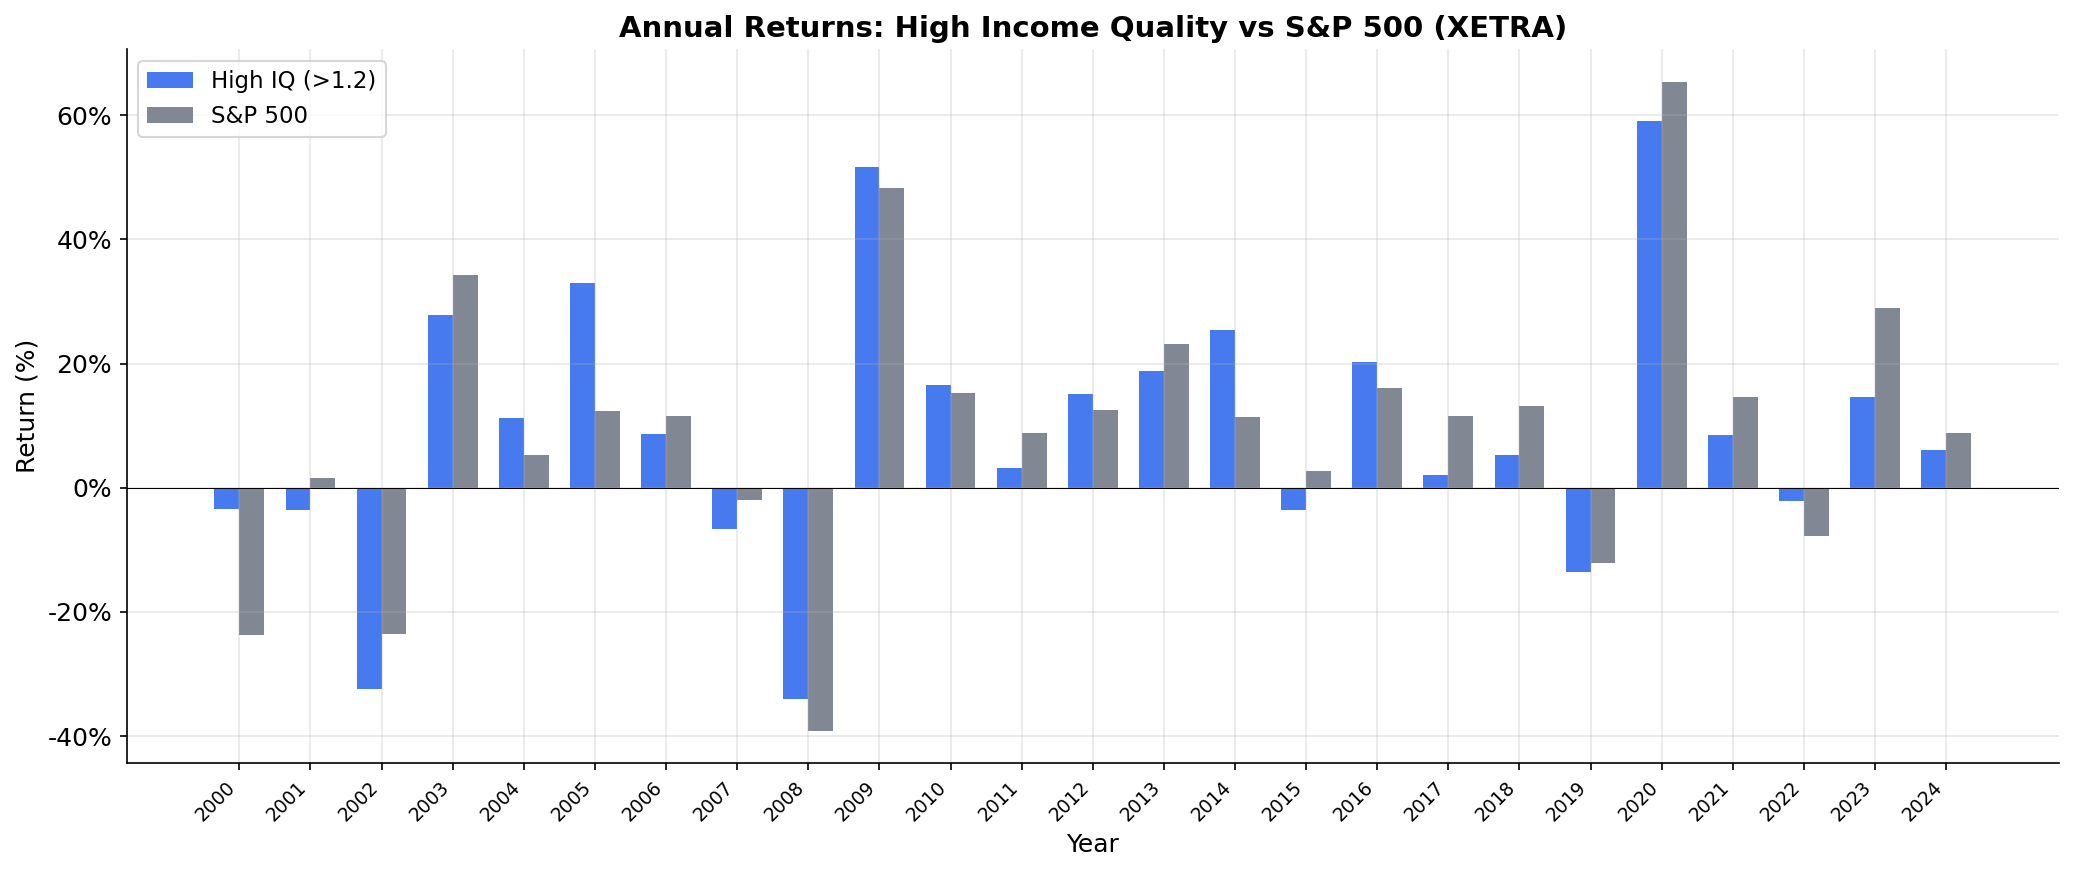
The year-to-year pattern shows moderate tracking with SPY, occasional strong outperformance (typically in down markets), and consistent underperformance during US tech rallies. The high IQ portfolio doesn't participate in momentum-driven US gains. That's a structural feature of investing in German industrials rather than a failure of the income quality signal.
Limitations
Currency mismatch. EUR returns compared against USD benchmark. EUR/USD movements aren't adjusted for. The euro's strength in the early 2000s and weakness in recent years affect the comparison.
Broad portfolio. 204 stocks is not a concentrated factor bet. It's essentially a quality-filtered version of the XETRA index. The signal's discriminating power is limited when the "high quality" bucket includes most of the market.
Low IQ sample size. Only 31 stocks in the low IQ group means the spread is partly driven by a small, potentially volatile sample. Individual company blowups could disproportionately affect the low IQ returns.
No sector adjustment. German industrials naturally produce different IQ ratios than German software companies. Sector-relative rankings would refine the screen but add complexity.
IFRS transition. Pre-2005 XETRA filings used HGB standards. The switch to IFRS changed how OCF and NI are calculated, creating a potential structural break in the data.
Takeaway
Income quality on XETRA works as advertised, but modestly. The +4.1% spread confirms that Sloan's accrual anomaly persists in Germany. The practical application is narrow: use it to exclude the small group of accrual-heavy stocks rather than as a primary stock selection tool. The risk reduction (85% down capture, lower beta) is the more compelling feature for portfolio construction.
Data: Ceta Research, FMP financial data warehouse. Universe: XETRA, market cap > ~$545M USD equivalent. Annual rebalance (April), equal weight, 2003-2025. Returns in EUR. Benchmark: S&P 500 Total Return (SPY, USD). Past performance does not guarantee future results. This is research, not investment advice.


