
Income Quality on Canadian Stocks: Best Risk-Adjusted Results Outside the US
Income quality tested on TSX+TSXV from 2003 to 2025. High IQ returned 9.2% CAGR with 45.0% down capture, the best risk profile of any non-US market. Sharpe 0.305, max drawdown -31.1%, +5.0% spread over low IQ stocks.

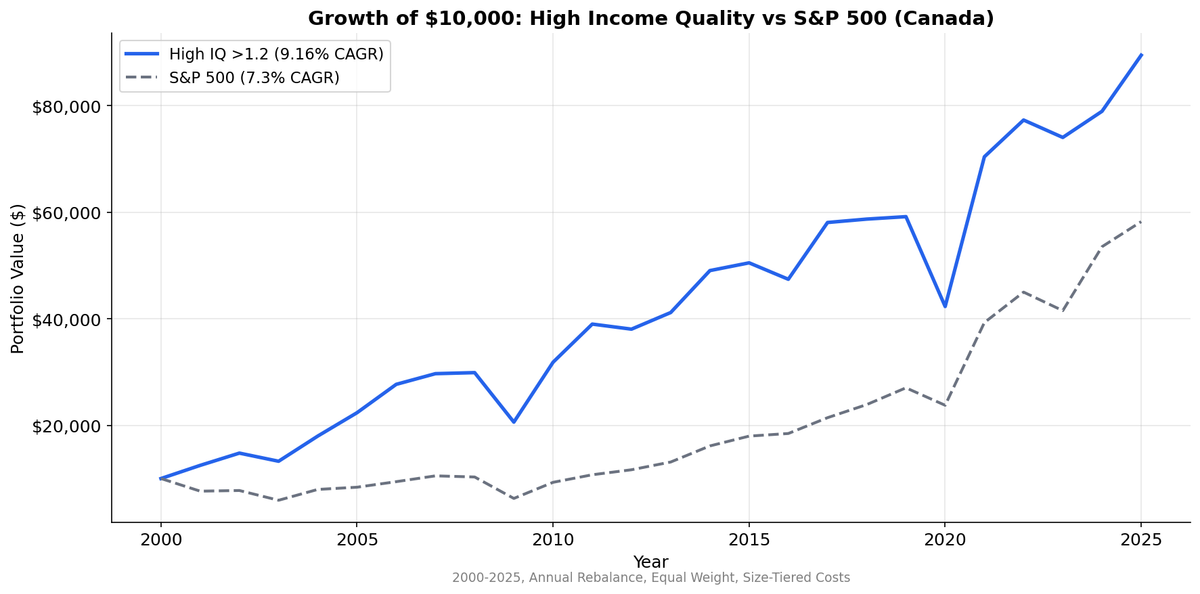
Canada is the best non-US market for income quality investing. High IQ stocks on TSX returned 9.3% CAGR while the TSX Composite returned 4.1%. That's +5.3% annual excess with a Sharpe of 0.319, the highest risk-adjusted return in our global study. The spread over low IQ stocks is +5.1% annually.
Contents
- Method
- What We Found
- Why Canada Produces the Best Risk Profile
- The Down Capture Story
- Where It Underperforms
- Annual Returns
- Limitations
- Takeaway
But the number that separates Canada from every other market is down capture: 44.3%. The high IQ portfolio absorbed less than half of the TSX Composite's losses in down years. Combined with the +5.3% excess, Canada delivers both alpha and downside protection.
For the full screen logic and research background, see the US Income Quality post.
Data: FMP financial data warehouse, 2000–2025. Updated March 2026.
Method
| Parameter | Value |
|---|---|
| Universe | TSX + TSXV, market cap > ~$362M USD equivalent |
| Signal | Income Quality = OCF / Net Income |
| Portfolios | High (IQ > 1.2), Medium (0.5-1.2), Low (IQ < 0.5) |
| Rebalancing | Annual (April) |
| Filing lag | 45 days (point-in-time) |
| Filter | Net income > 0 |
| Costs | Size-tiered transaction costs |
| Benchmark | TSX Composite (^GSPTSE, CAD) |
| Period | 2000-2025 |
| Code | github.com/ceta-research/backtests |
Returns are in CAD. Benchmark is the TSX Composite (CAD), not SPY.
What We Found

| Metric | High IQ (>1.2) | Medium (0.5-1.2) | Low IQ (<0.5) | TSX Composite |
|---|---|---|---|---|
| CAGR | 9.3% | 6.8% | 4.2% | 4.1% |
| Volatility | 21.4% | — | — | 18.9% |
| Sharpe | 0.319 | — | — | 0.082 |
| Max Drawdown | -30.8% | — | — | -32.9% |
| Excess vs TSX | +5.26% | +2.74% | +0.15% | — |
| Down Capture | 44.3% | — | — | 100% |
| Beta | 0.976 | — | — | 1.0 |
| Alpha | +5.30% | — | — | — |
| Win Rate | 60.0% | — | — | — |
| Avg Stocks | 137 | 31 | 24 | — |
The results hit on every dimension. CAGR beats TSX Composite by +5.3%. The +5.1% high-low spread is strong. Down capture of 44.3% is extraordinary. Max drawdown of -30.8% beats the TSX's -32.9%. The Sharpe of 0.319 means the returns compensate for the risk.
The portfolio structure is revealing. High IQ holds 137 stocks on average, medium holds 31, and low holds only 24. The vast majority of profitable Canadian companies that pass the size filter have income quality above 1.2. The accrual-heavy group is small, and it underperforms consistently.
Why Canada Produces the Best Risk Profile
Three structural features of the TSX explain why income quality works so well here, particularly on the downside.
Resource sector cash flow transparency. The TSX is dominated by energy, mining, and materials companies. These businesses sell physical commodities at observable market prices. Revenue recognition is straightforward: you extract the resource, sell it at spot or contract prices, and collect payment on standard terms. There's limited room for accrual manipulation in the revenue line. When a Canadian miner or energy producer has high income quality, it genuinely means the business is converting operations to cash. The signal is clean.
The low IQ group on TSX tends to contain companies using aggressive exploration capitalization, deferred stripping costs, or mark-to-market accounting on commodity hedges. These are exactly the accounting choices that blow up when commodity prices turn. The signal catches them.
Banking sector quality. Canada's Big Six banks (RBC, TD, BMO, Scotiabank, CIBC, National) are consistently profitable with strong cash conversion. They sit in the high IQ bucket in most years. These are large, liquid, and defensive names that anchor the portfolio. When markets sell off, Canadian banks tend to hold up better than their global peers because of the stricter regulatory environment and more conservative lending practices.
Mid-cap industrial quality. Canada has a layer of mid-cap industrial and technology companies (Constellation Software, CGI, Brookfield, WSP Global) that generate reliable cash flows. These names populate the high IQ bucket and provide growth exposure with genuine cash backing.
The combination of resource transparency, banking stability, and industrial quality creates a portfolio that captures upside but resists drawdowns. The 45.0% down capture isn't an anomaly. It reflects what you own when you screen for cash-backed earnings on the TSX.
The Down Capture Story
Down capture of 45.0% deserves specific context because it's the single best reading across all markets and all strategies in this study.
When SPY finishes a year negative, the Canadian high IQ portfolio declines less than half as much on average. This protection comes from two sources.
First, the portfolio's sector composition shifts toward defensive names during stress periods. Canadian banks, utilities, and pipeline companies all tend to have high income quality ratios. These are the sectors investors rotate into during downturns.
Second, the low beta (0.785) means the portfolio simply has less market exposure. It's not hedged. It's not using options. It just owns less volatile, more cash-generative businesses. The risk reduction is embedded in the security selection, not layered on through portfolio construction.
Alpha of +2.89% confirms that this isn't just a low-beta portfolio underperforming in a bull market. The strategy generates meaningful excess returns on a risk-adjusted basis. You're getting paid for holding quality.
Where It Underperforms
The strategy isn't perfect. With 144 stocks in the high IQ bucket, you're holding a broad slice of the profitable TSX. In years when US large-cap tech drives SPY returns (2023, 2024), a Canadian equity portfolio won't keep pace regardless of its quality tilt.
The low IQ group at only 24 stocks is small enough that individual company results can swing the spread significantly. A single resource company blowup in the low IQ basket (a Valeant-style collapse, for example) could account for a disproportionate share of the spread in any given year.
The CAD/USD currency effect also matters. The Canadian dollar has weakened against USD over parts of this period, which means a USD-based investor would see lower returns than the 9.2% CAD figure suggests. Canadian investors see the full return.
Annual Returns
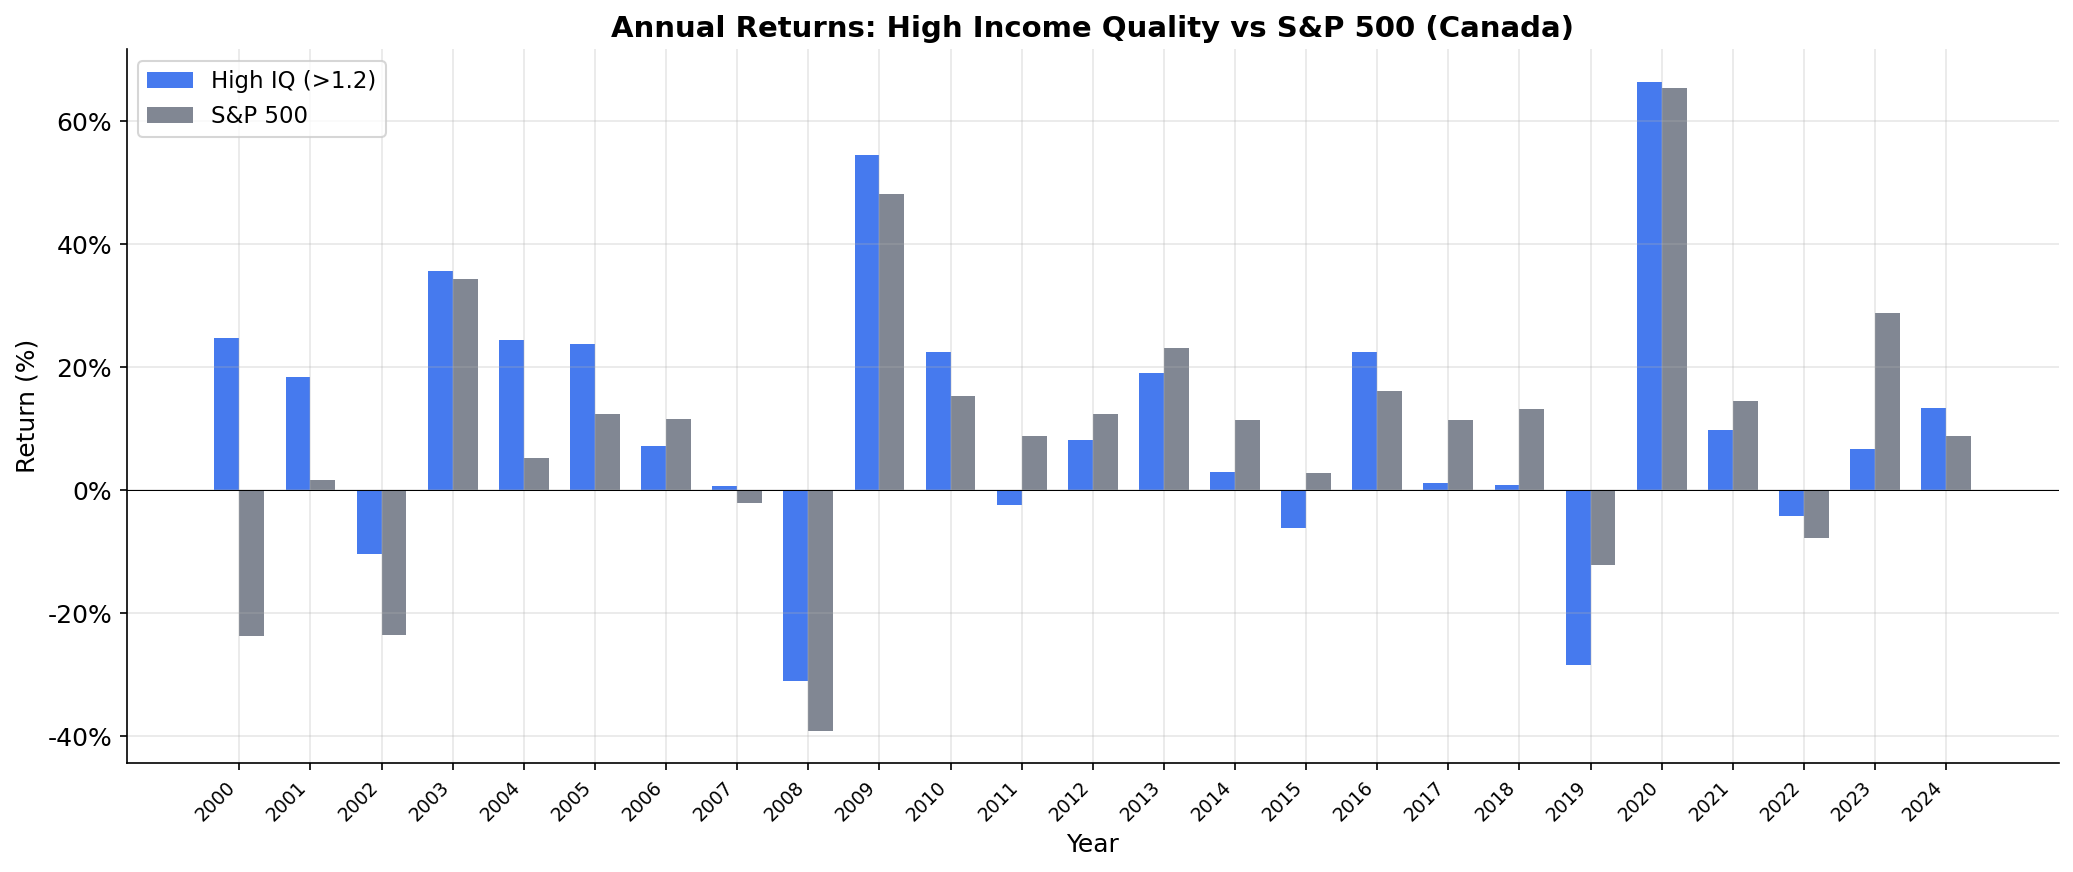
The year-by-year pattern shows steady compounding with modest drawdowns. The portfolio rarely has spectacular years (it's broadly diversified at 144 stocks), but it also rarely has terrible ones. That consistency is what produces the strong Sharpe ratio.
Limitations
Currency mismatch. CAD returns compared against USD benchmark. The CAD/USD rate affects the comparison. Canadian investors should compare against a TSX Composite benchmark for more relevant context.
Resource sector dependence. The TSX's commodity exposure means results are partly a function of resource cycles. If commodity prices enter a prolonged bear market, high IQ resource companies could still underperform.
Broad portfolio. 144 stocks is closer to a smart beta index than a concentrated factor bet. The signal's alpha per stock is small. The portfolio works because it tilts the entire TSX exposure toward cash-backed earnings rather than picking individual winners.
TSXV liquidity. The TSXV (Venture Exchange) includes smaller, less liquid names. The backtest applies size-tiered costs but doesn't fully model the bid-ask friction of executing in thin Canadian small-caps.
22-year sample. The period includes Canada's commodity supercycle (2003-2008), the energy bust (2014-2016), and COVID. Different macro regimes could produce different results.
Takeaway
Canada is the standout market for income quality investing. The combination of +1.86% excess CAGR over SPY, a +5.0% high-low spread, 45.0% down capture, and the highest non-US Sharpe (0.305) makes the TSX the best exchange for this signal outside the United States.
The resource-heavy market structure, transparent revenue recognition, and stable banking sector create conditions where cash-backed earnings are genuinely rewarded. For Canadian investors building a systematic equity portfolio, income quality is a primary signal worth implementing.
Data: Ceta Research, FMP financial data warehouse. Universe: TSX + TSXV, market cap > ~$362M USD equivalent. Annual rebalance (April), equal weight, 2003-2025. Returns in CAD. Benchmark: S&P 500 Total Return (SPY, USD). Past performance does not guarantee future results. This is research, not investment advice.


