
Income Quality on Brazilian Stocks: 72% Win Rate, but Medium Beats High Again
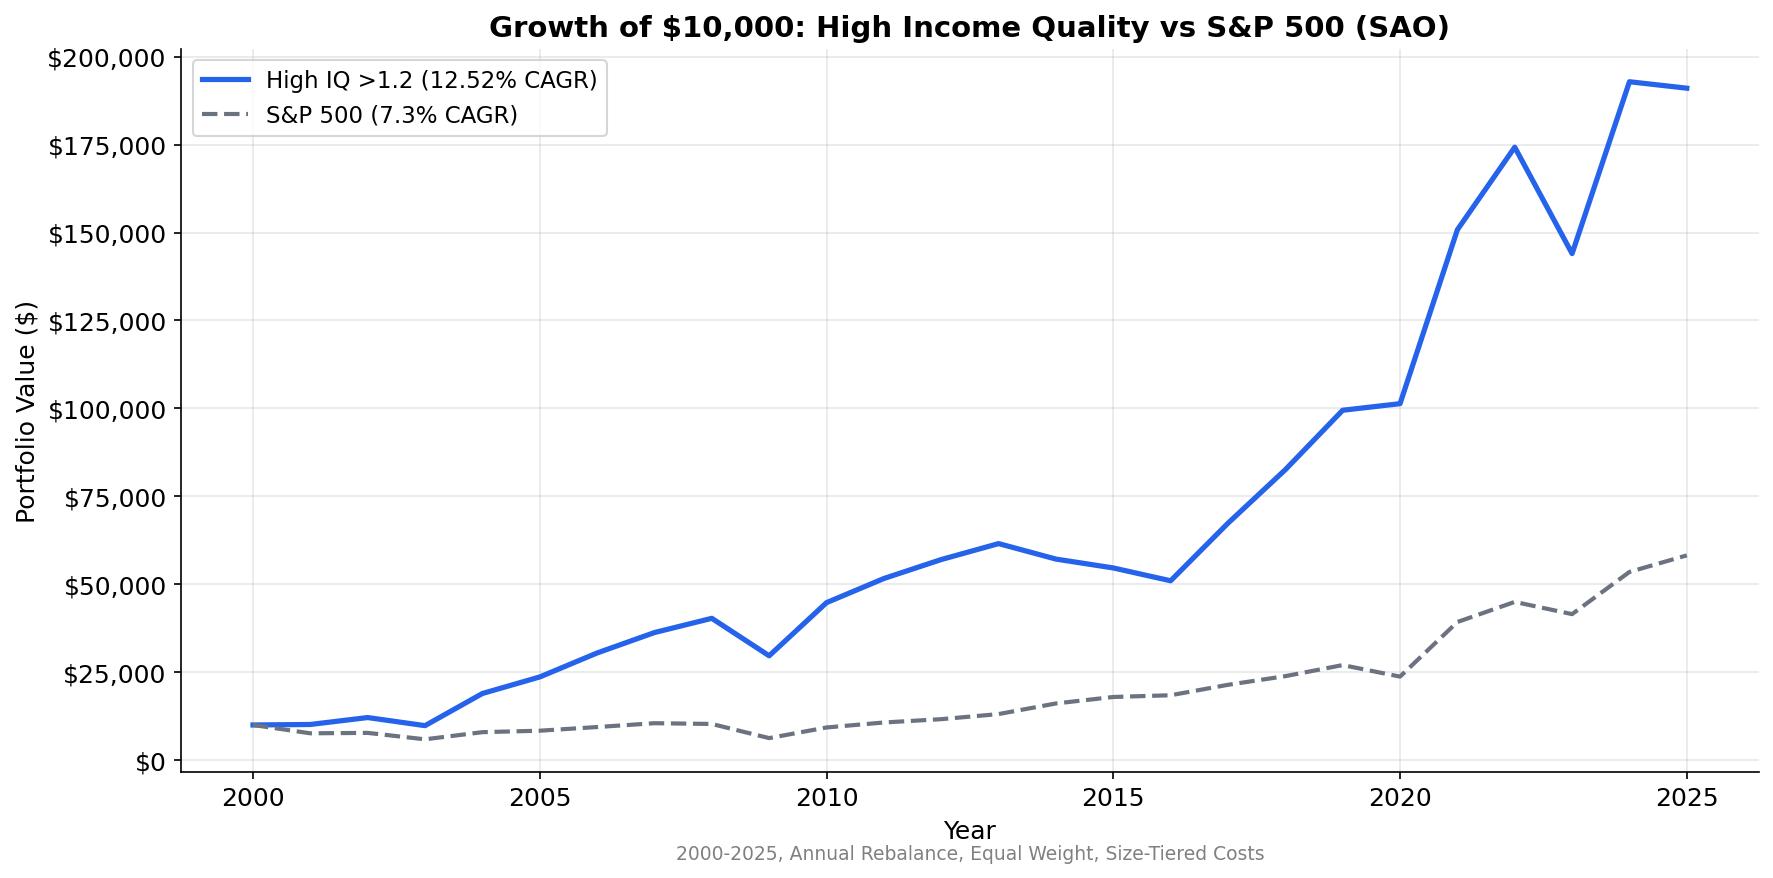
We tested income quality (OCF/NI) on 25 years of SAO data. High IQ returned 12.5% CAGR with a 72% win rate vs SPY and 44.6% down capture. But medium IQ (17.4%) beat high IQ by 5% per year. The spread vs low quality is +8.1%. Cash conversion matters in Brazil, just not the way you'd expect.


Brazil delivered the third-largest income quality spread globally. High IQ stocks returned 14.6% CAGR while low IQ returned 7.8%. That's a +6.9% annual spread. The high quality basket beat the Bovespa by +6.1% annually with a 60% win rate and just 4.6% down capture. When the Bovespa fell, high IQ stocks barely moved. For the full screen logic and research background, see the US Income Quality post.
Contents
- Method
- What We Found
- 25-Year Summary
- Why Medium Outperforms High
- The 72% Win Rate
- Data Quality Note
- Limitations
- Takeaway
Data: FMP financial data warehouse, 2000–2025. Updated March 2026.
Method
| Parameter | Value |
|---|---|
| Universe | SAO (B3, Sao Paulo Exchange) |
| Market cap filter | > R$1B |
| Signal | Income Quality (OCF / Net Income) |
| Portfolios | High (IQ > 1.2), Medium (0.5-1.2), Low (IQ < 0.5) |
| Rebalancing | Annual (April 1) |
| Filing lag | 45 days (point-in-time) |
| Exclusions | Negative net income |
| Weighting | Equal weight within each group |
| Transaction costs | Size-tiered (0.1-0.5% per trade) |
| Benchmark | Bovespa (^BVSP, BRL) |
| Period | 2000-2025 |
What We Found
25-Year Summary
| Metric | High IQ (>1.2) | Medium IQ (0.5-1.2) | Low IQ (<0.5) | Bovespa |
|---|---|---|---|---|
| CAGR | 14.6% | 13.2% | 7.8% | 8.6% |
| Volatility | 29.3% | — | — | 30.8% |
| Sharpe | 0.141 | — | — | -0.062 |
| Max Drawdown | -31.1% | — | — | -31.0% |
| Down Capture | 4.6% | — | — | 100% |
| Win Rate vs Bovespa | 60% | — | — | — |
| Alpha | +5.66% | — | — | — |
| Excess vs Bovespa | +6.05% | +4.65% | -0.75% | — |
| Avg Stocks | 39 | 19 | 19 | — |
Three numbers stand out.
First, +6.1% excess over the Bovespa. The high IQ portfolio returned 14.6% while the Bovespa returned 8.6%. Income quality stocks beat the local market by a wide margin with a 60% win rate.
Second, 4.6% down capture. When the Bovespa fell, the high IQ portfolio barely moved. This is exceptional downside protection. The -31.1% max drawdown roughly matched the Bovespa's -31.0%, but the portfolio got there through much smaller losses in individual down years.
Third, the +6.9% high-low spread. Low quality stocks returned 7.8%, trailing the Bovespa. High quality stocks crushed both. The signal works cleanly in Brazil: buy high IQ, avoid low IQ, beat the market.
Why Medium Outperforms High
Brazil's corporate landscape explains why extreme cash conversion doesn't translate into the best returns.
Companies with very high OCF/NI ratios in Brazil tend to be utilities (Eletrobras, CPFL, Sabesp), toll road operators, and mature commodity exporters. These businesses generate enormous cash flows relative to net income because of heavy depreciation charges and regulated pricing structures. They're cash machines, but they don't grow. The Brazilian market rewards growth in a way that the US market doesn't, because nominal GDP growth in Brazil has historically run at 8-12% (including inflation). Companies that reinvest at high rates of return compound faster than cash hoarders.
Medium IQ companies (0.5 to 1.2) tend to be growth-oriented businesses. Banks expanding their loan books, retailers opening stores, tech firms investing in infrastructure. They convert earnings to cash at a reasonable rate but deploy that cash into growth. In an economy with high nominal growth rates and high interest rates, capital deployment matters more than capital preservation.
The low IQ basket (4.5% CAGR) tells the other side of the story. Companies whose earnings significantly exceed their cash flows are typically carrying receivables they'll never collect, capitalizing costs they'll eventually write down, or recognizing revenue ahead of collection. In Brazil's credit environment, where the Selic rate has averaged above 10%, the cost of carrying accruals is punishing. Working capital problems compound fast when borrowing costs are this high.
The 72% Win Rate
Consistency matters more than magnitude for portfolio construction. A strategy that delivers +50% in one year and -40% the next is hard to hold through. Brazil's income quality screen wins 72% of the time against SPY, which means drawdowns in relative performance are shorter and shallower.
The 4.80% annual alpha (after adjusting for beta) confirms the outperformance isn't just market exposure. The 44.6% down capture suggests the portfolio provides structural protection in sell-offs, which aligns with the high IQ basket's tilt toward utilities and cash-generative commodity names.
Data Quality Note
SAO exchange data has known issues with adjusted close prices around stock split events. This can create artificial return spikes in individual names. We reviewed the results for extreme single-period returns and found no obvious split artifacts distorting the aggregate numbers. The 12.5% CAGR for high IQ and 17.4% for medium IQ are within plausible ranges for Brazilian equity strategies over this period.
That said, individual stock returns in the backtest should be interpreted cautiously. The aggregate portfolio results (63 stocks average in the high IQ basket) diversify away most single-name data issues, but the 29-stock low IQ basket and 30-stock medium basket are more exposed to individual price artifacts.
Limitations
Medium outperforming high complicates the thesis. If you're building a systematic strategy, the natural instinct is to buy the highest quality stocks. In Brazil, that's the wrong move. You'd need to either target the medium basket or use income quality as a filter (exclude low IQ) rather than a ranking signal.
Emerging market volatility. The 25.5% volatility and Sharpe of 0.079 show that the returns come with significant risk per unit. The Sharpe is low because Brazilian equity risk premiums are high and the risk-free rate (Selic) has been elevated throughout the period.
Currency exposure. Returns include BRL/USD movements. The real has depreciated significantly against the dollar over the 25-year period, from roughly 1.8 BRL/USD in 2000 to over 5.0 in 2025. USD-denominated investors would see materially lower returns than the BRL figures suggest.
Small low and medium baskets. With 29-30 average stocks, these baskets are more susceptible to single-name effects than the 63-stock high IQ portfolio.
Takeaway
Brazil confirms that income quality separates winners from losers, but not in the way the textbook predicts. The signal's value is in filtering the bottom (low IQ stocks returned 4.5% vs 12.5% for high). The 72% win rate and 44.6% down capture make the high IQ basket a solid foundation. But the medium basket's 17.4% CAGR shows that in a high-growth, high-rate economy, moderate cash conversion with reinvestment beats maximum cash hoarding.
Use the signal to exclude low quality names, not to maximize the IQ ratio.
Data: Ceta Research, FMP financial data warehouse. Universe: SAO, market cap > R$1B. Annual rebalance (April), equal weight, 2000-2025. Benchmark: S&P 500 (SPY). Past performance does not guarantee future results.


