
High Dividend Yield Screen on UK Stocks: 7.63% CAGR (LSE Backtest)
We backtested a high dividend yield screen with quality filters on UK stocks (LSE) from 2000-2025. 7.63% CAGR with +6.77% annual excess over the FTSE 100. The quality filters multiplied the index return nearly nine-fold.


We ran the same high dividend yield quality screen on UK stocks (LSE) from 2000 to 2025. The result: 7.63% CAGR with +6.77% annual excess over the FTSE 100, and +7.23% Jensen's alpha. The UK has one of the strongest dividend cultures in the world, and the strategy beat the FTSE in 72% of years. While UK equities broadly underperformed US equities over this period, the strategy multiplied the FTSE's return by roughly 9x.
Contents
- Method
- Results
- Annual Returns
- The UK Dividend Story
- When It Works
- When It Struggles
- Limitations
- Part of a Series
- References
Data: FMP financial data warehouse, 2000-2025. Updated May 2026.
Method
Data source: Ceta Research (FMP financial data) Universe: LSE-listed stocks with market cap > 500M GBP (~$635M USD) Period: 2000-2025 (25 years) Rebalancing: Annual (July) Execution: Next-day close (MOC) Benchmark: FTSE 100 (^FTSE)
Same signal as the US analysis: dividend yield 4-15%, payout 0-80%, FCF > 0, ROE > 8%, D/E < 2.0. Top 30 by yield, equal weight.
Results
| Metric | Strategy | FTSE 100 |
|---|---|---|
| CAGR | 7.63% | 0.86% |
| Total Return | 529% | -- |
| Max Drawdown | -34.15% | -39.85% |
| Sharpe Ratio | 0.221 | -0.202 |
| Sortino Ratio | 0.439 | -- |
| Win Rate (vs FTSE) | 72% | -- |
| Up Capture | 186.1% | -- |
| Down Capture | 56.7% | -- |
| Beta | 1.173 | -- |
| Alpha (Jensen) | +7.23% | -- |
| Cash Periods | 1/25 (4%) | -- |
| Avg Stocks | 13.2 | -- |
The +7.23% Jensen's alpha is the second-highest in our global study (after Hong Kong's +8.26%). Up capture of 186% means the portfolio nearly doubled the FTSE's gains in positive years; down capture of 57% means it absorbed only half the FTSE's losses in down years. The 72% win rate confirms this isn't a few outlier years driving the result.
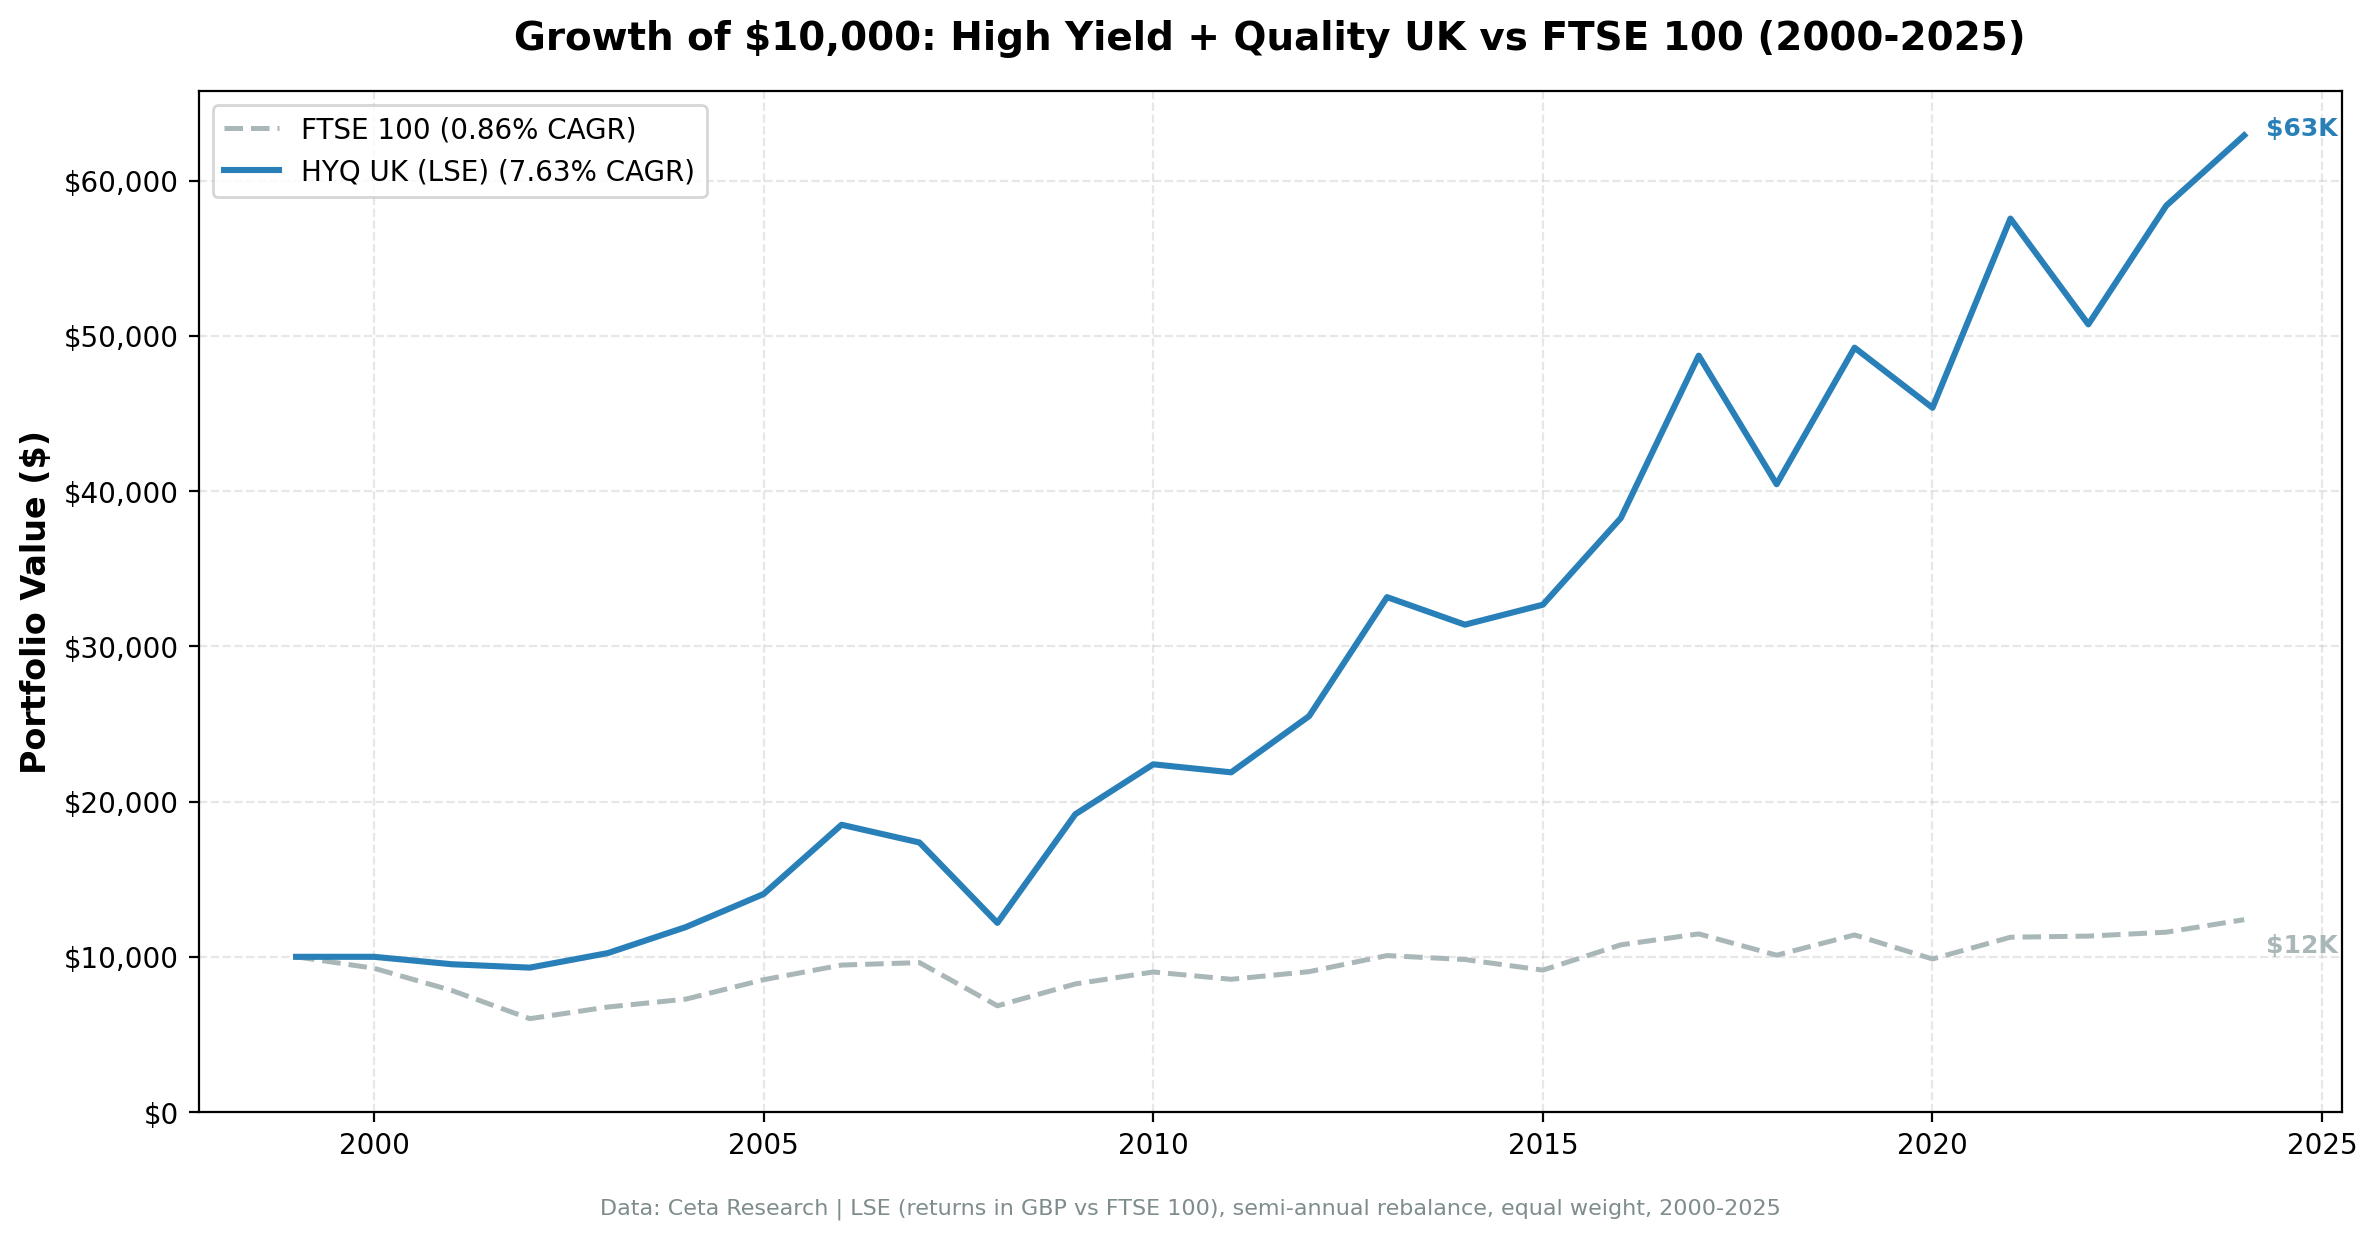
The FTSE 100 itself returned just 0.86% annualized over 25 years, a flat market by global standards. Against that drag, the quality dividend screen produced 7.63% CAGR. The strategy turned $10,000 into roughly $62,900, vs the FTSE's roughly $12,400.
Annual Returns
| Year | Strategy | FTSE 100 | Excess |
|---|---|---|---|
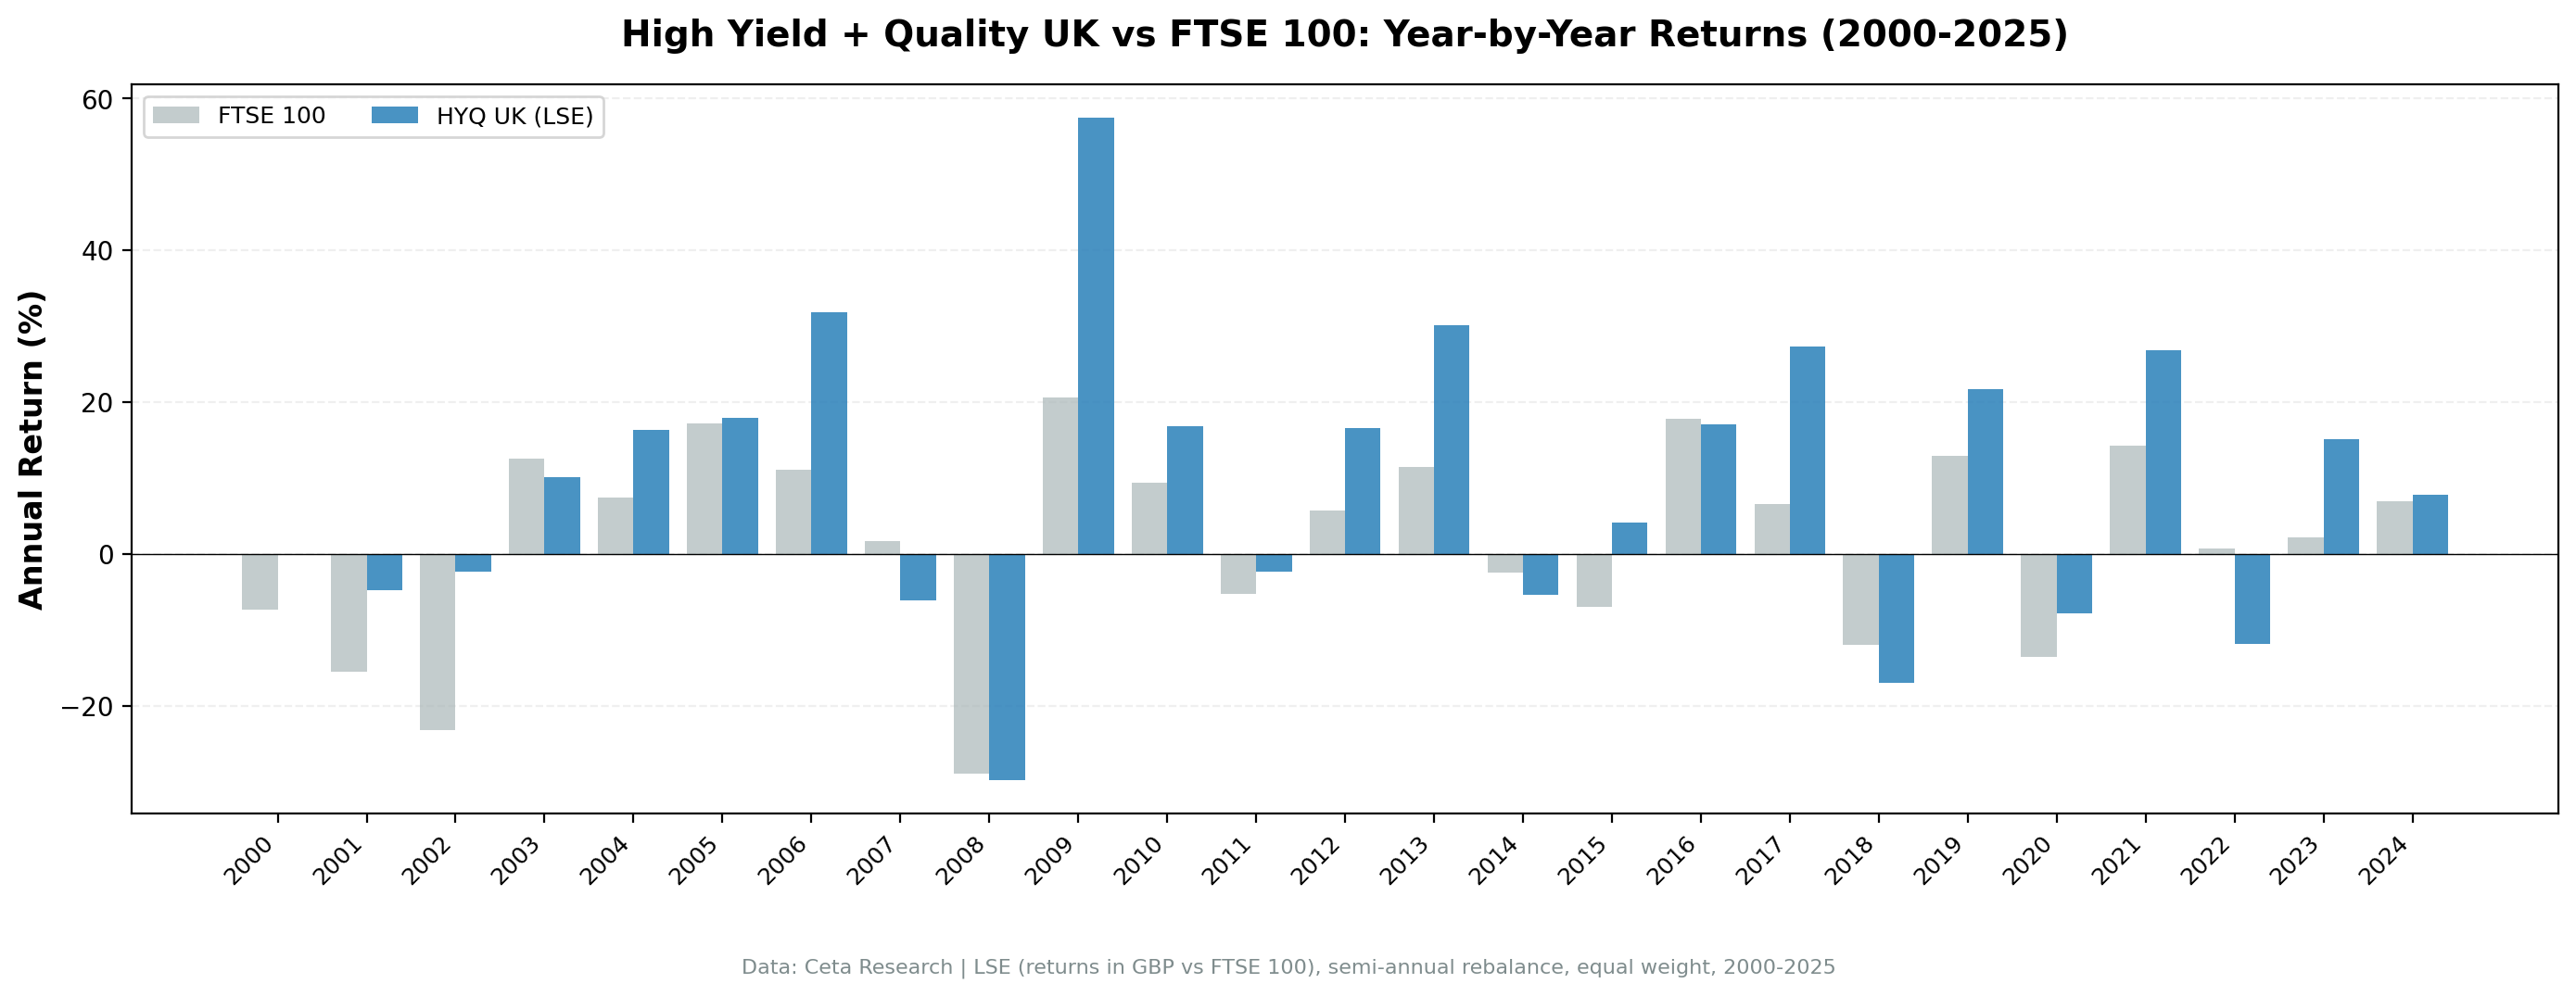
| 2000 | 0.0% (cash) | -7.4% | +7.4% |
| 2001 | -4.8% | -15.5% | +10.7% |
| 2002 | -2.3% | -23.2% | +20.9% |
| 2003 | +10.1% | +12.5% | -2.4% |
| 2004 | +16.3% | +7.5% | +8.9% |
| 2005 | +17.9% | +17.2% | +0.7% |
| 2006 | +31.8% | +11.1% | +20.7% |
| 2007 | -6.2% | +1.7% | -7.8% |
| 2008 | -29.8% | -28.9% | -0.9% |
| 2009 | +57.5% | +20.6% | +36.9% |
| 2010 | +16.8% | +9.3% | +7.4% |
| 2011 | -2.3% | -5.2% | +2.9% |
| 2012 | +16.5% | +5.8% | +10.8% |
| 2013 | +30.1% | +11.5% | +18.6% |
| 2014 | -5.3% | -2.5% | -2.8% |
| 2015 | +4.1% | -6.9% | +11.0% |
| 2016 | +17.1% | +17.8% | -0.7% |
| 2017 | +27.4% | +6.5% | +20.8% |
| 2018 | -17.0% | -11.9% | -5.0% |
| 2019 | +21.8% | +12.9% | +8.8% |
| 2020 | -7.9% | -13.6% | +5.7% |
| 2021 | +26.9% | +14.2% | +12.7% |
| 2022 | -11.8% | +0.7% | -12.5% |
| 2023 | +15.1% | +2.2% | +12.9% |
| 2024 | +7.8% | +7.0% | +0.8% |
The UK Dividend Story
The UK has historically been one of the world's highest-yielding stock markets. FTSE 100 yields have regularly exceeded 3.5%, far above S&P 500 averages. Shell, BP, HSBC, Unilever, and GlaxoSmithKline are staples of income portfolios globally.
High yields in the UK partly reflect low growth expectations. UK GDP growth has lagged the US, and UK equities have de-rated over the past decade. The FTSE 100 in 2025 is only modestly above its 2000 level in price terms, though total returns including dividends are better.
Against that backdrop, the quality screen's +6.77% excess return is the second-largest in our global study. The FTSE 100 returned just 0.86% annualized, and the quality filters multiplied that nearly nine-fold.
When It Works
2002 (dot-com bust): -2.3% while the FTSE fell -23.2%. A 21-point excess. UK dividend payers held up sharply during the equity capitulation.
2006: +31.8% vs FTSE +11.1%. Pre-crisis dividend-and-financials rally.
2009 (recovery): +57.5%, beating the FTSE by 36.9 points. Quality dividend payers bounced as credit markets normalized. The largest single-year excess in this study.
2012-2013: Back-to-back blowout years, beating the FTSE by 10.8 and 18.6 points respectively. The quality tilt paid off as UK large-caps stagnated.
2017: +27.4%, beating the FTSE by 20.8 points. UK midcap and quality names ran while the FTSE 100 lagged.
2021: +26.9% vs +14.2%. Post-COVID reflation rewarded high-yield value names.
2023: +15.1% vs FTSE +2.2%. Another double-digit excess year as the FTSE flat-lined.
When It Struggles
2007: -6.2% vs FTSE +1.7%. The strategy started feeling early credit-cycle stress before the broader index.
2018: -17.0% vs FTSE -11.9%. Brexit uncertainty hit dividend-heavy financials and consumer staples disproportionately.
2022: -11.8% vs FTSE +0.7%. The FTSE 100's heavy energy/commodities weighting bailed out the index that year; the quality screen underweighted oil & gas and missed the rally.
Limitations
FTSE stagnation: The UK benchmark's low return (0.86% CAGR) makes the strategy's excess look large. In absolute terms, 7.63% is modest compared to US or Asian markets.
Beta > 1: Despite the defensive narrative, the portfolio's 1.17 beta to the FTSE means it amplifies rather than dampens market moves. The alpha comes from stock selection, not from low market exposure.
Brexit effects: The 2016-2020 period introduced unusual currency and political volatility. GBP weakened significantly, which inflates returns in local terms but dilutes them in USD.
Sector composition: UK high-yield portfolios lean heavily toward energy (Shell, BP), financials (HSBC, Lloyds), and pharma (GSK, AstraZeneca). Sector-specific risks dominate.
Data: Ceta Research (FMP financial data warehouse). Universe: LSE, market cap > 500M GBP. Backtest: 2000-2025, annual July rebalance, next-day close execution (MOC). Past performance does not guarantee future results.
Part of a Series
This is the UK analysis. See also: - High Yield Quality on US Stocks - 10.52% CAGR, full methodology - High Yield Quality Across Global Exchanges - full comparison
References
- Fama, E. & French, K. (1998). "Value versus Growth: The International Evidence." Journal of Finance, 53(6), 1975-1999.


