
High Dividend Yield Screen on Canadian Stocks: 6.29% CAGR (TSX Backtest)
We backtested a high dividend yield screen with quality filters on Canadian stocks (TSX) from 2000-2025. 6.29% CAGR with +1.86% annual excess over the TSX Composite and a 60% win rate.

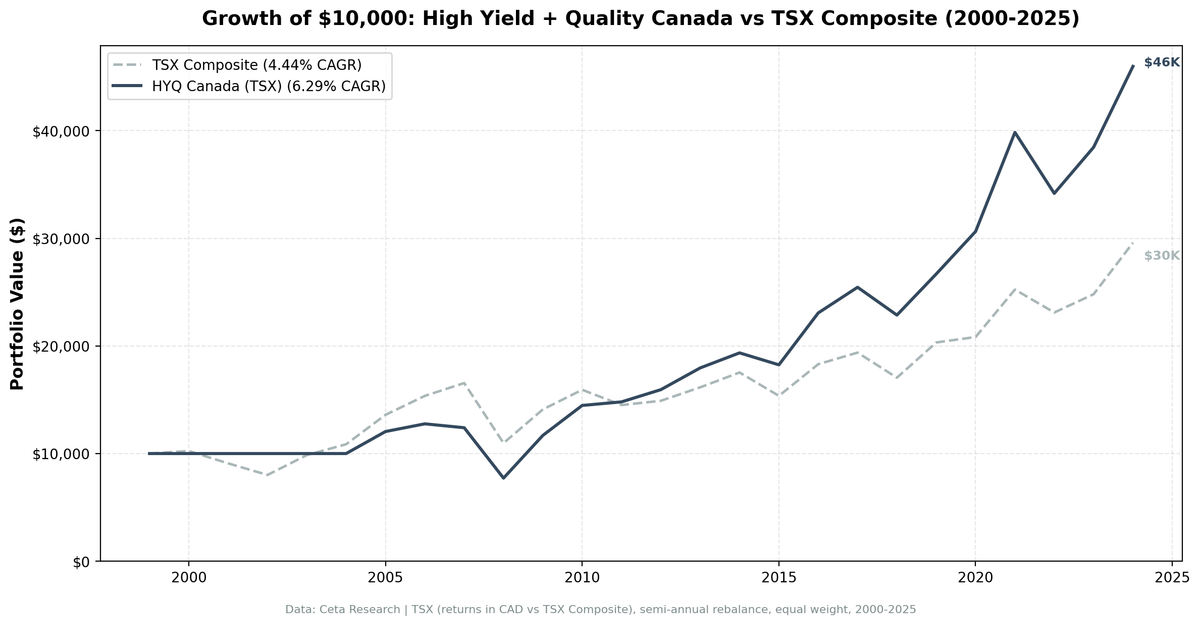
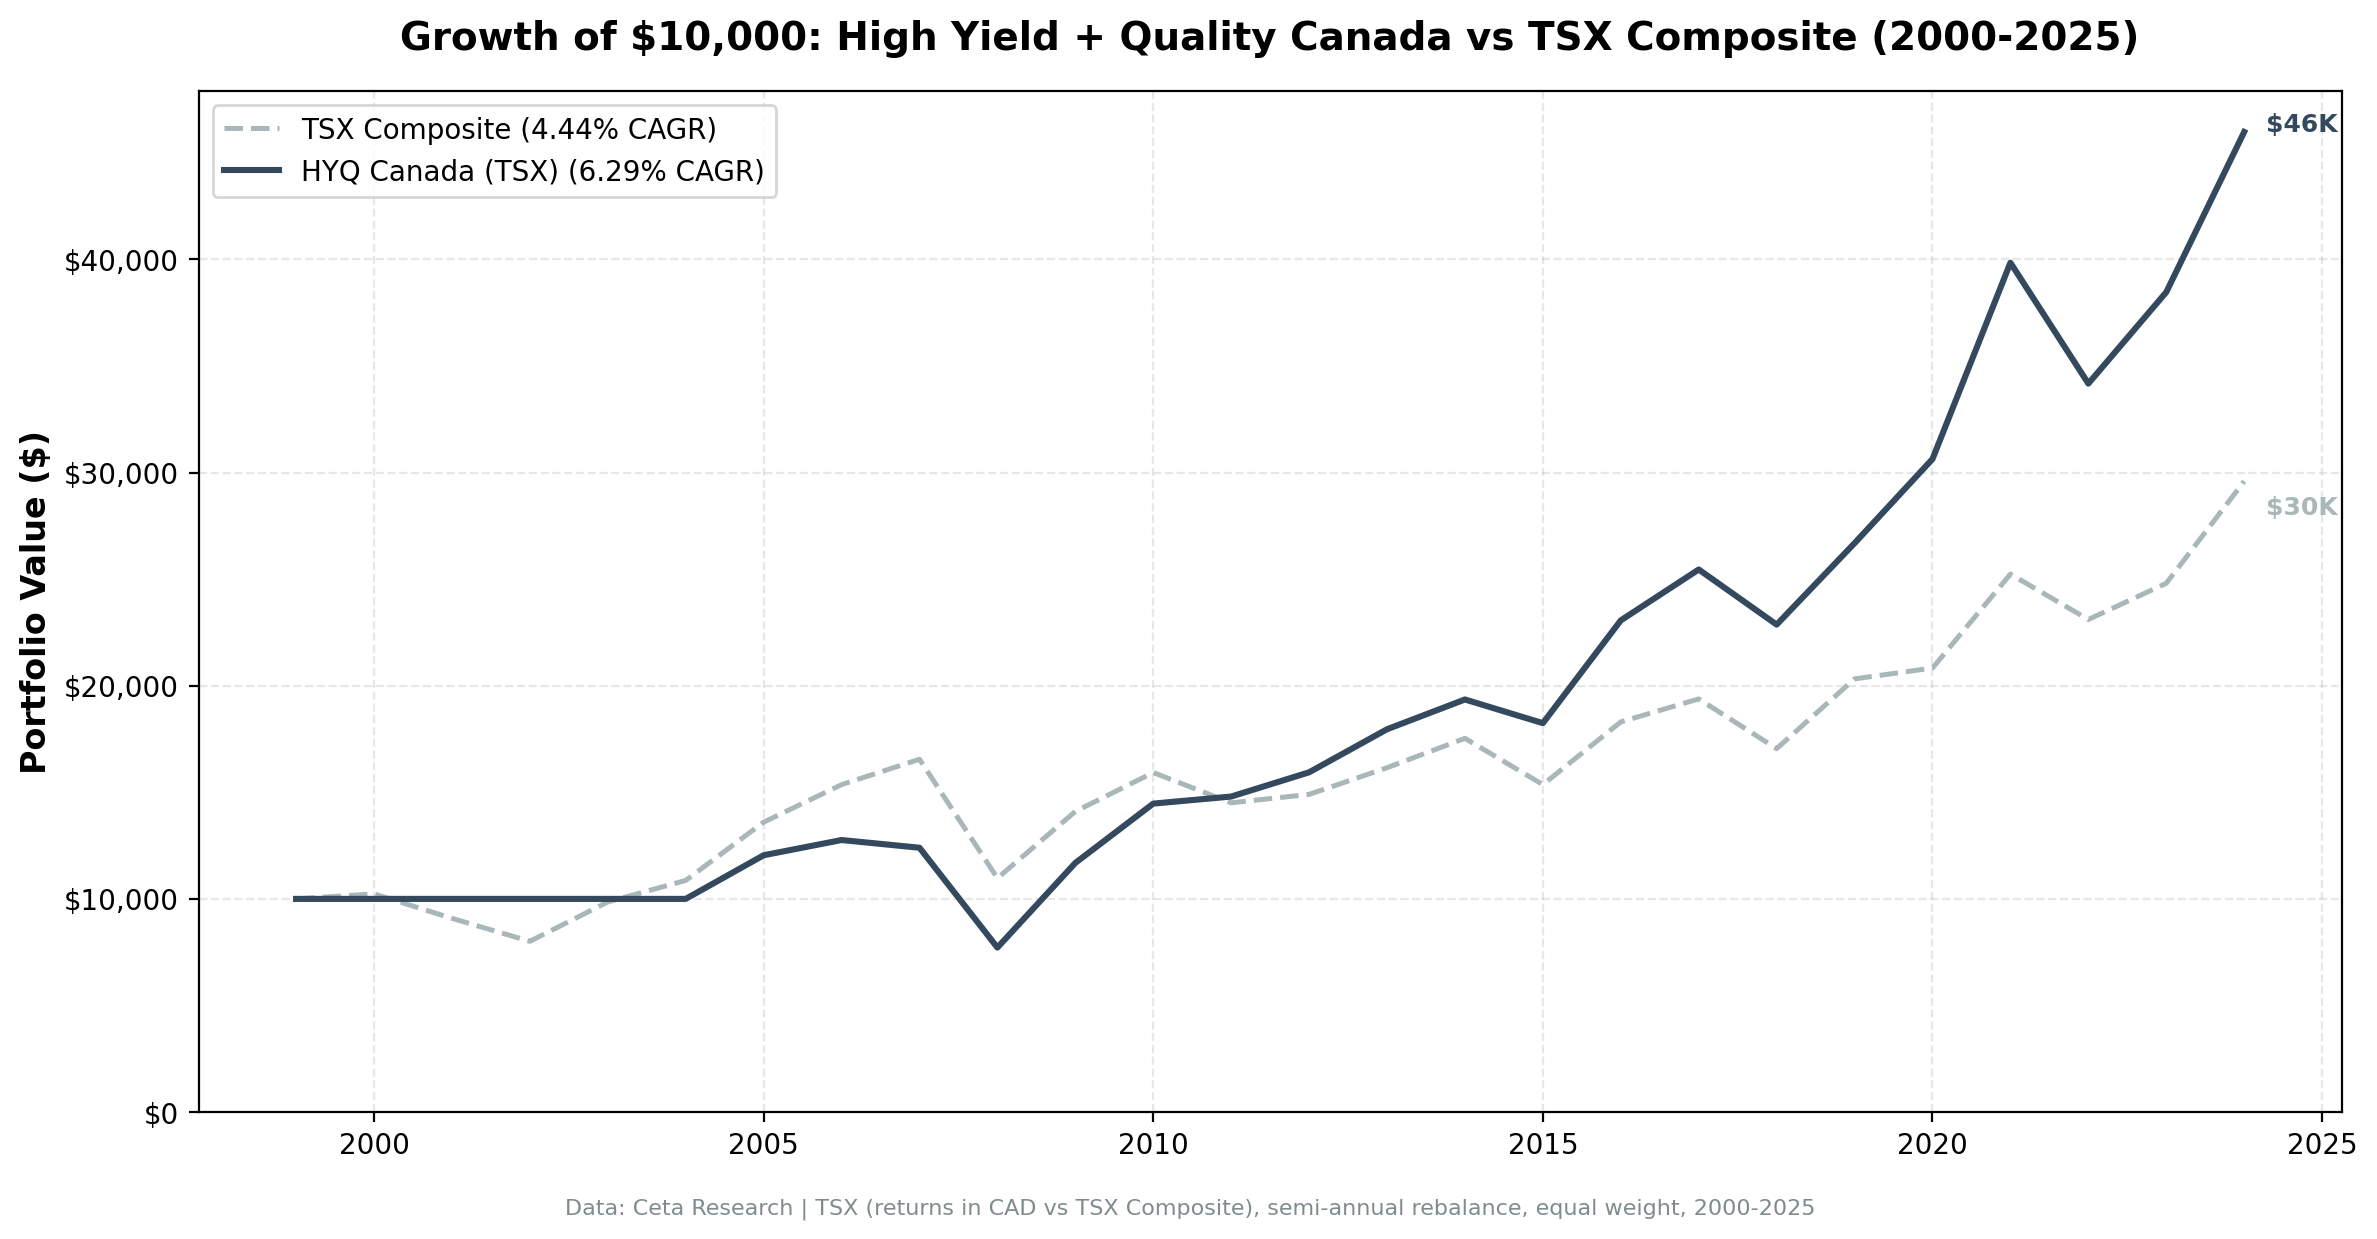
We ran the same high dividend yield quality screen on Canadian stocks (TSX) from 2000 to 2025. The result: 6.29% CAGR with +1.86% annual excess over the TSX Composite, and +1.96% Jensen's alpha. Canada has a strong dividend culture, especially in financials and energy, and the quality filters beat the local benchmark in 60% of years.
Contents
- Method
- Results
- Annual Returns
- Canada's Dividend Culture
- When It Works
- When It Struggles
- Limitations
- Part of a Series
- References
Data: FMP financial data warehouse, 2000-2025. Updated May 2026.
Method
Data source: Ceta Research (FMP financial data) Universe: TSX-listed stocks with market cap > 500M CAD (~$362M USD) Period: 2000-2025 (25 years) Rebalancing: Annual (July) Execution: Next-day close (MOC) Benchmark: TSX Composite (^GSPTSE)
Same signal as the US analysis: dividend yield 4-15%, payout 0-80%, FCF > 0, ROE > 8%, D/E < 2.0. Top 30 by yield, equal weight.
Results
| Metric | Strategy | TSX Composite |
|---|---|---|
| CAGR | 6.29% | 4.44% |
| Total Return | 360% | -- |
| Max Drawdown | -39.53% | -33.70% |
| Sharpe Ratio | 0.222 | 0.129 |
| Sortino Ratio | 0.405 | -- |
| Win Rate (vs TSX) | 60% | -- |
| Up Capture | 108.6% | -- |
| Down Capture | 66.6% | -- |
| Beta | 0.945 | -- |
| Alpha (Jensen) | +1.96% | -- |
| Cash Periods | 5/25 (20%) | -- |
| Avg Stocks | 17.1 | -- |
The strategy beat the TSX in 60% of years. Up capture above 100% means the portfolio amplified gains; down capture of 67% means it absorbed more losses than the leaner picks at other exchanges. The result is a small alpha (+1.96%) with a comparable risk profile to the TSX itself (beta 0.945).
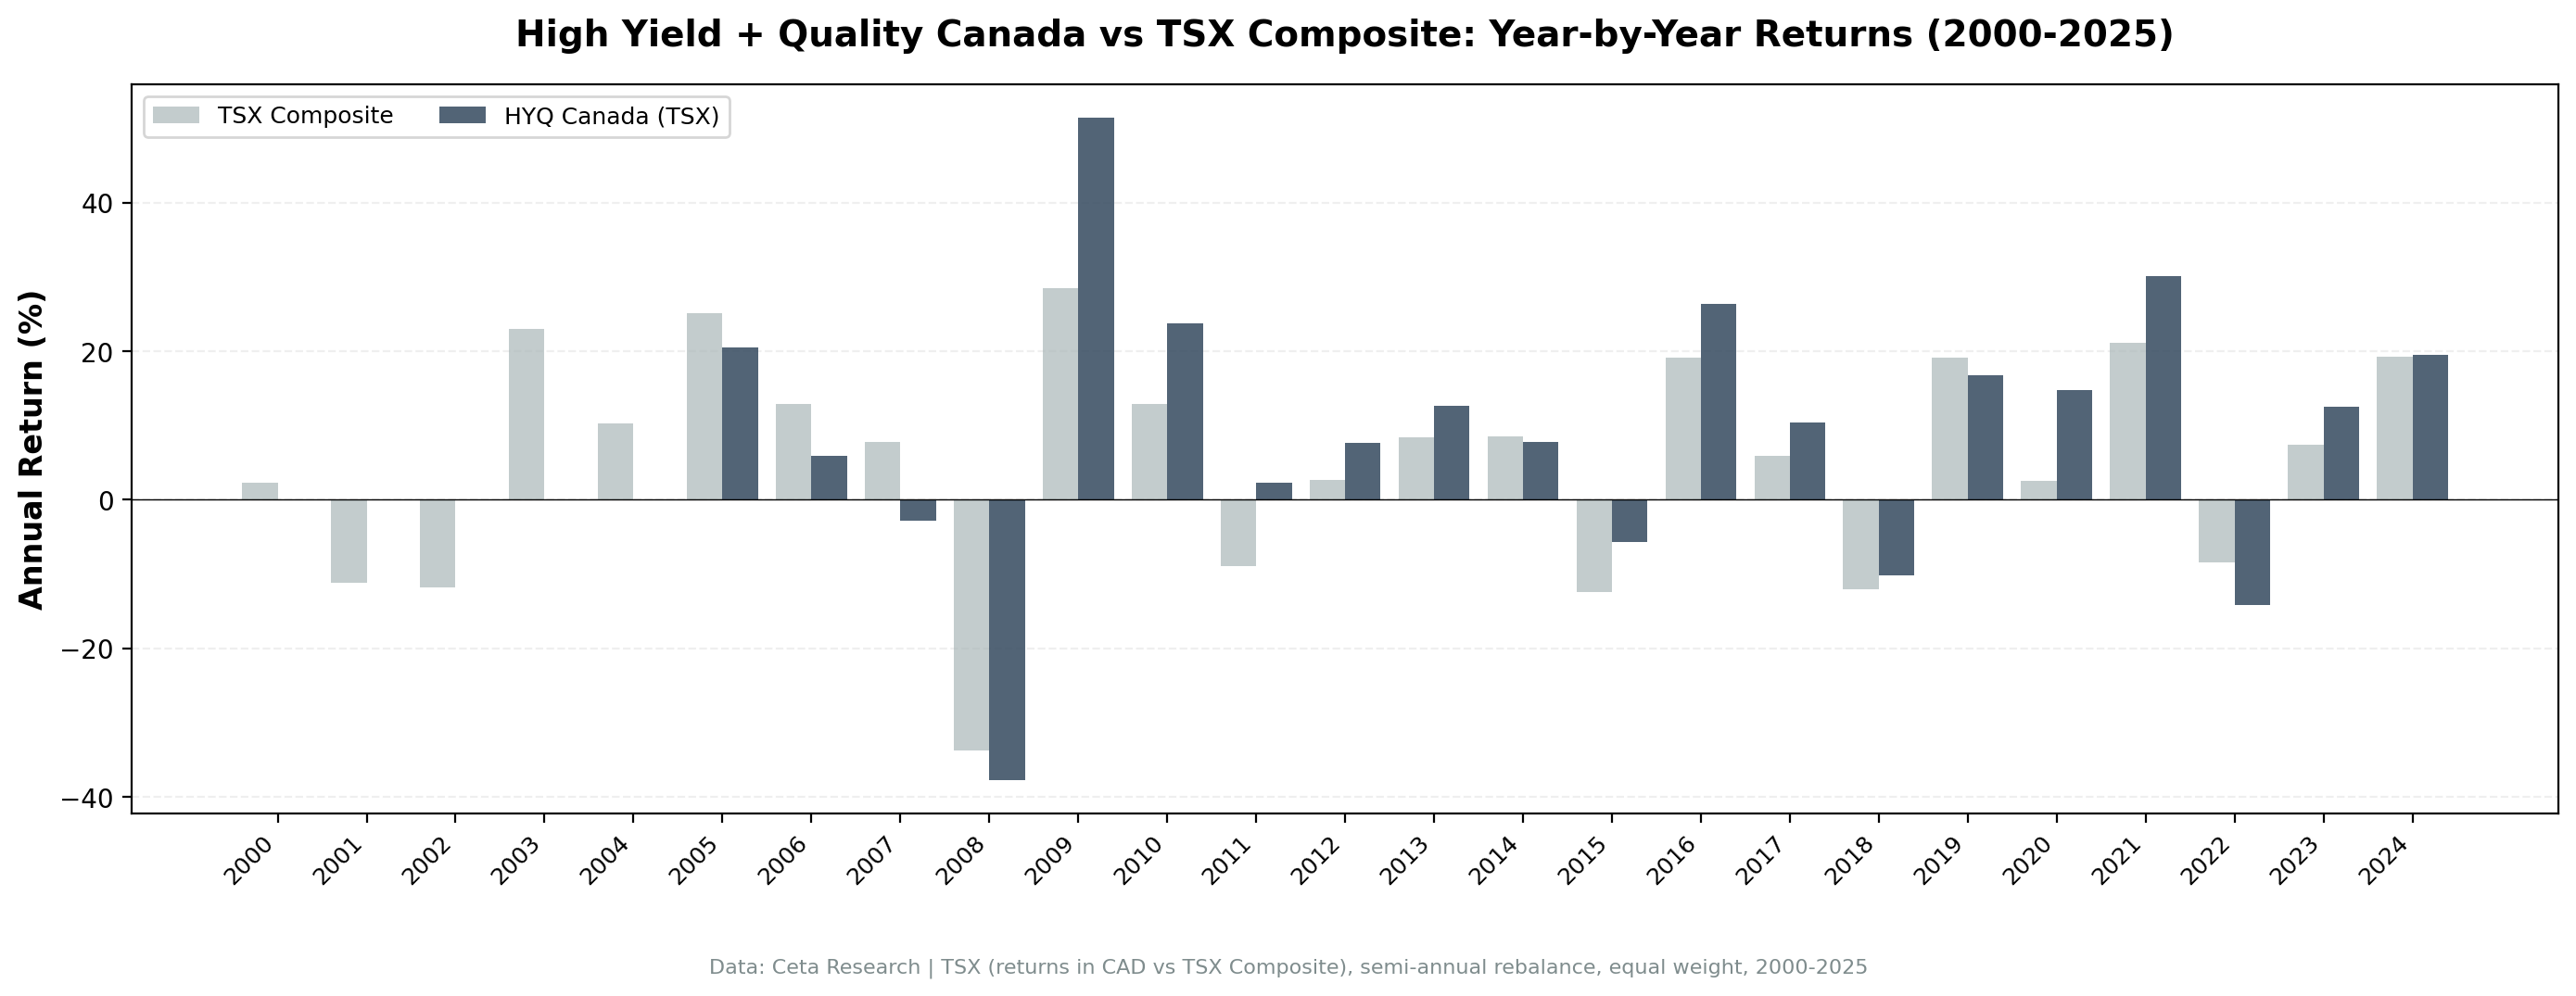
The deeper drawdown (-39.5% vs TSX -33.7%) reflects 2008 (where the strategy lost -37.8% vs TSX -33.7%) and 2022 (-14.2% vs TSX -8.4%). High-yield Canadian names are concentrated in banks, energy, and pipelines, sectors that can fall hard in commodity-and-credit downturns.
Annual Returns
| Year | Strategy | TSX Composite | Excess |
|---|---|---|---|
| 2000 | 0.0% (cash) | +2.4% | -2.4% |
| 2001 | 0.0% (cash) | -11.2% | +11.2% |
| 2002 | 0.0% (cash) | -11.9% | +11.9% |
| 2003 | 0.0% (cash) | +23.1% | -23.1% |
| 2004 | 0.0% (cash) | +10.2% | -10.2% |
| 2005 | +20.5% | +25.1% | -4.7% |
| 2006 | +5.9% | +12.9% | -7.0% |
| 2007 | -2.8% | +7.8% | -10.6% |
| 2008 | -37.8% | -33.7% | -4.1% |
| 2009 | +51.5% | +28.5% | +22.9% |
| 2010 | +23.8% | +12.9% | +10.9% |
| 2011 | +2.3% | -8.9% | +11.2% |
| 2012 | +7.7% | +2.7% | +5.0% |
| 2013 | +12.7% | +8.4% | +4.3% |
| 2014 | +7.8% | +8.5% | -0.8% |
| 2015 | -5.7% | -12.4% | +6.6% |
| 2016 | +26.4% | +19.1% | +7.3% |
| 2017 | +10.3% | +5.9% | +4.5% |
| 2018 | -10.2% | -12.0% | +1.9% |
| 2019 | +16.7% | +19.2% | -2.5% |
| 2020 | +14.8% | +2.5% | +12.3% |
| 2021 | +30.1% | +21.2% | +8.9% |
| 2022 | -14.2% | -8.4% | -5.8% |
| 2023 | +12.6% | +7.3% | +5.2% |
| 2024 | +19.5% | +19.3% | +0.2% |
Canada's Dividend Culture
Canadian investors love dividends. The TSX is heavily weighted toward financials (Big Six banks), energy (oil sands operators), and utilities. All are traditional dividend payers. Canada's dividend tax credit also makes dividends more tax-efficient than in many countries, reinforcing the culture.
This works for our screen: when invested, the TSX consistently produces 17+ qualifying high-yield stocks. But the concentration in financials and energy means the portfolio's returns correlate with commodity cycles and interest rates.
When It Works
2009 (post-crisis recovery): +51.5% vs TSX +28.5%. Canadian banks bounced sharply as credit markets normalized. The largest single-year excess return.
2010-2013: Four years of consistent outperformance, averaging double-digit excess in 2010-2011. Quality filters dodged the commodity stocks that dragged the broader index.
2015-2017: Three years of strong excess returns as the quality filters dodged the oil crash that hammered the TSX Composite.
2020-2021: Combined +47 percentage points absolute return. Quality dividend payers benefited from rate cuts and reopening demand.
When It Struggles
Pre-2005 cash drag: Five years of cash holdings before the signal first qualified TSX stocks at the required threshold. That's 20% of the backtest sitting flat.
2007: -2.8% while the TSX gained +7.8%. Financial sector stress hit dividend-heavy names before the broader index caught up.
2008: -37.8% vs TSX -33.7%. Worse than the index. Energy and financials, the strategy's natural overweight, both got hit.
2022: -14.2% while the TSX dropped only -8.4%. Energy prices stayed elevated and the TSX benefited from that mix; the quality screen's defensive tilt underperformed.
Limitations
Sector concentration: TSX high-yield portfolios skew heavily toward financials (banks, insurers), energy, and pipelines. You're effectively making a sector bet on Canadian banks and energy infrastructure staying healthy.
Small universe: 17.1 average stocks is lower than other exchanges. The TSX has fewer mid-to-large cap dividend payers than the US or HK.
Cash drag: 5 of 25 years held cash because the quality filters didn't find 10 qualifying stocks. This drags the headline CAGR figure.
Currency: Returns are in CAD terms. CAD/USD movements affect cross-market comparisons.
Data: Ceta Research (FMP financial data warehouse). Universe: TSX, market cap > 500M CAD. Backtest: 2000-2025, annual July rebalance, next-day close execution (MOC). Past performance does not guarantee future results.
Part of a Series
This is the Canada analysis. See also: - High Yield Quality on US Stocks - 10.52% CAGR, full methodology - High Yield Quality Across Global Exchanges - full comparison
References
- Fama, E. & French, K. (1998). "Value versus Growth: The International Evidence." Journal of Finance, 53(6), 1975-1999.


