
Graham Net-Nets on the NSE: Boom-Bust Deep Value in India
NCAV screen on Indian stocks from 2001 to 2024. 8.28% CAGR with 42% volatility. Recovery years hit +133%, +106%, and +81%. The trade-off is a -57.7% max drawdown.

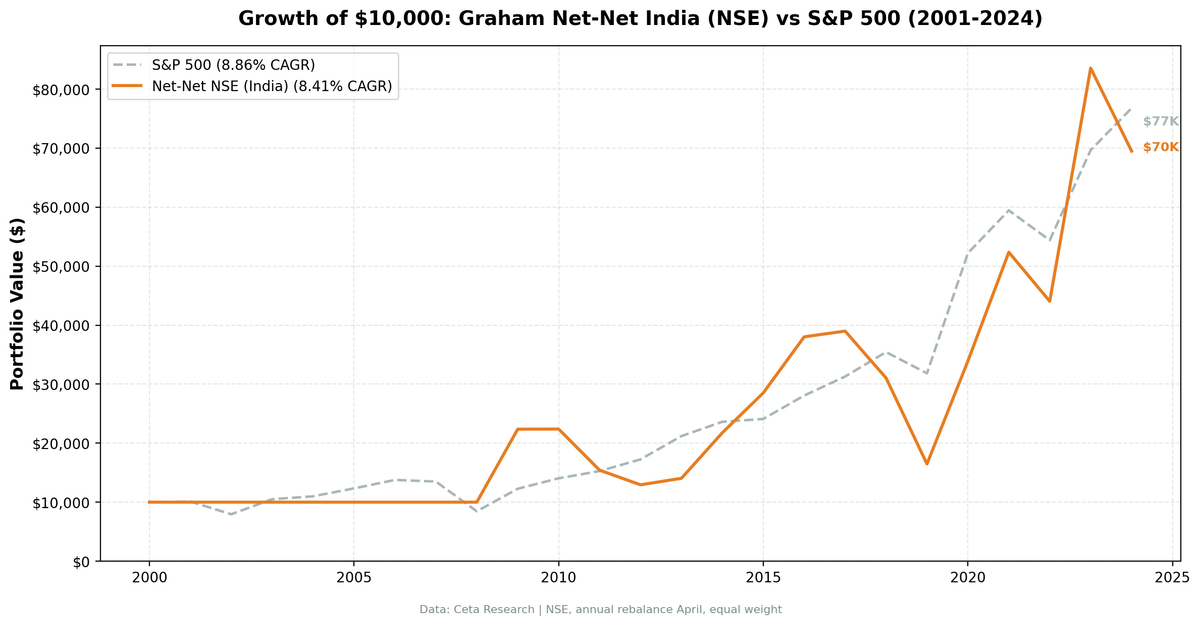
Indian net-nets returned 8.41% CAGR over 24 years, trailing the BSE Sensex by 5.22% annually. But that headline masks extreme behavior. The first eight years produced zero returns (data coverage gap), and the invested years swung between +124% and -47%. This is a strategy that underperforms the local benchmark but retains boom-bust characteristics that reward patience and punish weak hands.
Contents
- What is NCAV?
- Method
- What We Found
- The Eight Cash Years
- The Recovery Pattern
- The Crashes
- When It Works
- When It Struggles
- Limitations
- Takeaway
- Part of a Series
We screened the NSE for stocks trading below their net current asset value per share, rebalanced annually, and tracked 16 years of actual invested performance. When Indian net-nets work, they produce some of the most explosive recoveries we've seen across any exchange. When they don't, they fall harder than the market.
Data: FMP financial data warehouse, 2000–2025. Updated March 2026.
What is NCAV?
Net Current Asset Value measures liquidation value. The formula: current assets minus total liabilities minus preferred stock. If a stock trades below this number on a per-share basis, the market is pricing it below what you'd get by shutting the company down and selling off its short-term assets after paying every creditor.
Benjamin Graham popularized this screen in the 1930s. The logic hasn't changed. Companies below NCAV are either genuinely distressed or mispriced by the market. The bet is that enough of them are mispriced to produce a portfolio-level edge.
Method
| Parameter | Value |
|---|---|
| Universe | NSE (National Stock Exchange of India) |
| Signal | Stock price < NCAV per share (grahamNetNet) |
| Rebalancing | Annual (April, after fiscal year filings) |
| Max positions | 30 stocks, equal weight |
| Cash rule | Fewer than 5 qualifying stocks |
| Market cap floor | ~$6M USD (lower threshold, Indian net-nets are small) |
| Entry price | > $0.50 equivalent |
| Filing lag | 45 days (point-in-time) |
| Max single return | Capped at 300% |
| Transaction costs | Size-tiered |
| Period | 2001-2024 (24 years) |
| Benchmark | BSE Sensex |
| Data source | FMP via Ceta Research warehouse |
What We Found
Full period summary (2001-2024):
| Metric | NCAV India | BSE Sensex |
|---|---|---|
| CAGR | 8.41% | 13.63% |
| Total Return | 595.0% | 2048.4% |
| Sharpe Ratio | 0.045 | 0.223 |
| Sortino Ratio | 0.112 | 0.55 |
| Calmar Ratio | 0.146 | 0.398 |
| Max Drawdown | -57.76% | -34.29% |
| Volatility | 42.62% | 32.02% |
| Beta | 0.75 | 1.0 |
| Alpha | -3.44% | -- |
| Win Rate vs Sensex | 41.67% | -- |
| Up Capture | 80.36% | 100% |
| Down Capture | 62.27% | 100% |
| Cash Periods | 8 of 24 (33%) | -- |
| Avg Stocks (invested) | 25.1 | -- |
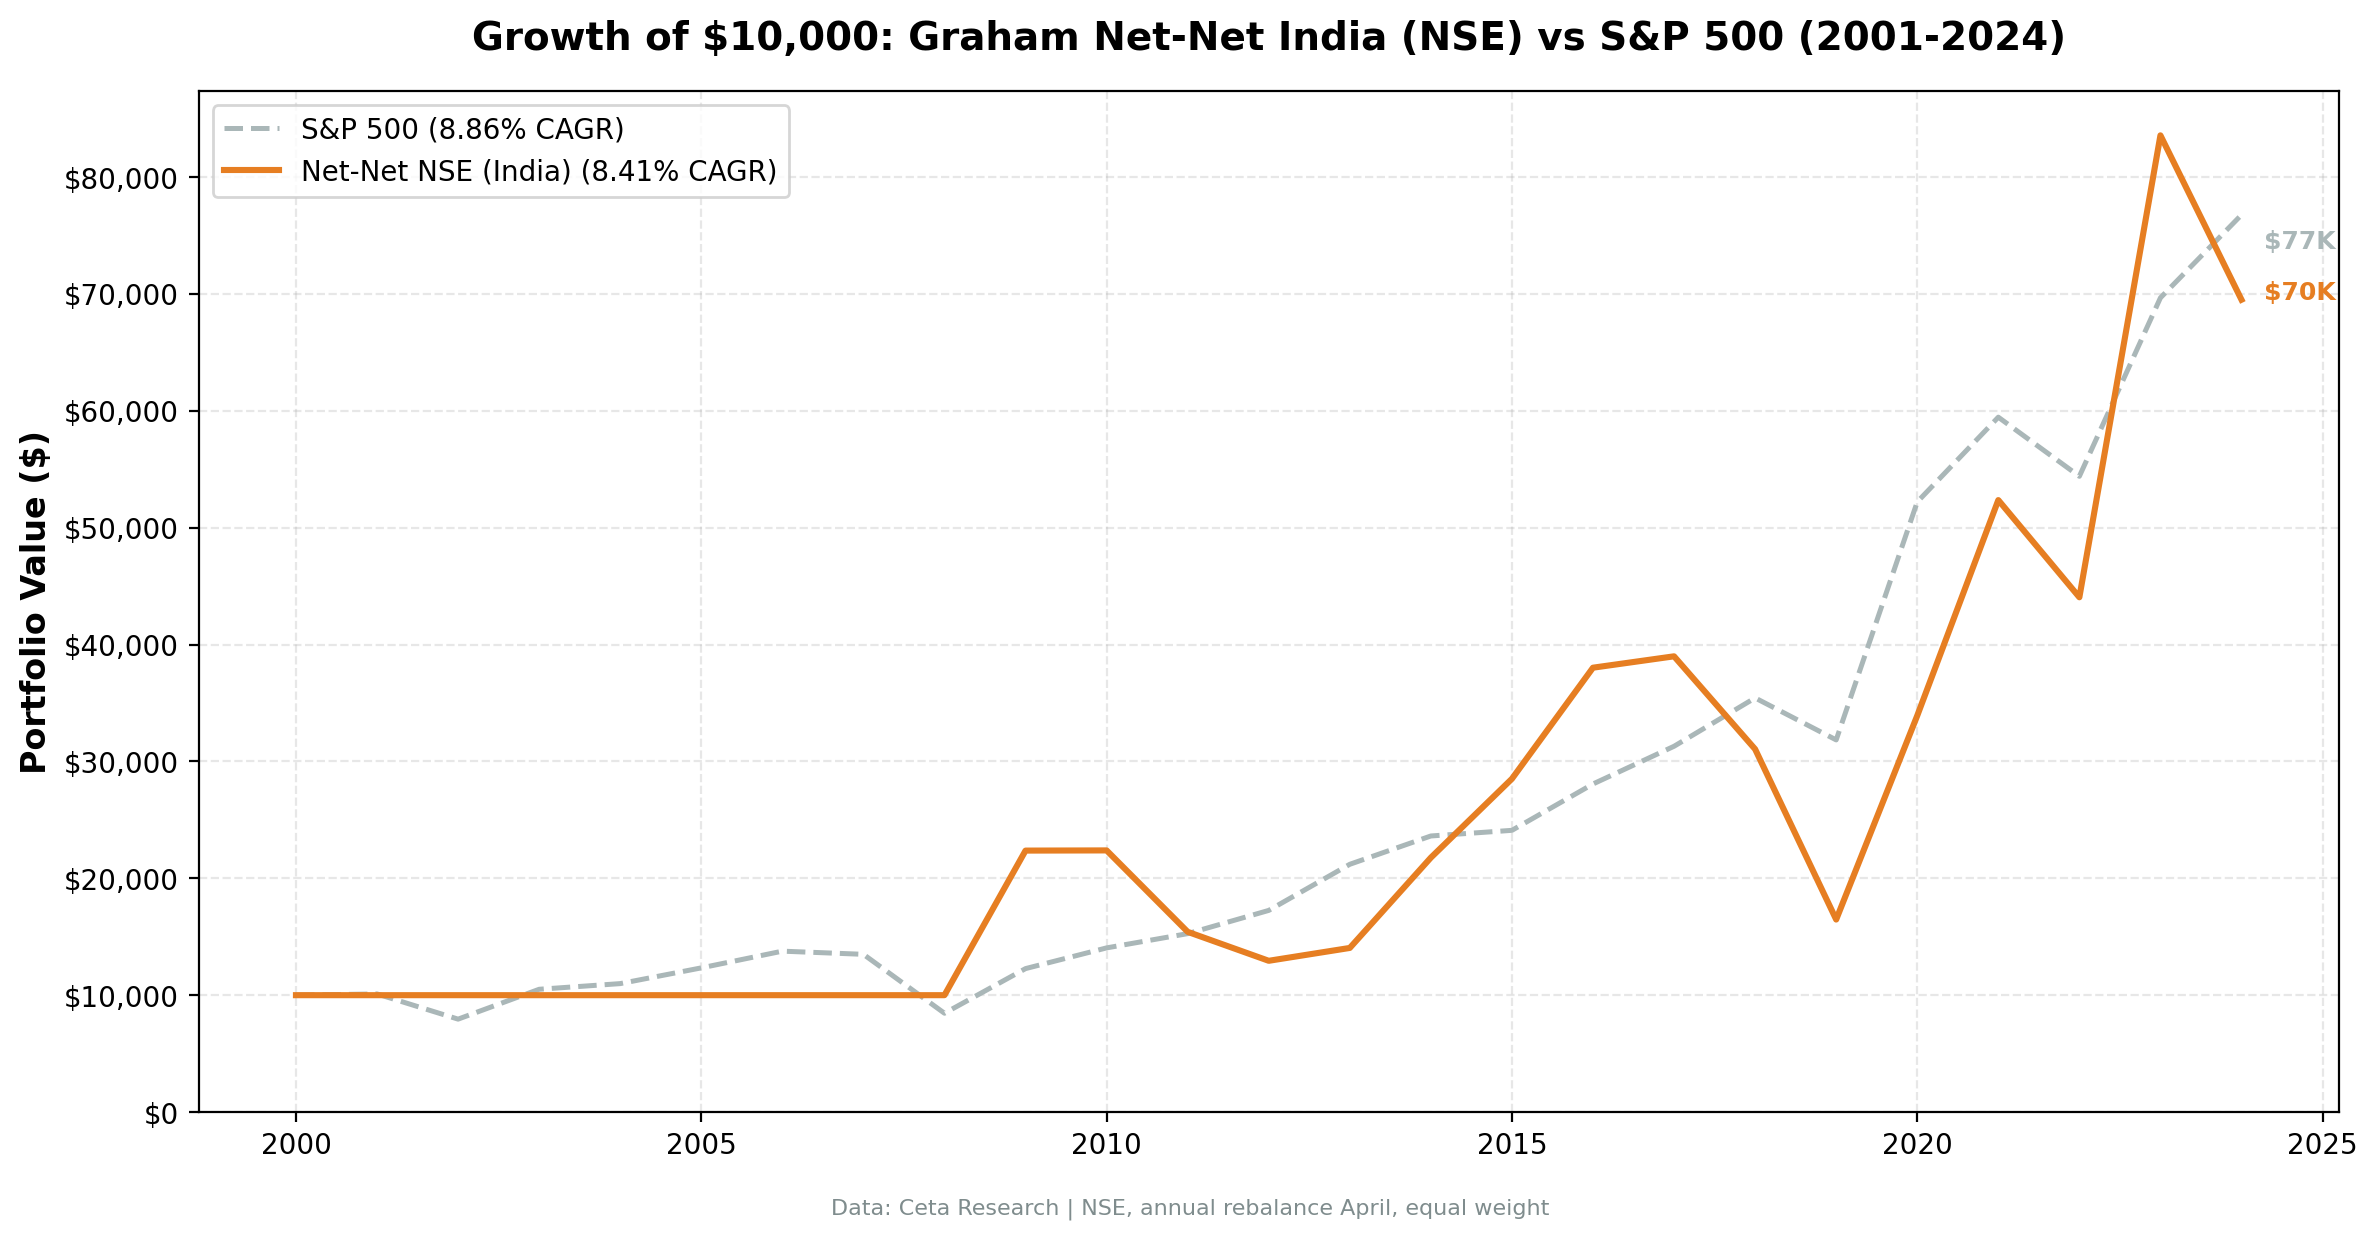
The raw numbers show this strategy underperformed the Sensex by 5.22% annually. Volatility ran at 43%, higher than the Sensex's 32%. The Sharpe ratio of 0.045 is barely above zero, meaning the risk-adjusted return was poor. A $10,000 investment in the strategy grew to $69,500 over 24 years compared to $214,840 in the Sensex.
But the story isn't just underperformance. Beta of 0.75 and down capture of 62% suggest Indian net-nets move less than the market during both rallies and crashes. Up capture of 80% means the strategy captured only 80% of Sensex gains during bull markets but fell only 62% as much during downturns. That asymmetry is the trade-off for lower overall returns.
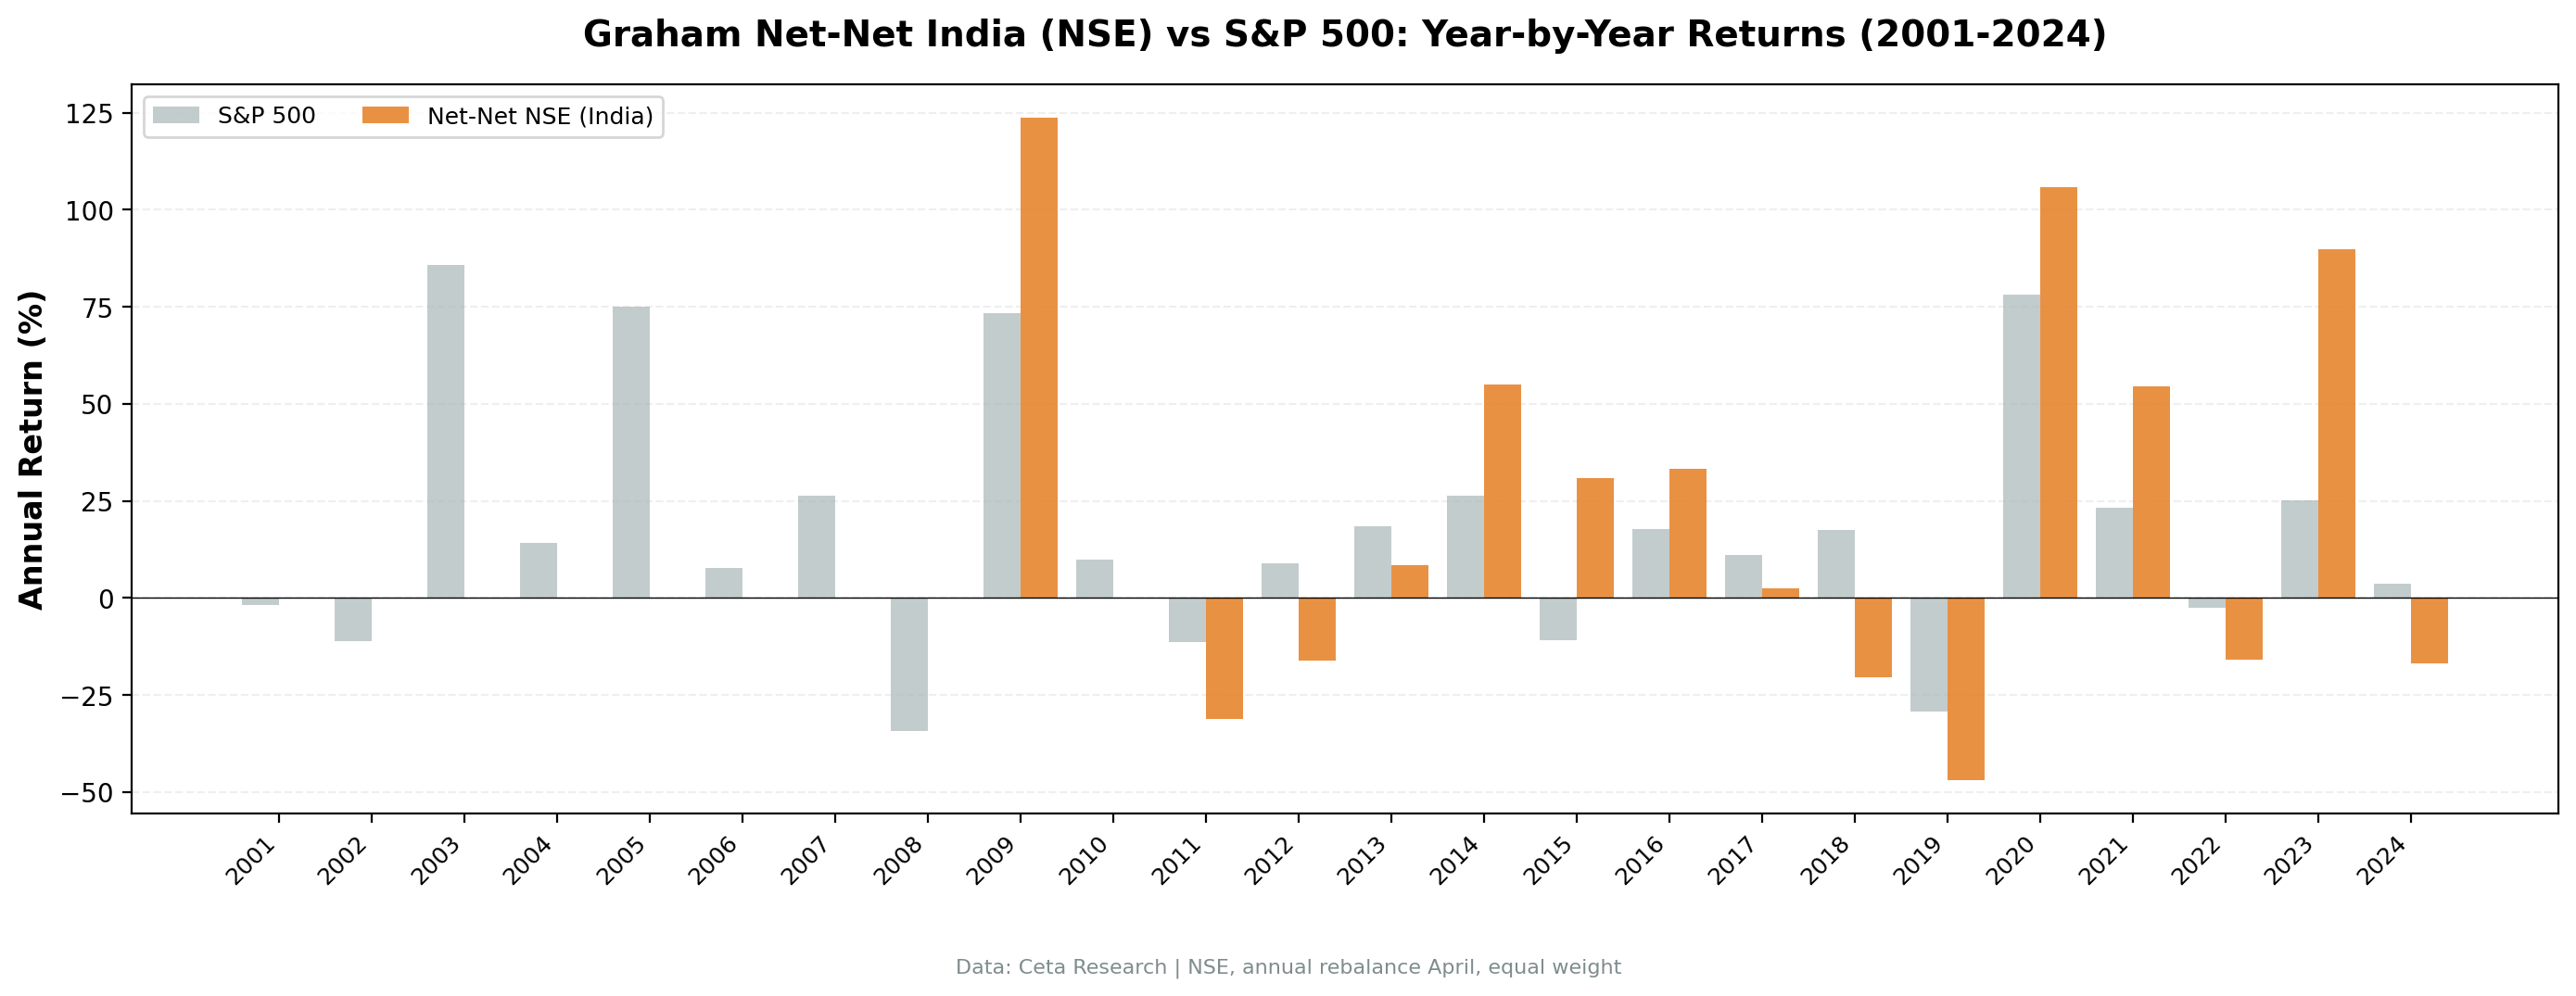
Year-by-year results:
| Year | NCAV India | Sensex | Notes |
|---|---|---|---|
| 2001 | 0.0% | -1.7% | CASH |
| 2002 | 0.0% | -11.09% | CASH |
| 2003 | 0.0% | +85.69% | CASH (missed massive rally) |
| 2004 | 0.0% | +14.1% | CASH |
| 2005 | 0.0% | +75.1% | CASH (missed massive rally) |
| 2006 | 0.0% | +7.7% | CASH |
| 2007 | 0.0% | +26.45% | CASH |
| 2008 | 0.0% | -34.29% | CASH (avoided crash) |
| 2009 | +123.71% | +73.31% | First invested year, +50pp alpha |
| 2010 | +0.07% | +9.85% | Flat |
| 2011 | -31.12% | -11.29% | First loss, -20pp vs Sensex |
| 2012 | -16.07% | +8.94% | -25pp |
| 2013 | +8.5% | +18.44% | -10pp |
| 2014 | +55.02% | +26.4% | Modi election year, +29pp alpha |
| 2015 | +30.99% | -10.89% | +42pp alpha |
| 2016 | +33.34% | +17.76% | +16pp |
| 2017 | +2.56% | +11.18% | -9pp |
| 2018 | -20.37% | +17.44% | Small-cap crash begins, -38pp |
| 2019 | -46.95% | -29.36% | Worst year, -18pp |
| 2020 | +105.9% | +78.17% | COVID recovery, +28pp alpha |
| 2021 | +54.38% | +23.3% | India bull market, +31pp |
| 2022 | -15.88% | -2.48% | Rate shock, -13pp |
| 2023 | +89.73% | +25.04% | Recovery, +65pp alpha |
| 2024 | -16.83% | +3.67% | -21pp |
The Eight Cash Years
Every year from 2001 through 2008 returned 0%. That's not a strategy choice. Fewer than 5 NSE stocks passed the NCAV screen in those years, triggering the cash rule.
This is a data coverage limitation. FMP's fundamental data for NSE stocks is sparse before 2009. We can't confirm whether Indian net-nets existed in that period (they almost certainly did, given NSE had over 1,000 listed companies by 2003). We just can't measure them.
The practical backtest starts in 2009. From 2009 through 2024, the 16 invested years tell the real story.
The Recovery Pattern
Indian net-nets produce three of the strongest single-year recoveries in our entire multi-exchange dataset:
- 2009: +123.71%. The global financial crisis barely touched Indian net-nets (they were in cash during 2008). The 2009 entry caught the bottom. Many NSE small-caps had been beaten down for years by that point, and the recovery was violent. Even with that +124% return, the strategy still beat the Sensex by 50pp.
- 2020: +105.9%. COVID crushed Indian small-caps in March 2020. By April's rebalance, net-net qualifying stocks were everywhere. The snapback was fast and concentrated in exactly the type of beaten-down industrial and consumer companies this screen finds. Beat Sensex by 28pp.
- 2023: +89.73%. After two consecutive down years (2022 and the 2019 crash memory), net-nets entered 2023 at depressed levels. India's domestic economy was accelerating, and small-caps re-rated aggressively. Beat Sensex by 65pp.
The pattern: deep value in India acts like a spring. The more compressed these stocks get, the harder they snap back. Three of the 16 invested years produced returns above +80%. But between those explosive years, the strategy lags the Sensex during ordinary bull markets.
The Crashes
The other side of the coin is brutal:
- 2019: -46.95%. India's small and micro-cap segment entered a private bear market in late 2018. NBFC (non-banking financial company) defaults triggered a credit crunch that crushed exactly the kind of capital-light, balance-sheet-heavy firms this screen selects. The NCAV portfolio fell nearly 47% while the Sensex fell 29%. That's an 18pp underperformance in a crash year.
- 2011: -31.12%. Global risk-off plus rupee weakness. Indian net-nets are mostly micro-caps with limited institutional support. When foreign portfolio investors pulled out, liquidity dried up. The Sensex fell 11%, making this a 20pp underperformance.
- 2018: -20.37%. The start of the small-cap correction. Large-caps held steady while small-caps entered a two-year drawdown. The Sensex rose 17%, creating a 38pp gap.
Max drawdown hit -57.76% peak-to-trough. That's the price of admission for the +124% and +106% years.
When It Works
After severe market dislocations. The 2009, 2014-2016, and 2020-2021 clusters all followed periods where Indian small-caps were deeply out of favor. NCAV stocks over-correct in downturns, creating the setup for outsized recoveries.
During India-specific growth cycles. The 2014-2016 period (Modi election, structural reform optimism) and 2020-2021 (post-COVID domestic consumption boom) produced the best multi-year runs. India's net-nets are tilted toward manufacturing, textiles, chemicals, and small financials. These sectors benefit directly from domestic growth acceleration.
When It Struggles
During credit tightening. The 2018-2019 collapse tracks directly to India's NBFC crisis and tighter lending standards. Companies trading below liquidation value often depend on credit access. When credit dries up, some of them actually do approach liquidation.
When large-caps dominate. Years like 2013 and 2017 saw the Nifty 50 rally while micro-caps stagnated. Net-nets sit in the smallest corner of the market. They can miss entire bull runs if the rally is concentrated in large-caps.
Limitations
Data gap is real. Eight of 24 years are cash. The CAGR is computed over 24 years including those cash periods, which dilutes the return. The invested-only CAGR from 2009-2024 is much higher, but we report the full-period number because that's what a systematic investor would have experienced.
Volatility is extreme. Annual standard deviation of 42.4% means a -25% to +50% range covers a normal year. This isn't a portfolio you check daily.
Survivorship risk. FMP data may not include all delisted companies. If some net-nets went to zero and were removed from the database, our returns would be overstated. The 300% return cap helps limit this bias on the upside, but downside survivorship is harder to control.
Transaction costs on micro-caps. Indian micro-caps have wide bid-ask spreads. Our size-tiered cost model approximates this, but real execution on a 26-stock portfolio of sub-$6M market cap companies would face slippage.
Currency. Returns are in INR. The rupee depreciated roughly 3-4% annually against USD over this period. International investors would see lower dollar returns.
Takeaway
Graham net-nets on the NSE produced 8.41% CAGR with extraordinary volatility, trailing the Sensex by 5.22% annually. The strategy's value isn't consistent alpha. It's the ability to capture India's periodic deep-value recoveries, which are among the most powerful in any equity market, at the cost of severe underperformance during ordinary bull runs.
Three recovery years (+124%, +106%, +90%) delivered most of the lifetime return. But the strategy lagged during 12 of the 16 invested years. That's the trade: long stretches of underperformance, punctuated by explosive rebounds that aren't quite enough to beat the local benchmark. If you can stomach a -57.76% drawdown and structural underperformance for occasional 50-65pp alpha years, the boom-bust pattern is real. If you can't, this isn't the right strategy.
Part of a Series
This is part of our multi-exchange net-net (NCAV) backtest series. We're testing Graham's liquidation-value screen on every major exchange to see where balance sheet deep value actually works.
- Graham Net-Nets: US Stocks (US baseline)
Data: FMP via Ceta Research warehouse. Full methodology in our backtests repo.
Past performance does not guarantee future results. This is educational content, not investment advice.


