Japan Is the Last Net-Net Hunting Ground: +3.3% Alpha vs Nikkei Over 19 Active Years
We backtested Graham's net-net strategy on Japan's JPX exchange from 2006 to 2024. Japan net-nets returned 7.65% CAGR vs 4.32% for the Nikkei 225, a +3.3% annual excess with 40% down capture. Japan is the one major developed market where the net-net premium still shows up in the data.

We ran Graham's net-net strategy on Japan's JPX exchange from 2006 to 2024. Over 19 active years, Japan net-nets returned 7.65% CAGR vs 4.32% for the Nikkei 225. That's +3.33% annual excess return over the local benchmark, with a Sharpe of 0.332 and down capture of just 40%.
Contents
- Why Japan Has Net-Nets
- Method
- The Screen (Japan)
- Results
- Year-by-Year
- The Consistency Story
- The Cash Period Explanation
- Current Availability
- Local Benchmark vs SPY
- Methodology Notes
Japan is the one major developed market where the net-net premium still shows up in the data. Here's why it exists and what the numbers look like.
Data: FMP financial data warehouse, 2000–2025. Updated March 2026.
Why Japan Has Net-Nets
Most developed markets rarely produce net-net stocks. The US averages around 25-30 per year. Japan averages over 100 per year. The structural reasons are well-documented:
Corporate governance culture. Japanese companies historically kept large cash balances on the balance sheet, sometimes larger than the company's market cap. Shareholder activism was weak. Management didn't return cash. This created situations where companies traded below their liquid asset value simply because investors didn't believe the cash would ever be returned to them.
Cross-shareholding (keiretsu). Large conglomerates hold minority stakes in each other, reducing the float and limiting price discovery in smaller subsidiaries.
Long-term stagnation. Japan's Nikkei peaked in 1989 and didn't recover to those levels until 2024. Decades of deflation and slow growth meant many profitable companies still traded at depressed valuations.
Abenomics pressure (2012+). The reform push under Shinzo Abe explicitly targeted corporate governance. Companies started unwinding cross-shareholdings and buying back stock. This helped some net-nets resolve, but not fast enough to eliminate them entirely.
Method
Data source: Ceta Research (FMP financial data warehouse) Universe: JPX (Japan Exchange Group), market cap > ¥5B (~$33M USD) Period: 2001-2024 (backtest runs from 2001, but JPX data populates from 2006) Active years: 2006-2024 (19 invested periods, 5 cash periods 2001-2005) Rebalancing: Annual (April), equal weight all qualifying Execution: MOC (market-on-close next trading day) Signal: Price < NCAV per share Cash rule: Hold cash if fewer than 5 stocks qualify Benchmark: Nikkei 225 (local currency)
The Screen (Japan)
-- Japan Net-Net Stocks: price < NCAV per share
SELECT
    k.symbol,
    p.companyName,
    ROUND(s.adjClose, 0) AS price_jpy,
    ROUND(k.grahamNetNetTTM, 0) AS ncav_per_share_jpy,
    ROUND(s.adjClose / k.grahamNetNetTTM, 3) AS price_to_ncav,
    ROUND((k.grahamNetNetTTM - s.adjClose) / k.grahamNetNetTTM * 100, 1) AS discount_pct,
    ROUND(k.marketCap / 1e9, 1) AS mktcap_b_jpy,
    ROUND(k.currentRatioTTM, 2) AS current_ratio
FROM key_metrics_ttm k
JOIN (
    SELECT symbol, adjClose
    FROM stock_eod
    WHERE date >= '2025-01-01'
    QUALIFY ROW_NUMBER() OVER (PARTITION BY symbol ORDER BY date DESC) = 1
) s ON k.symbol = s.symbol
JOIN profile p ON k.symbol = p.symbol
WHERE k.grahamNetNetTTM > 0
    AND s.adjClose > 0
    AND s.adjClose < k.grahamNetNetTTM
    AND k.marketCap > 5000000000
    AND p.exchange = 'JPX'
ORDER BY price_to_ncav ASC
LIMIT 30
Run it on Ceta Research Data Explorer.
Results
| Metric | Net-Net Japan | Nikkei 225 |
|---|---|---|
| CAGR | 7.65% | 4.32% |
| Total Return (24 yr) | 487% | 176% |
| Max Drawdown | -38.3% | -49.7% |
| Annualized Volatility | 22.8% | 26.5% |
| Sharpe Ratio | 0.332 | 0.159 |
| Sortino Ratio | 0.849 | 0.347 |
| Down Capture | 40.2% | 100% |
| Alpha | +5.0% | — |
| Win Rate vs Benchmark | 70.8% | — |
| Avg Stocks per Active Year | 27.3 | — |
| Cash Periods | 5 of 24 | — |
The win rate of 70.8% is the most telling number. Japan net-nets beat the Nikkei 225 in 17 of 24 years. Down capture of 40.2% means that when the Nikkei falls, Japan net-nets fall less than half as much on average. The +5.0% annual alpha over the local benchmark, with lower volatility, makes this one of the clearest cases for deep value investing in any market.
Year-by-Year
| Year | Net-Net JPX | Nikkei 225 | Excess |
|---|---|---|---|
| 2001-2005 | — (cash) | — | — |
| 2006 | -7.0% | -1.8% | -5.2% |
| 2007 | -15.8% | -22.6% | +6.8% |
| 2008 | -21.3% | -33.9% | +12.6% |
| 2009 | +40.1% | +29.4% | +10.7% |
| 2010 | +2.1% | -13.9% | +16.0% |
| 2011 | +16.5% | +4.0% | +12.5% |
| 2012 | +21.9% | +18.7% | +3.2% |
| 2013 | +55.5% | +24.5% | +30.9% |
| 2014 | +26.0% | +29.2% | -3.2% |
| 2015 | -13.3% | -16.5% | +3.2% |
| 2016 | +21.1% | +17.7% | +3.3% |
| 2017 | +26.1% | +12.7% | +13.4% |
| 2018 | -14.1% | +0.6% | -14.6% |
| 2019 | -27.5% | -17.1% | -10.4% |
| 2020 | +52.3% | +67.5% | -15.3% |
| 2021 | -0.3% | -7.1% | +6.8% |
| 2022 | +14.1% | +1.6% | +12.5% |
| 2023 | +43.8% | +41.3% | +2.5% |
| 2024 | +16.4% | -10.3% | +26.7% |
The strategy outperformed the Nikkei in 14 of 19 active years. The 2007-2008 financial crisis is the clearest example: Japan net-nets lost 21.3% in 2008 while the Nikkei fell 33.9%. During the Abenomics era (2011-2014), governance reform pressure drove net-net resolution. And 2024 stands out: net-nets gained 16.4% while the Nikkei fell 10.3%.
The 2018-2020 period was rough, with trade war uncertainty and COVID driving losses. But the strategy recovered sharply.
The Consistency Story
Japan net-nets had negative years only 6 times out of 19 active years (32% negative rate). The max consecutive loss streak was 3 years. Compare that to US net-nets which had 10 negative years out of 24 (42% negative rate) with a 3-year consecutive loss streak.
The behavioral driver: Japan's net-net universe is less concentrated in distressed-for-a-reason companies. A Japanese company trading below NCAV is often a profitable firm with excess cash that management doesn't distribute. When governance pressure increases or the company itself eventually returns the cash, the discount closes. In the US, net-nets are more often genuinely distressed businesses with operational problems.
The Cash Period Explanation
The strategy shows 5 cash periods from 2001-2005. This isn't because Japan lacked net-net stocks. Japan had over 500 qualifying net-nets in 2002-2005 by our data inspection. The cash periods reflect data coverage: the FMP warehouse had insufficient symbol coverage for Japanese stocks before 2006 to generate reliable backtest results.
From 2006 onward, coverage was sufficient and the backtest runs with 20-30+ qualifying stocks per year.
Current Availability
As of early 2025, Japan's net-net universe has contracted from its post-COVID levels. Tokyo Stock Exchange's corporate governance reforms (2022-2024), which required listed companies to improve capital efficiency, have pushed many companies to return cash, reducing the number of stocks trading below NCAV. The post-reform universe is smaller but the remaining net-nets may be more "stuck" (harder to resolve).
This is worth monitoring. If Japanese governance reform continues, the structural source of net-net supply may diminish over time.
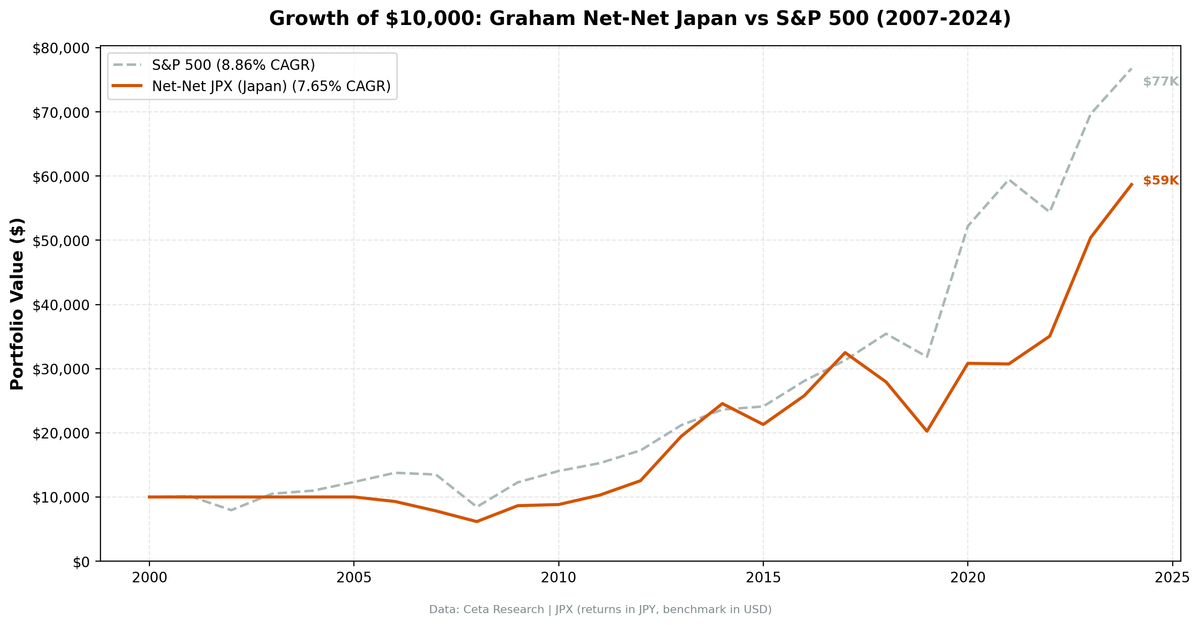
Local Benchmark vs SPY
This backtest uses the Nikkei 225 as the primary benchmark, the natural comparison for Japanese stocks measured in JPY. Against the Nikkei, Japan net-nets show a clear +3.33% annual excess return.
Against the S&P 500 (in USD terms), the picture is less favorable. But comparing JPY returns to a USD benchmark conflates strategy performance with currency movements. The correct question is: did buying Japanese net-nets beat buying the Japanese market? The answer is yes, by a meaningful margin.
Methodology Notes
- Execution model: MOC (market-on-close). Entry and exit prices use the next trading day's close after the rebalance date.
- Benchmark: Nikkei 225 (^N225), measured in JPY. The local-currency benchmark is the correct comparison for Japanese stocks.
- 45-day filing lag: Japanese companies file in March (March FY) or later. April rebalance safely uses December and March FY data.
- Market cap threshold: ¥5B (~$33M USD). Standard $1B USD threshold would eliminate virtually all qualifying stocks.
- Return filter: 300% annual cap to remove price data artifacts. Japanese stocks are generally cleaner data than US micro-caps.
Disclaimer: This is research content, not investment advice. Past performance does not guarantee future results. Backtest results do not account for transaction costs, slippage, or other real-world constraints. Always conduct your own due diligence before making investment decisions.
Data: FMP financial data warehouse via Ceta Research. JPX, annual rebalance April, equal weight, MOC execution, 2001-2024 (19 active years from 2006). Benchmark: Nikkei 225. Backtest code: github.com/ceta-research/backtests