
Germany FCF Growth: Europe's Only FCF Outperformer Over 25 Years (XETRA)
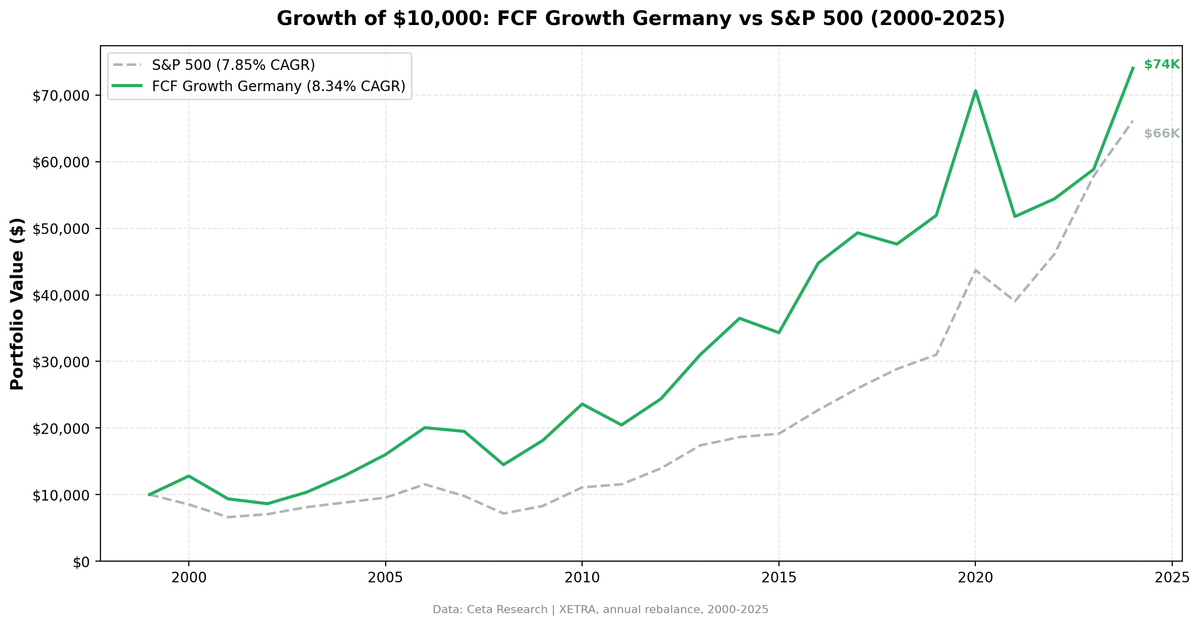
German FCF growth stocks outperformed the S&P 500 over 25 years — the only European exchange in our 13-market study to do so. 8.33% CAGR vs 7.83% SPY, with 97% up capture and 60% down capture. Modest edge, consistent protection.

German FCF-growth stocks outperformed the DAX by 3.30 percentage points per year over 25 years, with noticeably better downside protection. The portfolio captured only 45% of the DAX's downside while keeping pace with its upside. That asymmetry makes Germany an interesting case study in European value-meets-growth investing.
Contents
- Method
- Results
- When It Works
- When It Fails
- The 2008 Result
- Annual Returns
- Limitations
- Global Context
- Run It Yourself
Data: FMP financial data warehouse (XETRA), 2000–2025. Returns in EUR. Updated March 2026.
Method
Universe: XETRA (Deutsche Börse), market cap above ~€400M.
Signal: FCF growth year-over-year above 15%, OCF growth above 0%.
Quality filters: ROE above 10%, debt-to-equity below 1.5.
Selection: Top 30 stocks by FCF growth, equal weight. The XETRA universe is thinner than US markets, so the portfolio averaged 19 stocks per year.
Rebalancing: Annual, July. 45-day data lag applied.
Costs: Size-tiered transaction costs modeled.
Benchmark: DAX Total Return (^GDAXI). Returns in EUR.
Code: github.com/ceta-research/backtests
Results
| Metric | Portfolio | DAX |
|---|---|---|
| CAGR (2000–2025) | 8.34% | 5.04% |
| Total Return | 643.66% | 241.83% |
| Max Drawdown | -32.52% | — |
| Volatility | 18.67% | — |
| Sharpe Ratio | 0.329 | — |
| Win Rate vs DAX | 60% (15/25 years) | — |
| Up Capture | 102.3% | — |
| Down Capture | 44.98% | — |
| Beta | — | 1.00 |
| Cash Periods | 0/25 | — |
| Avg Stocks | 19.0 | — |
$10,000 invested in 2000 grew to €74,366 in the portfolio versus €34,183 in the DAX.
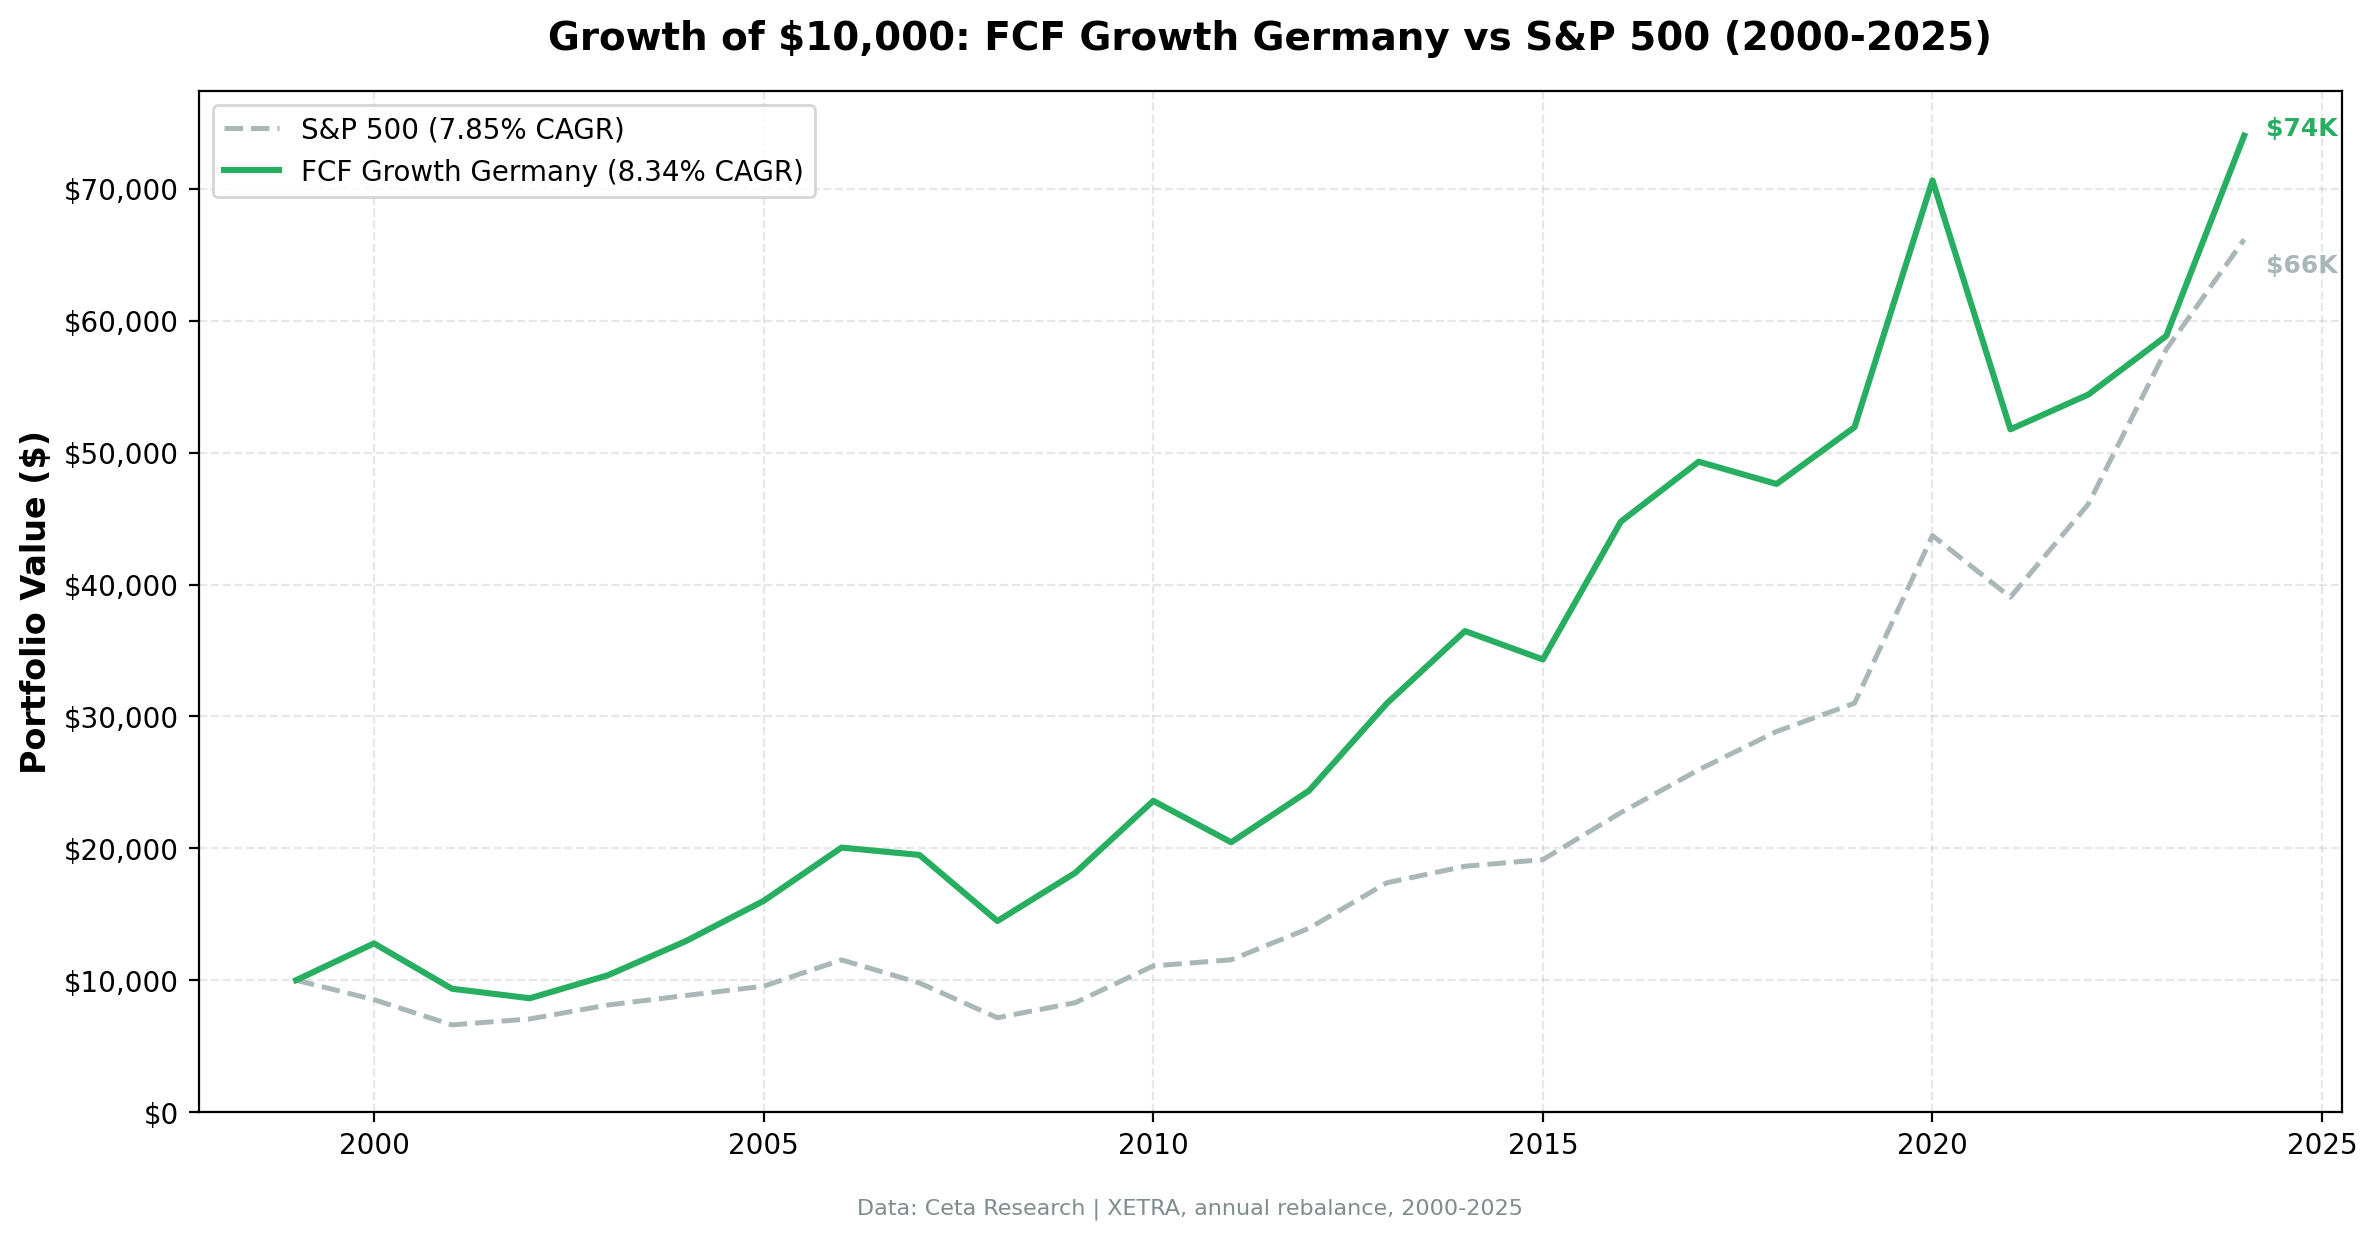
The portfolio returned 8.34% annually over 25 years. The DAX returned 5.04%. That's a +3.30% annualized excess return, which compounds to a significant wealth difference over time.
The down capture ratio is 44.98%, meaning the portfolio absorbed less than half the DAX's downside in down years. When the DAX fell 10%, the portfolio fell roughly 4.5%. The max drawdown of -32.52% shows the portfolio avoided the worst of German market stress.
The up capture of 102.3% means the portfolio kept pace with the DAX in rising years. Combined with the low down capture, this asymmetry drives the strong risk-adjusted returns.
The win rate is 60% (15 out of 25 years). The portfolio beat the DAX in three out of every five years.
When It Works
2000 was the standout: +27.9% vs DAX -12.2%, +40.1% excess return in a single year. The dot-com collapse hit the DAX too, but German FCF-positive industrials and exporters had less tech exposure than global indices. Companies generating cash flows from physical goods, manufacturing equipment, chemicals, and auto parts held up while speculative growth names collapsed.
2007: -2.8% vs DAX -20.8%, +18.0% excess. The strategy declined, but held up much better than the German market as the financial crisis began showing cracks. The quality filters and FCF discipline kept the portfolio away from the most leveraged names.
2002: -7.7% vs DAX -22.8%, +15.0% excess. Post-dot-com spillover hit Germany hard, but the FCF growth portfolio fell less than half as much as the DAX.
2017: +10.2% vs DAX -1.9%, +12.1% excess. The DAX had a weak year, but German FCF compounders posted solid returns as corporate earnings held steady.
2020: +36.0% vs DAX +24.1%, +11.9% excess. Recovery year from the COVID crash. FCF growers in export industries bounced harder as global trade rebounded.
2004 (+9.3% excess), 2014 (+5.7% excess), and 2019 (+8.4% excess) show consistent outperformance in years when the broader market rose but investors rewarded quality over momentum.
When It Fails
2022: +5.1% vs DAX +25.9%, -20.8% excess. The worst single year. The DAX had a strong rebound while the FCF growth portfolio lagged badly. This was a year when the market rewarded cyclical recovery plays and momentum, not FCF quality.
2006: +25.2% vs DAX +39.3%, -14.1% excess. The DAX had an exceptional year driven by a broad-based rally. The FCF growth screen missed some of the momentum.
2021: -26.7% vs DAX -18.4%, -8.3% excess. Both fell, but the portfolio fell harder. Global growth-at-any-price dominated, and FCF discipline is a value-adjacent signal. It underperforms when the market rewards speculative growth.
2023: +8.2% vs DAX +14.3%, -6.1% excess. The DAX recovered while the FCF portfolio lagged. Momentum and cyclical themes drove the German market's 2023 return.
2018: -3.4% vs DAX +2.4%, -5.8% excess. The portfolio declined while the DAX eked out a small gain. A year when quality factors didn't help.
The pattern in failure years: when momentum themes or cyclical recovery plays dominate, this strategy lags. That's a predictable feature, not a random bug.
The 2008 Result
2008 is worth isolating because it's the only major crisis year in the data set.
The portfolio lost -25.7% while the DAX lost -25.2%. That's a -0.5% excess return, meaning the portfolio slightly underperformed during the worst of the financial crisis. The FCF growth screen provided no protection in 2008 itself.
But the surrounding years tell a different story. 2007 (+18.0% excess) and 2009 (+1.6% excess) show the portfolio avoided some of the pre-crisis euphoria and captured the recovery. Over the 2007-2009 period, the cumulative excess return was positive.
The 2008 result shows that in the worst single year of a crisis, quality screens don't eliminate losses. They cushion the blow in some markets (Canada, US) but not in Germany. This is an honest limitation.
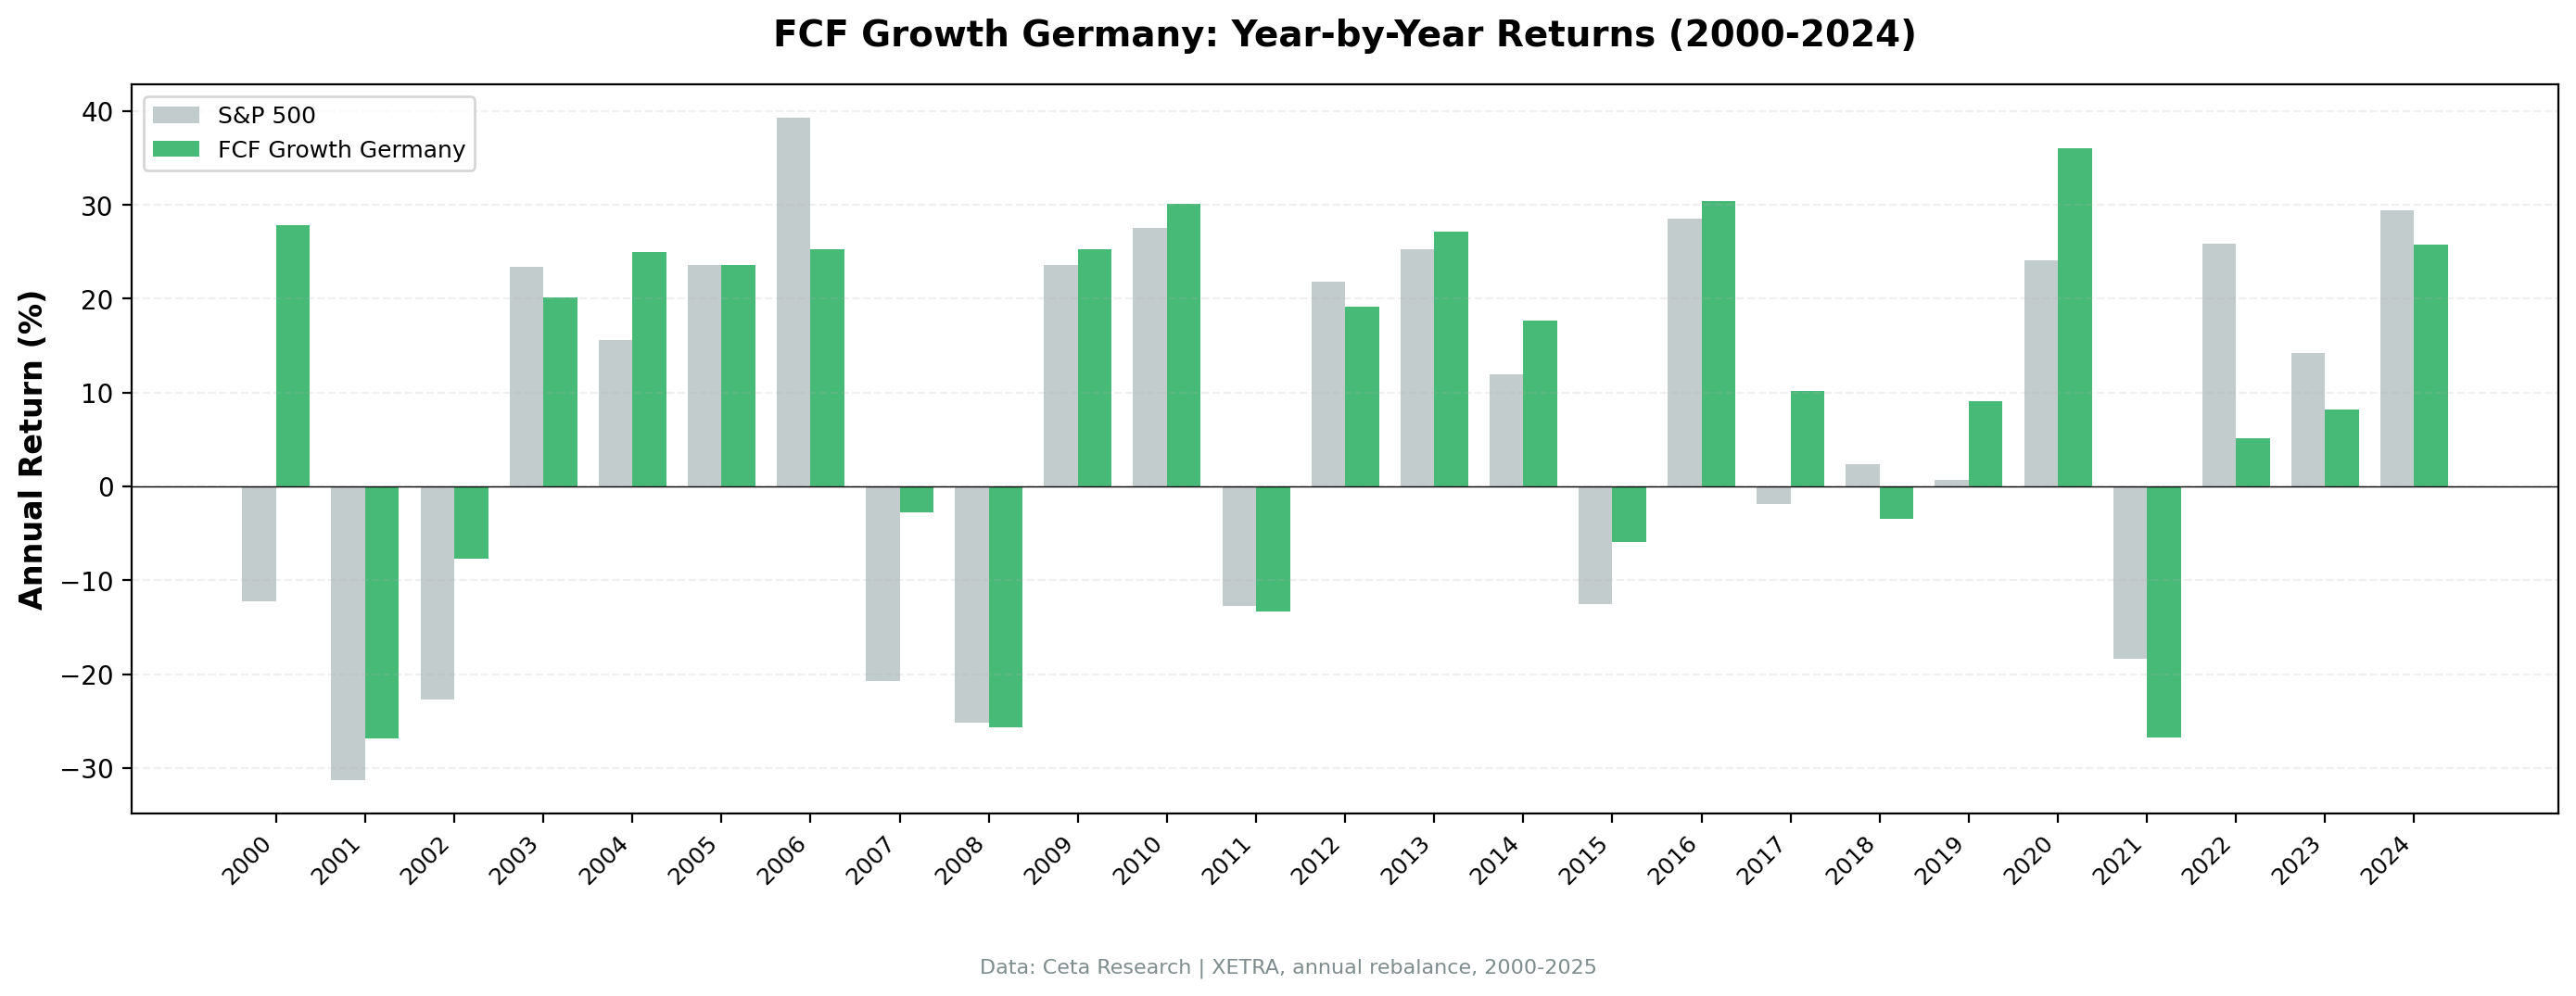
Annual Returns
| Year | Portfolio | DAX | Excess |
|---|---|---|---|
| 2000 | +27.9% | -12.2% | +40.1% |
| 2001 | -26.9% | -31.3% | +4.5% |
| 2002 | -7.7% | -22.8% | +15.0% |
| 2003 | +20.2% | +23.4% | -3.2% |
| 2004 | +25.0% | +15.6% | +9.3% |
| 2005 | +23.6% | +23.6% | +0.0% |
| 2006 | +25.2% | +39.3% | -14.1% |
| 2007 | -2.8% | -20.8% | +18.0% |
| 2008 | -25.7% | -25.2% | -0.5% |
| 2009 | +25.2% | +23.6% | +1.6% |
| 2010 | +30.1% | +27.6% | +2.5% |
| 2011 | -13.3% | -12.7% | -0.6% |
| 2012 | +19.1% | +21.8% | -2.6% |
| 2013 | +27.2% | +25.3% | +1.9% |
| 2014 | +17.6% | +12.0% | +5.7% |
| 2015 | -5.9% | -12.5% | +6.6% |
| 2016 | +30.4% | +28.5% | +1.9% |
| 2017 | +10.2% | -1.9% | +12.1% |
| 2018 | -3.4% | +2.4% | -5.8% |
| 2019 | +9.1% | +0.7% | +8.4% |
| 2020 | +36.0% | +24.1% | +11.9% |
| 2021 | -26.7% | -18.4% | -8.3% |
| 2022 | +5.1% | +25.9% | -20.8% |
| 2023 | +8.2% | +14.3% | -6.1% |
| 2024 | +25.8% | +29.5% | -3.7% |
The portfolio beat the DAX in 15 of 25 years. The outperforming years include the largest crisis years (2000, 2002, 2007) and several recovery years. The underperforming years were mostly years when the DAX was driven by momentum or cyclical themes the FCF screen missed.
Limitations
Backward-looking signal. FCF growth from the prior fiscal year doesn't predict next year's FCF growth. A company that grew cash last year may face margin compression, capex needs, or competitive pressure this year. The screen captures historical quality, not future quality.
Currency risk. All returns are in EUR. For USD-based investors, EUR/USD fluctuations would affect realized returns. Over 25 years, the EUR has been volatile against USD.
Export exposure. Germany's equity market is heavily weighted toward exporters (autos, industrials, chemicals). The FCF growth screen will naturally tilt toward or away from these sectors depending on where cash generation is accelerating. Without sector-neutral analysis, it's unclear how much of the excess return comes from the FCF signal versus sector tilts.
Transaction costs. The backtest uses size-tiered cost estimates. Real-world costs depend on position sizing, liquidity, and execution.
Point-in-time data. All rebalances use data available 45 days after fiscal year-end to prevent lookahead bias. Live implementation requires access to a verified point-in-time financial data feed.
Market cap threshold. €400M is mid-cap territory in Germany. Some qualifying stocks may have liquidity constraints for larger portfolios.
25-year sample. The period includes two major market dislocations (dot-com, 2008) and several European-specific crises (sovereign debt). Different macro regimes could produce different outcomes.
Global Context
This analysis covers XETRA-listed stocks only. The FCF growth signal behaves differently across markets. Germany's results (8.34% CAGR, +3.30% excess vs DAX) outperform the US version (6.29% CAGR, -1.56% excess vs SPY) significantly. A full global comparison is covered in the companion blog on international FCF growth results.
Run It Yourself
The full backtest code is open source at github.com/ceta-research/backtests. You can reproduce every number in this post.
To run the Germany FCF growth strategy:
python run_backtest.py --strategy fcf-growth --exchange XETRA
The data runs through Ceta Research's data platform, which covers 70,000+ global securities with FMP fundamentals, EOD prices, and a DuckDB query layer. You can explore the underlying financial data directly at cetaresearch.com/data-explorer before running anything locally.
Data: Ceta Research (FMP warehouse), TTM metrics. Backtest period: 2000–2025. Returns in EUR. Execution: MOC (next-day close).
Past performance does not guarantee future results. This is educational content, not investment advice.


