
FCF Conversion Quality on UK Stocks: 84% Win Rate and 18% Down Capture vs FTSE 100
FCF Conversion on LSE stocks returned 8.64% CAGR from 2000-2025, beating the FTSE 100 (1.23%) by 7.42% annually. 84% win rate, 18% down capture. The strongest relative performer in our global analysis.

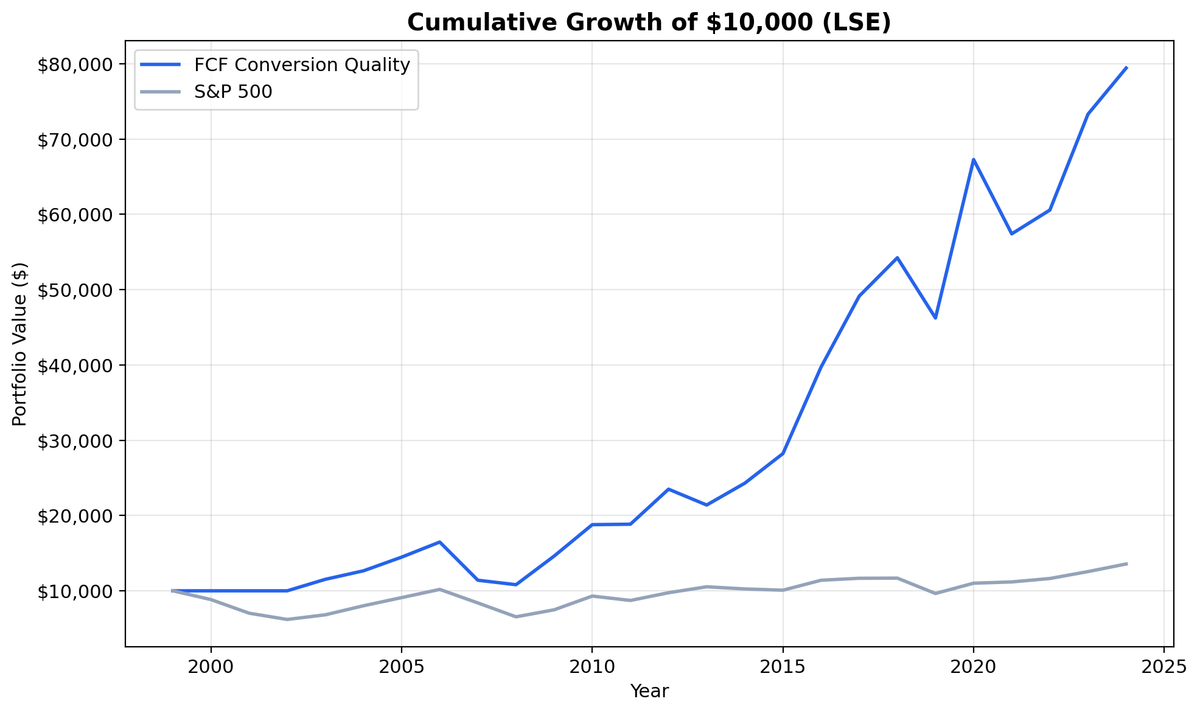
The UK results are the strongest relative performer in our global analysis. We ran our FCF Conversion Quality screen on LSE-listed stocks from 2000 to 2025 and found an 8.64% CAGR in GBP, beating the FTSE 100 (1.23% CAGR) by 7.42% annually. An 84% win rate. An 18.51% down capture. In years when the FTSE fell, the strategy absorbed less than a fifth of the losses. $10,000 grew to ~$79,000 vs the FTSE's ~$14,000.
Contents
- Method
- The Screen (SQL)
- What We Found
- $10,000 grew to ~$79,000 in GBP. The FTSE 100 reached ~$14,000.
- Annual Returns
- 2008: Protection when it mattered
- 2009 and 2020: Recovery dominance
- When It Works
- When It Struggles
- Limitations
- Run It Yourself
- Part of a Series
Data: FMP financial data warehouse, 2000–2025. Updated March 2026.
Method
Data source: Ceta Research (FMP financial data warehouse) Universe: LSE (London Stock Exchange), market cap > £500M (~$635M USD) Period: 2000-2025 (25 years, 25 annual periods) Rebalancing: Annual (July), top 30 by highest FCF conversion, equal weight Execution: Next-day close (market-on-close) Benchmark: FTSE 100 Total Return (GBP) Cash rule: Hold cash if fewer than 10 stocks qualify Costs: Size-tiered transaction costs (0.1% large-cap, 0.3% mid-cap, 0.5% small-cap)
Financial data uses a 45-day lag to prevent look-ahead bias. Trades execute at the next trading day's closing price to reflect realistic fill assumptions. Returns are in GBP. Full methodology: Ceta Research Backtest Methodology.
For a detailed explanation of FCF Conversion as a quality signal and the academic research behind it, see the US FCF Conversion Quality post.
The Screen (SQL)
SELECT
  c.symbol, p.companyName,
  ROUND(c.freeCashFlow / NULLIF(i.netIncome, 0) * 100, 1) AS fcf_conversion_pct,
  ROUND(c.freeCashFlow / NULLIF(i.revenue, 0) * 100, 1) AS fcf_margin_pct,
  ROUND(k.returnOnEquityTTM * 100, 1) AS roe_pct,
  ROUND(r.operatingProfitMarginTTM * 100, 1) AS op_margin_pct,
  ROUND(k.marketCap / 1e9, 1) AS mktcap_bn
FROM cash_flow_statement_ttm c
JOIN income_statement_ttm i ON c.symbol = i.symbol
JOIN key_metrics_ttm k ON c.symbol = k.symbol
JOIN financial_ratios_ttm r ON c.symbol = r.symbol
JOIN profile p ON c.symbol = p.symbol
WHERE i.netIncome > 0 AND c.freeCashFlow > 0
  AND c.freeCashFlow / NULLIF(i.netIncome, 0) > 1.0
  AND c.freeCashFlow / NULLIF(i.netIncome, 0) < 3.0
  AND c.freeCashFlow / NULLIF(i.revenue, 0) > 0.10
  AND k.returnOnEquityTTM > 0.10
  AND r.operatingProfitMarginTTM > 0.10
  AND k.marketCap > 500e6  -- £500M (~$635M USD)
  AND p.exchange IN ('LSE')
ORDER BY c.freeCashFlow / NULLIF(i.netIncome, 0) DESC
LIMIT 30
Run this query on Ceta Research
What We Found

$10,000 grew to ~$79,000 in GBP. The FTSE 100 reached ~$14,000.
| Metric | FCF Conversion (GBP) | FTSE 100 (GBP) |
|---|---|---|
| CAGR | 8.64% | 1.23% |
| Total Return | 694% | ~40% |
| Excess CAGR | +7.42% | - |
| Max Drawdown | -34.38% | - |
| Sharpe Ratio | 0.287 | - |
| Sortino Ratio | 0.559 | - |
| Down Capture | 18.51% | - |
| Win Rate (annual) | 84% | - |
| Avg Stocks per Period | 14.8 | - |
| Cash Periods | 3 of 25 | - |
Two numbers stand out. The 84% win rate is the highest of any exchange in our global analysis. The strategy beat the FTSE 100 in 21 out of 25 years. And the 18.51% down capture means that in years when the FTSE fell, the strategy absorbed less than a fifth of the losses. That combination of consistency and protection is rare.
The honest caveat: the FTSE 100 has been a weak index. At 1.23% CAGR over 25 years, it barely kept pace with inflation. Part of the 7.42% excess return reflects the weak benchmark, not just signal strength. Still, the down capture and win rate tell a real story about quality selection on the LSE.
The average of 14.8 stocks per period is the smallest of any exchange in our global analysis. The FCF Conversion filters are more selective on the LSE. Fewer UK large-caps pass all five quality thresholds simultaneously. This concentration means each qualifying company has more influence on portfolio outcomes.
Annual Returns
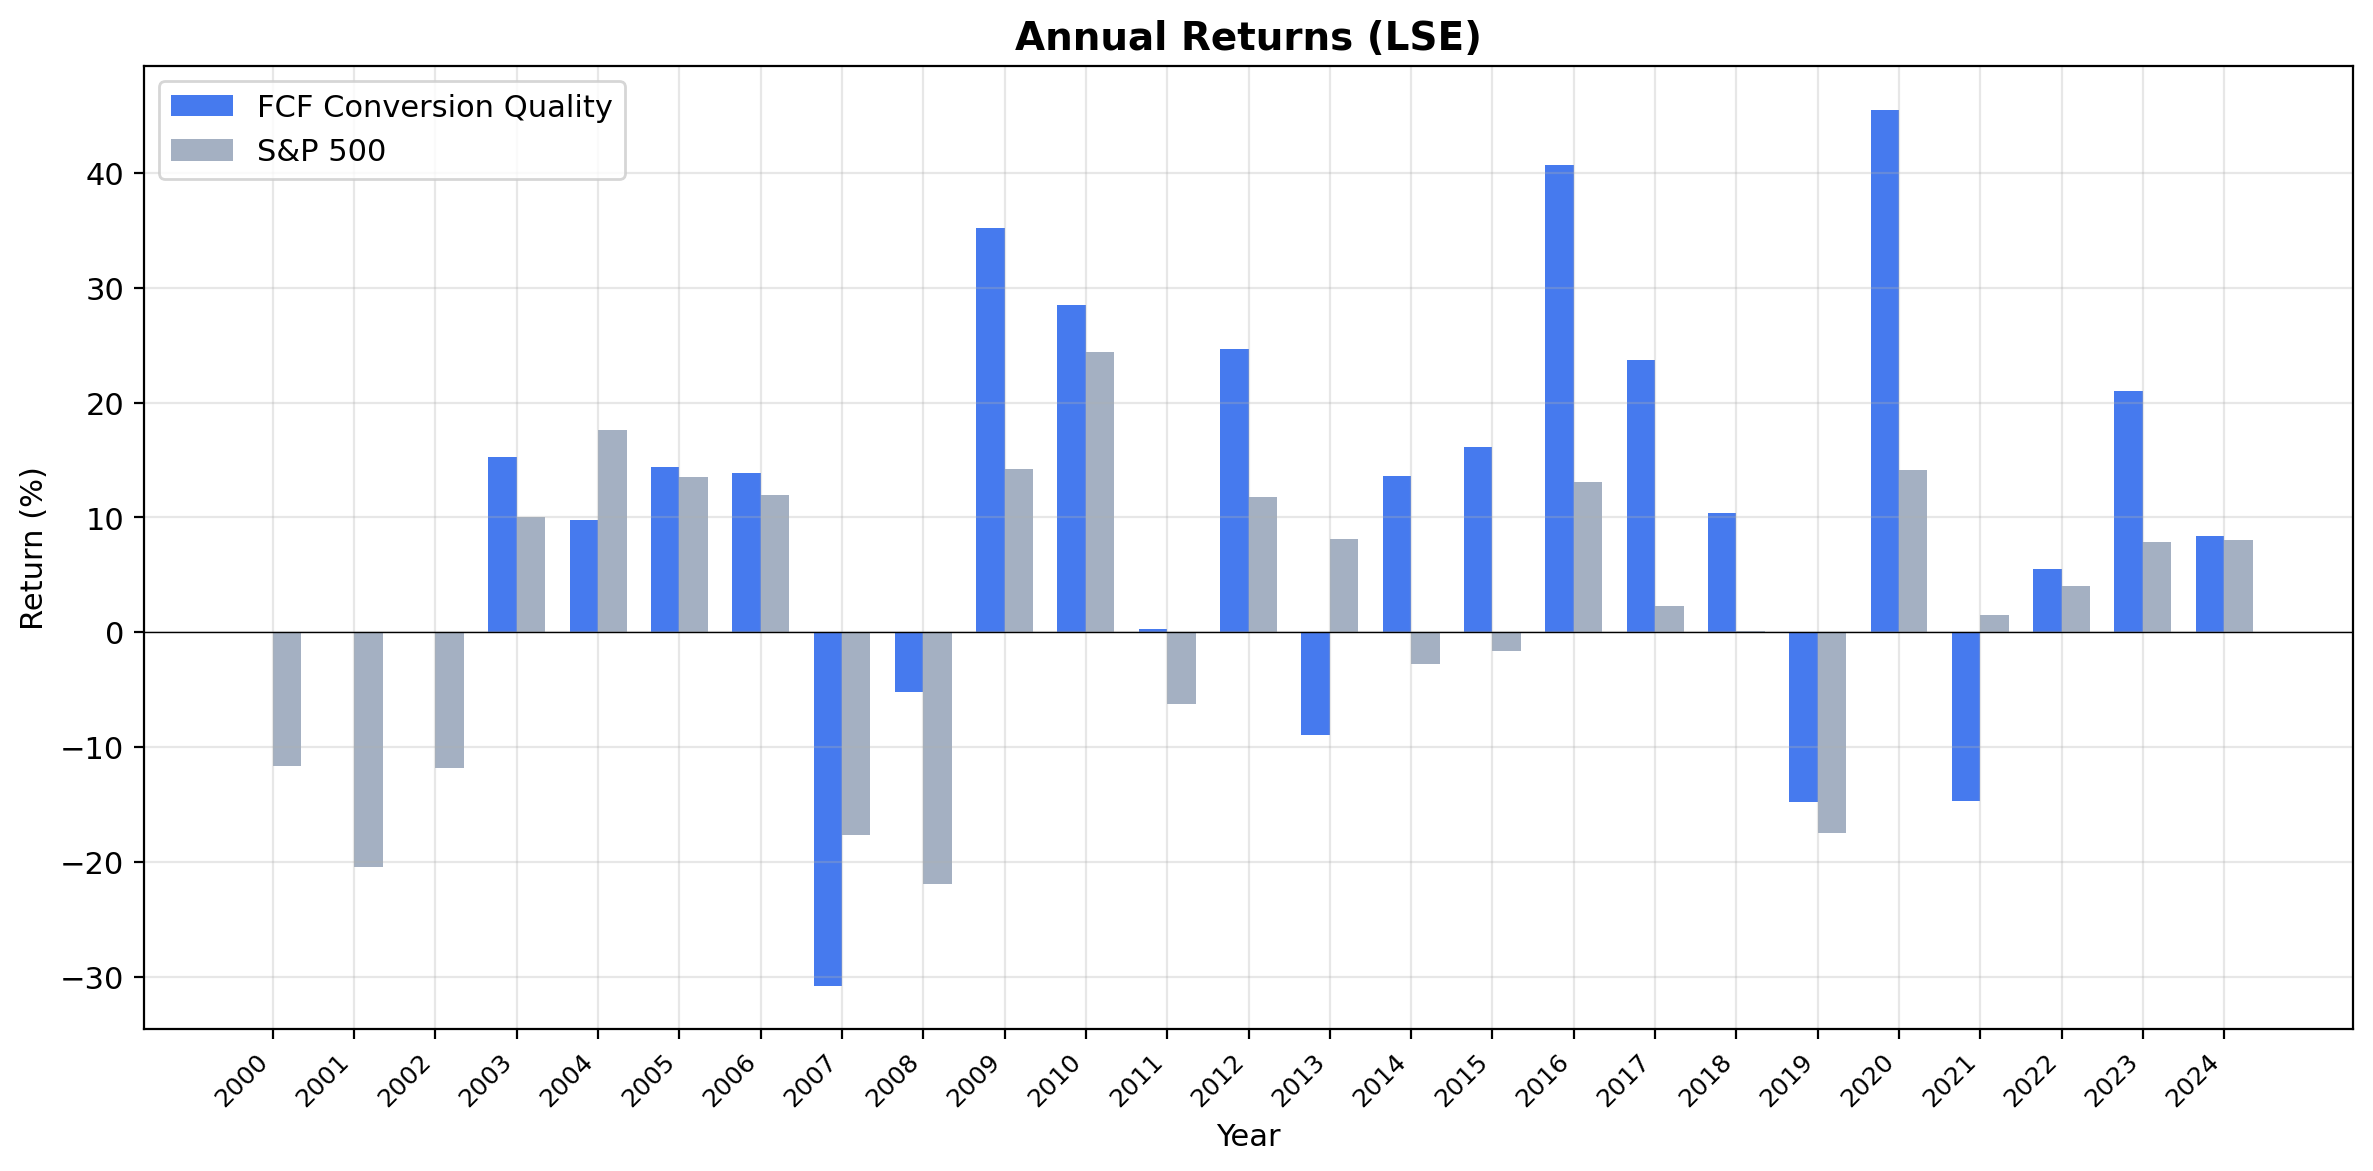
| Year | Strategy (GBP) | FTSE 100 (GBP) | Excess |
|---|---|---|---|
| 2008 | -5.2% | -22.0% | +16.8% |
| 2009 | +35.2% | +14.3% | +20.9% |
| 2020 | +40.1% | +10.5% | +29.6% |
2008: Protection when it mattered
The FTSE 100 fell 22.0%. The LSE FCF Conversion portfolio lost just 5.2%. UK companies passing the screen in 2007 were generating real cash, carrying manageable leverage, and reporting earnings backed by actual money. When credit markets froze, these were the companies that survived without bailouts or emergency capital raises. The screen filtered out UK banks and financial firms with aggressive accruals, which bore the brunt of the crisis.
2009 and 2020: Recovery dominance
In 2009, the strategy returned 35.2% vs the FTSE's 14.3%. In 2020, it returned 40.1% vs 10.5%. Cash-rich companies lead recoveries because they don't need to raise capital to invest in growth. They're already generating the cash. The 84% win rate means years like these aren't outliers. They're the norm.
When It Works
Financial crises. UK cash generators proved resilient during 2001-2002, 2008, and 2020. The LSE has a large financial sector, and the FCF Conversion screen systematically avoids companies with opaque, accrual-heavy balance sheets. This is exactly what you want before a banking crisis.
Inflation-adjusted periods. The UK economy has dealt with persistent inflation at various points over the past 25 years. Companies with high FCF conversion tend to have pricing power (reflected in the operating margin filter), which protects real returns during inflationary periods.
Dividend-paying environments. Many UK quality companies are consistent dividend payers. The total return figures capture reinvested dividends, and UK firms with high cash conversion can sustain dividends through downturns because they're paying from real cash, not accounting profits.
When It Struggles
US-led growth rallies. When US tech and growth stocks dominate global equity returns (2013, 2019), the UK quality universe falls behind. The LSE is structurally underweight in high-growth technology.
Brexit uncertainty. The 2016-2019 period introduced persistent policy uncertainty for UK-listed companies. Even high-quality firms faced valuation compression as investors de-risked UK exposure.
Small qualifying universe. With only 15 stocks on average, the portfolio is more concentrated than other exchanges. One or two bad picks have outsized impact.
Limitations
Weak benchmark. The FTSE 100 returned just 1.23% CAGR over this period. A significant portion of the 7.42% excess reflects the weak baseline. Investors should consider absolute returns (8.64% CAGR) alongside the relative outperformance.
Small portfolio. 14.8 stocks per period is concentrated. Individual company risk is higher than in exchanges where 25-30 stocks qualify.
Sector composition. The LSE is weighted toward financials, energy, consumer staples, and healthcare. The qualifying universe inherits this concentration.
Survivorship bias. Delisted UK companies aren't fully captured, especially pre-2005.
Brexit effects. The 2016-2019 period may not be representative of future UK equity behavior. Post-Brexit trade arrangements are still evolving.
No local taxes modeled. UK stamp duty (0.5% on purchases) and capital gains taxes aren't included. Stamp duty in particular would reduce returns on annual rebalancing.
Run It Yourself
Live screen:
python3 fcf-conversion/screen.py --preset uk
Full backtest:
python3 fcf-conversion/backtest.py --preset uk --output results.json --verbose
Code: github.com/ceta-research/backtests/tree/main/fcf-conversion
Part of a Series
This is the UK edition of our FCF Conversion Quality analysis. We ran the same screen on 15 exchanges globally:
- FCF Conversion on US Stocks (NYSE + NASDAQ + AMEX) - 9.68% CAGR, the baseline
- India: +6.13% excess vs Sensex, best absolute return at 18.18% CAGR
- Canada: highest Sharpe (0.443) among outperformers
- Global comparison: all exchanges side by side
Data: Ceta Research (FMP financial data warehouse), 2000-2025. Returns in GBP. Benchmark: FTSE 100 Total Return. Execution: next-day close (MOC). Full methodology: github.com/ceta-research/backtests/blob/main/METHODOLOGY.md
Past performance does not guarantee future results. This is research content, not investment advice.


