
FCF Conversion Quality on Taiwanese Stocks: Lowest Drawdown, Lowest Volatility of Any Exchange
We ran our FCF Conversion screen on TWSE stocks from 2000-2025. 3.69% CAGR in TWD, trailing the TAIEX (4.09%) by just 0.39%. Max drawdown of -22.6% is the shallowest of any exchange. Similar returns to the index with significantly lower risk, but 7 cash periods drag performance.


Taiwan produced the safest version of this strategy we've seen anywhere. We ran our FCF Conversion Quality screen on TWSE stocks from 2000 to 2025 and found 3.69% CAGR in New Taiwan Dollars, trailing the TAIEX (4.09% CAGR) by just 0.39% annually. $10,000 grew to ~$25K vs ~$27K for the index. The max drawdown was just -22.59%, the shallowest of any exchange in the 14-market dataset. The strategy roughly matches the TAIEX with lower drawdown, but 7 cash periods out of 25 is a real limitation.
Contents
- Method
- The Screen (SQL)
- What We Found
- $10,000 grew to ~$25K in TWD. The TAIEX reached ~$27K.
- Annual Returns
- 7 cash periods
- Why Taiwan Is Different
- When It Works
- When It Struggles
- Currency Context
- Limitations
- Run It Yourself
- Part of a Series
Data: FMP financial data warehouse, 2000–2025. Updated March 2026.
Method
Data source: Ceta Research (FMP financial data warehouse) Universe: TWSE (TAI), market cap > NT$10B (~$312M USD) Period: 2000-2025 (25 years, 25 annual periods) Rebalancing: Annual (July), top 30 by highest FCF conversion, equal weight Execution: Next-day close (market-on-close) Benchmark: TAIEX (local index, TWD) Cash rule: Hold cash if fewer than 10 stocks qualify Costs: Size-tiered transaction costs (0.1% large-cap, 0.3% mid-cap, 0.5% small-cap)
Financial data uses a 45-day lag to prevent look-ahead bias. July rebalancing ensures annual filings are available. Trades execute at the next trading day's close to avoid same-day entry bias. Returns are in TWD. Full methodology: Ceta Research Backtest Methodology.
For a detailed explanation of FCF Conversion as a quality signal and the academic research behind it, see the US FCF Conversion Quality post.
The Screen (SQL)
SELECT
  c.symbol, p.companyName,
  ROUND(c.freeCashFlow / NULLIF(i.netIncome, 0) * 100, 1) AS fcf_conversion_pct,
  ROUND(c.freeCashFlow / NULLIF(i.revenue, 0) * 100, 1) AS fcf_margin_pct,
  ROUND(k.returnOnEquityTTM * 100, 1) AS roe_pct,
  ROUND(r.operatingProfitMarginTTM * 100, 1) AS op_margin_pct,
  ROUND(k.marketCap / 1e9, 1) AS mktcap_bn
FROM cash_flow_statement_ttm c
JOIN income_statement_ttm i ON c.symbol = i.symbol
JOIN key_metrics_ttm k ON c.symbol = k.symbol
JOIN financial_ratios_ttm r ON c.symbol = r.symbol
JOIN profile p ON c.symbol = p.symbol
WHERE i.netIncome > 0 AND c.freeCashFlow > 0
  AND c.freeCashFlow / NULLIF(i.netIncome, 0) > 1.0
  AND c.freeCashFlow / NULLIF(i.netIncome, 0) < 3.0
  AND c.freeCashFlow / NULLIF(i.revenue, 0) > 0.10
  AND k.returnOnEquityTTM > 0.10
  AND r.operatingProfitMarginTTM > 0.10
  AND k.marketCap > 10e9  -- NT$10B (~$312M USD)
  AND p.exchange IN ('TAI')
ORDER BY c.freeCashFlow / NULLIF(i.netIncome, 0) DESC
LIMIT 30
Run this query on Ceta Research
What We Found
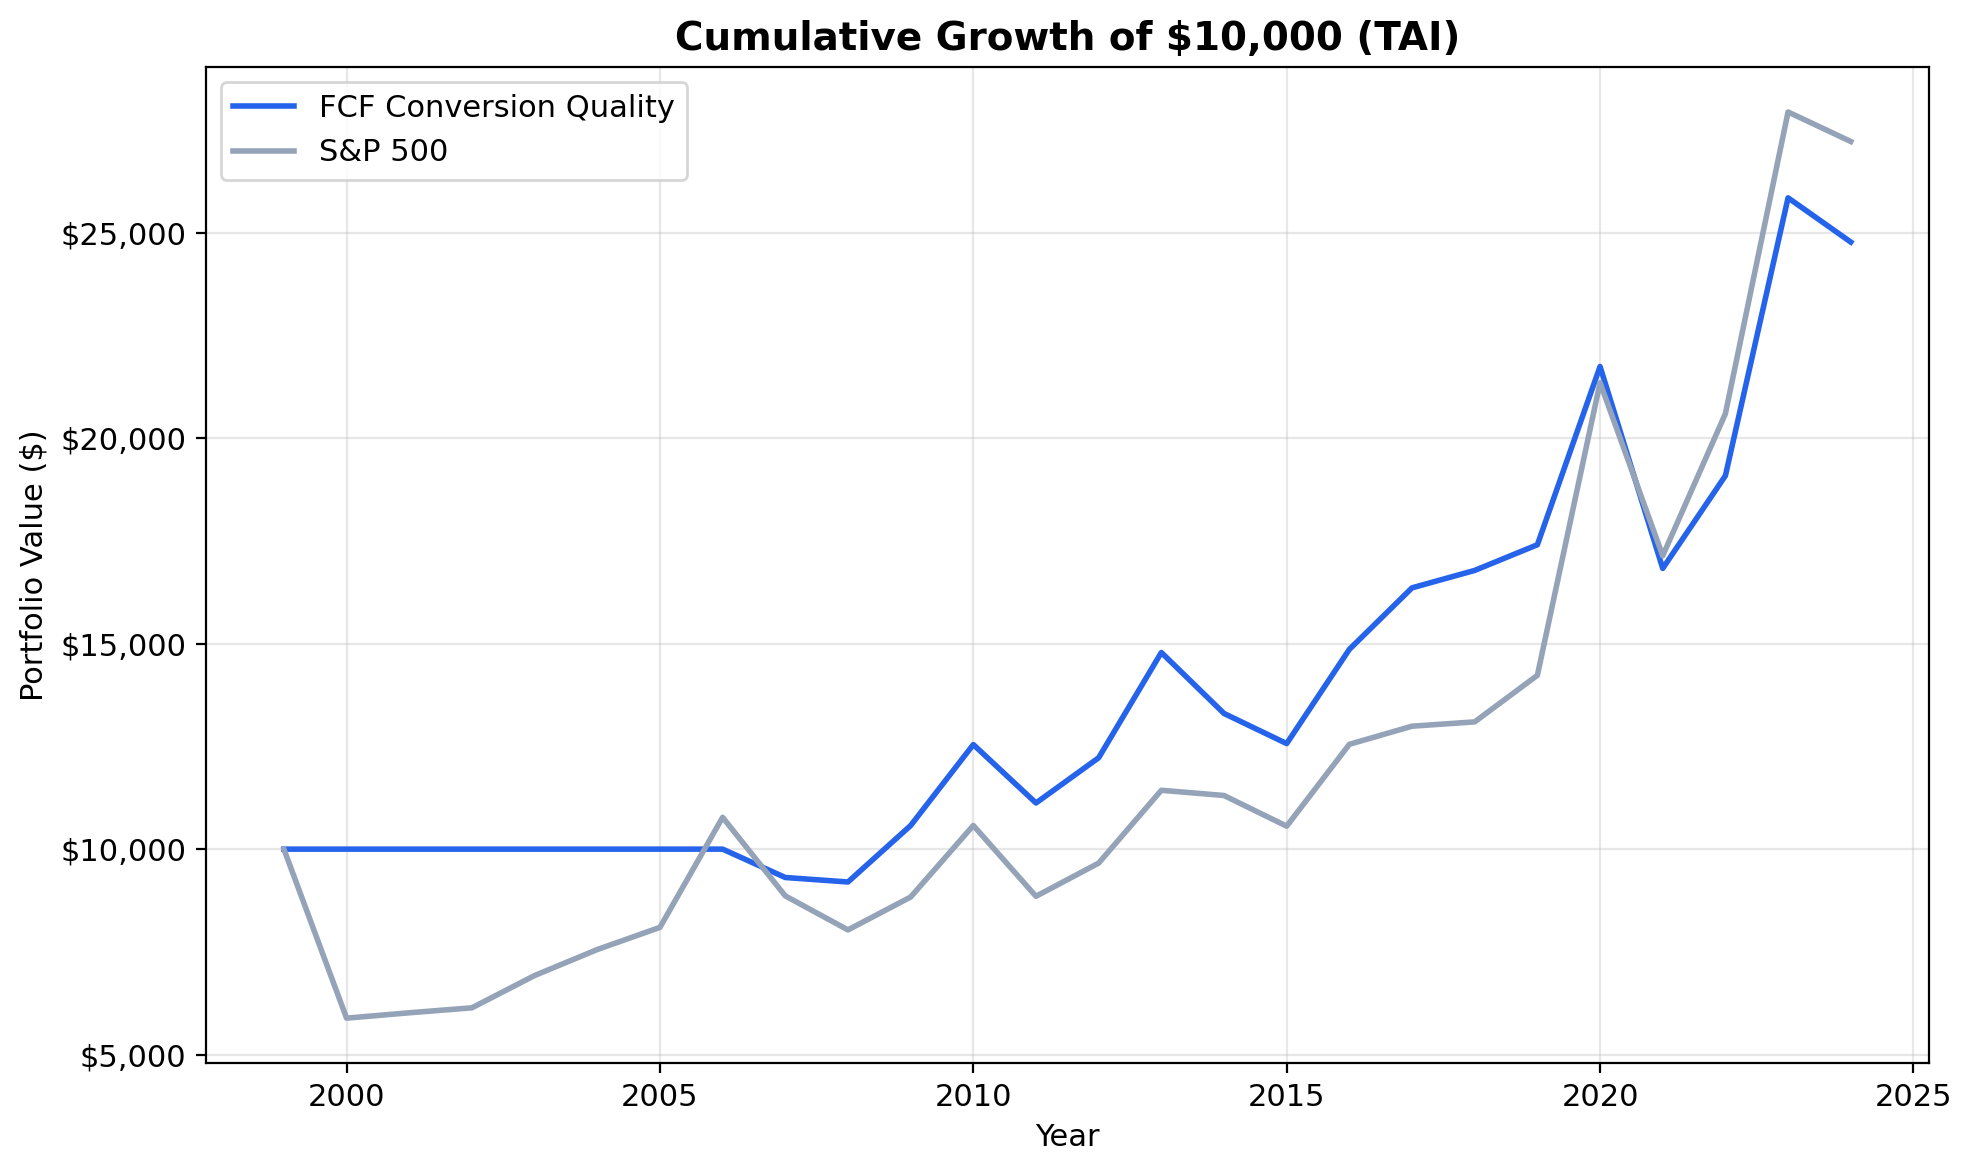
$10,000 grew to ~$25K in TWD. The TAIEX reached ~$27K.
| Metric | FCF Conversion (TWD) | TAIEX |
|---|---|---|
| CAGR | 3.69% | 4.09% |
| Total Return | 148% | ~170% |
| Excess CAGR | -0.39% | - |
| Max Drawdown | -22.59% | - |
| Sharpe Ratio | 0.21 | - |
| Sortino Ratio | 0.432 | - |
| Down Capture | 53.90% | - |
| Win Rate (annual) | 40% | - |
| Avg Stocks per Period | 24.1 | - |
| Cash Periods | 7 of 25 | - |
The returns roughly match the TAIEX, trailing by just 0.39% annually. That's close enough to call it a wash on returns. The value proposition is on the risk side: -22.59% max drawdown is the shallowest of any exchange we tested. Down capture of 53.90% means the portfolio absorbed about half of the TAIEX's losses during down years.
The 40% win rate is honest. The strategy beats the local index in 10 of 25 years. Combined with 7 cash periods, there are a lot of years where the strategy is either sitting on the sidelines or trailing.
Annual Returns
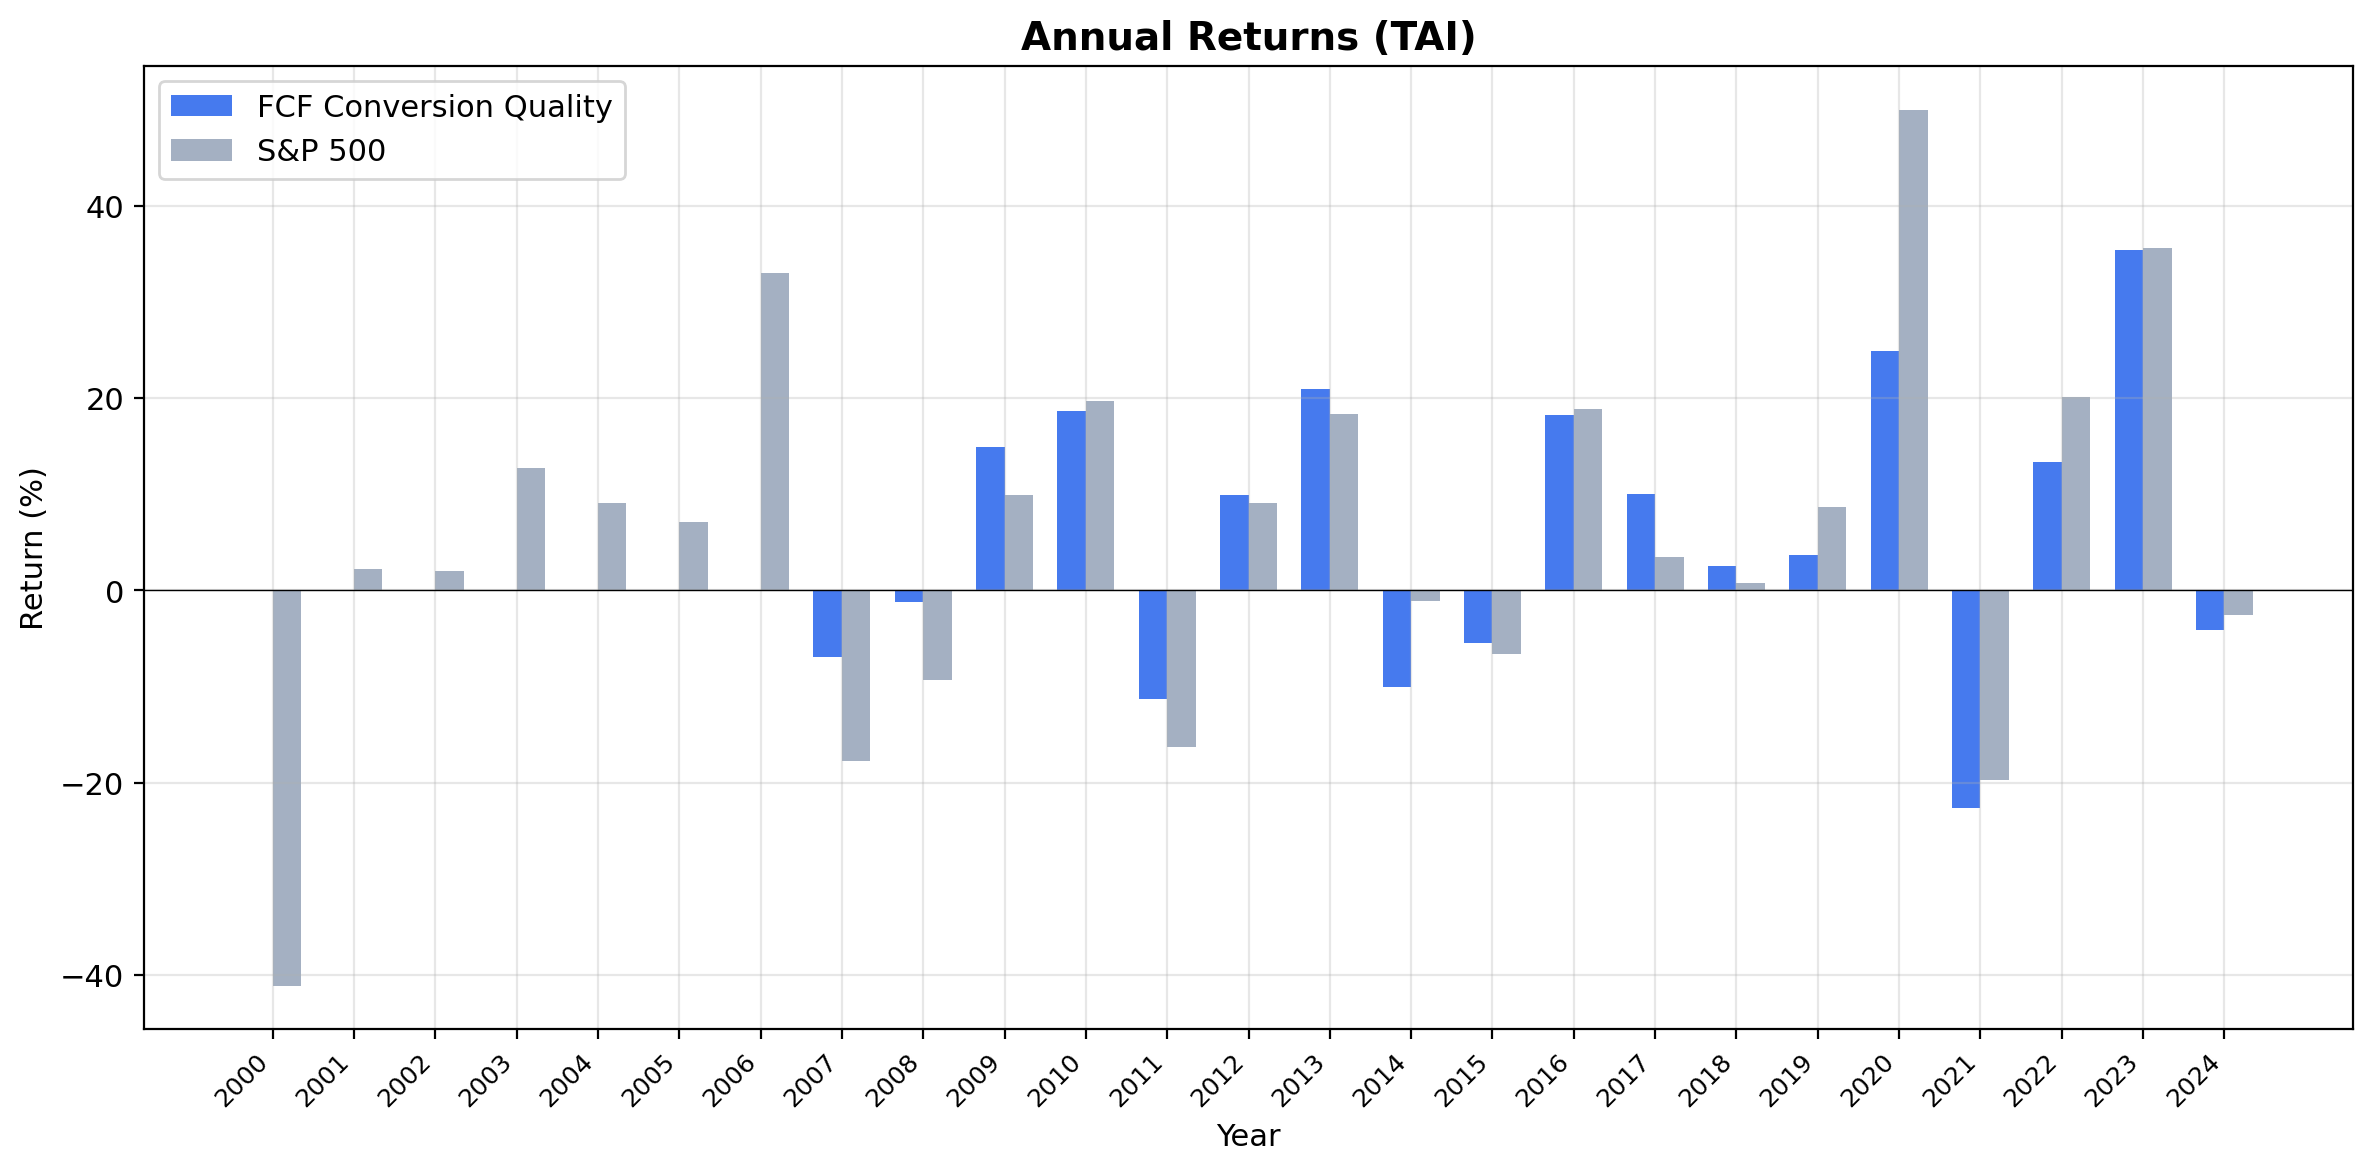
The strategy's value isn't in generating big excess returns. It's in providing similar returns to the TAIEX with significantly lower drawdown. The -22.59% max drawdown compared to the index's deeper swings means you keep more capital during downturns.
7 cash periods
The biggest limitation is data coverage. In 7 of 25 years, fewer than 10 Taiwanese stocks passed all filters, triggering the cash rule. That's 28% of the backtest spent on the sidelines. FMP's coverage of Taiwanese companies improved over time, so early-period cash is primarily a data limitation. But it drags the compound return and explains much of the -0.39% excess shortfall.
Why Taiwan Is Different
Taiwan's equity market is dominated by semiconductors and electronics. TSMC alone accounts for a massive share of the TWSE's market cap. The companies passing our screen tend to be in the semiconductor supply chain, precision electronics, and IC design. These businesses share common traits:
Asset-light models. Fabless chip designers and electronics companies don't carry the heavy capital expenditure of foundries. Their depreciation is low relative to cash flow, which naturally pushes FCF conversion ratios above 100%.
Structural cash generation. Taiwan's tech companies operate in global supply chains where payment terms and inventory cycles are well-established. Working capital movements are predictable. That translates to consistent cash flow.
Concentrated quality. Taiwan doesn't have a sprawling equity market with thousands of companies across dozens of sectors. The universe is narrower and more homogeneous. The quality filter ends up selecting the best operators in an already-concentrated field.
This concentration is why the volatility is so low. The qualifying companies are similar to each other, move together, and don't exhibit the wild divergence you see in broader markets.
When It Works
Global risk-off periods. Taiwan's cash-rich companies have minimal exposure to credit cycles. They sell products, collect cash, and don't rely on debt markets. When global liquidity dries up, they keep operating.
Semiconductor upcycles. When chip demand is strong, FCF conversion for Taiwan's tech companies spikes. The screen captures this naturally.
Currency stability. The TWD has been relatively stable against the USD compared to many emerging market currencies. This reduces the noise in cross-border comparisons.
When It Struggles
Data gaps. 7 of 25 years were cash periods. That's 28% of the backtest spent on the sidelines. FMP's coverage of Taiwanese companies improved over time, so early-period cash isn't a signal failure. It's a data limitation.
Broad rallies. The 40% win rate means the strategy trails the TAIEX more often than it leads. When the broad market surges on semiconductor demand or tech cycles, quality screening is too conservative to keep up.
Currency Context
Both the strategy and the TAIEX benchmark are in New Taiwan Dollars, so the comparison is clean. No currency mismatch to worry about.
Limitations
Cash drag. 7 of 25 periods in cash is significant. The 3.69% CAGR includes those dead years, which pulls down the compound return.
Narrow market. Taiwan's equity market is heavily concentrated in technology. The screen's results are driven by a single sector more than in any other exchange.
Low win rate. 40% win rate means the strategy trails the TAIEX in most years. The value is in lower drawdown, not outperformance.
Survivorship bias. Delisted Taiwanese companies aren't fully captured in early years.
Small exchange universe. With 24.1 average stocks qualifying, the strategy is selecting from a limited pool. In years with fewer qualifying companies, concentration risk increases.
Run It Yourself
Live screen:
python3 fcf-conversion/screen.py --preset taiwan
Full backtest:
python3 fcf-conversion/backtest.py --preset taiwan --output results.json --verbose
Code: github.com/ceta-research/backtests/tree/main/fcf-conversion
Part of a Series
This is the Taiwan edition of our FCF Conversion Quality analysis. We ran the same screen on 15 exchanges globally:
- FCF Conversion on US Stocks (NYSE + NASDAQ + AMEX) - 9.68% CAGR, the baseline
- India: +6.13% excess vs Sensex, best absolute return at 18.18% CAGR, best absolute return
- Japan: corporate governance reforms meet FCF quality signal
- Thailand: low beta, honest underperformance
- Global comparison: all 15 exchanges side by side
Data: Ceta Research (FMP financial data warehouse), 2000-2025. Execution: next-day close (market-on-close). Benchmark: TAIEX. Returns in TWD. Full methodology: github.com/ceta-research/backtests/blob/main/METHODOLOGY.md
Past performance does not guarantee future results. This is research content, not investment advice.


