
FCF Conversion Quality on Swiss Stocks: +6.35% Over SMI with 80% Win Rate
Switzerland produced +6.35% excess CAGR over the SMI, the widest gap of any exchange we tested. 8.09% CAGR, 80% win rate, 31% down capture. $10K grew to ~$70K vs ~$15K for the SMI. Quality multinationals convert earnings to cash with less noise than any other market.

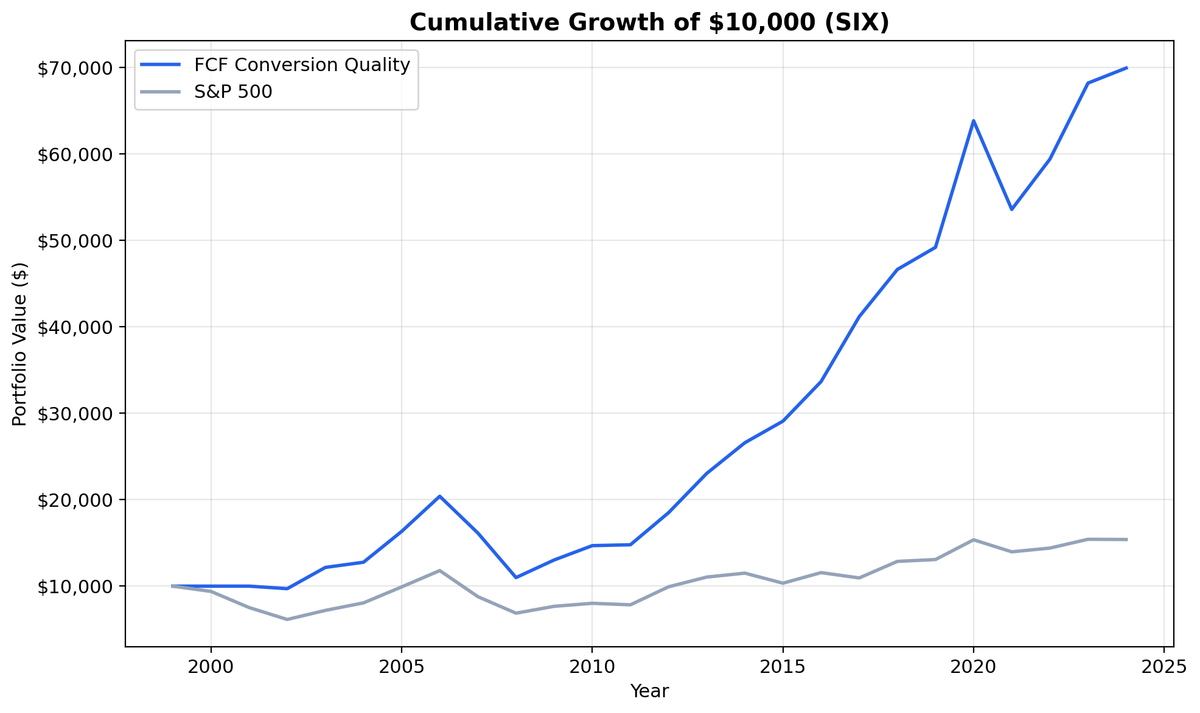
Switzerland produced +6.35% excess CAGR over the SMI, the widest gap of any exchange we tested for FCF conversion quality. The strategy returned 8.09% CAGR while the SMI managed just 1.74%. $10,000 grew to ~$70K vs ~$15K for the index. The 80% win rate and 31.09% down capture are exceptional. Swiss quality multinationals don't just convert earnings to cash. They do it with less drawdown and less noise than almost any other market.
Contents
- Method
- The Signal
- The Screen (SQL)
- What We Found
- $10,000 grew to ~$70K. The SMI reached ~$15K.
- Annual Returns
- Limitations
- Run It Yourself
- Part of a Series
Data: FMP financial data warehouse, 2000–2025. Updated March 2026.
Method
Data source: Ceta Research (FMP financial data warehouse) Universe: SIX Swiss Exchange, market cap > ~$568M USD equivalent Period: 2000-2025 (25 years, 25 annual periods) Rebalancing: Annual (July), top 30 by highest FCF conversion, equal weight Execution: Next-day close (market-on-close) Benchmark: SMI (Swiss Market Index, CHF) Cash rule: Hold cash if fewer than 10 stocks qualify Costs: Size-tiered transaction costs (0.1% large-cap, 0.3% mid-cap, 0.5% small-cap) Currency: Returns in CHF.
Financial data uses a 45-day lag to prevent look-ahead bias. July rebalancing ensures annual filings are available. Trades execute at the next trading day's close to avoid same-day entry bias. Full methodology: Ceta Research Backtest Methodology.
This is the Switzerland edition of our US FCF Conversion Quality analysis.
The Signal
| Filter | Threshold | Why |
|---|---|---|
| FCF / Net Income | 100% - 300% | Cash backs reported earnings. Cap at 300% filters tiny-NI noise |
| FCF / Revenue | > 10% | Meaningful absolute cash flow, not just ratio math |
| Return on Equity | > 10% | Profitable business, not just high conversion on low base |
| Operating Margin | > 10% | Real pricing power, sustainable cash generation |
| Net Income | > 0 | Negative denominators make the ratio meaningless |
| Free Cash Flow | > 0 | Only companies generating cash |
| Market Cap | > ~$568M USD | Liquid stocks only |
Selection: Top 30 by highest FCF conversion, equal weight.
The Screen (SQL)
SELECT
  c.symbol,
  p.companyName,
  ROUND(c.freeCashFlow / NULLIF(i.netIncome, 0) * 100, 1) AS fcf_conversion_pct,
  ROUND(c.freeCashFlow / NULLIF(i.revenue, 0) * 100, 1) AS fcf_margin_pct,
  ROUND(k.returnOnEquityTTM * 100, 1) AS roe_pct,
  ROUND(r.operatingProfitMarginTTM * 100, 1) AS op_margin_pct,
  ROUND(k.marketCap / 1e9, 1) AS mktcap_bn
FROM cash_flow_statement_ttm c
JOIN income_statement_ttm i ON c.symbol = i.symbol
JOIN key_metrics_ttm k ON c.symbol = k.symbol
JOIN financial_ratios_ttm r ON c.symbol = r.symbol
JOIN profile p ON c.symbol = p.symbol
WHERE i.netIncome > 0
  AND c.freeCashFlow > 0
  AND c.freeCashFlow / NULLIF(i.netIncome, 0) > 1.0
  AND c.freeCashFlow / NULLIF(i.netIncome, 0) < 3.0
  AND c.freeCashFlow / NULLIF(i.revenue, 0) > 0.10
  AND k.returnOnEquityTTM > 0.10
  AND r.operatingProfitMarginTTM > 0.10
  AND k.marketCap > 500000000
  AND p.exchange IN ('SIX')
ORDER BY c.freeCashFlow / NULLIF(i.netIncome, 0) DESC
LIMIT 30
Run this query on Ceta Research
What We Found

$10,000 grew to ~$70K. The SMI reached ~$15K.
| Metric | FCF Conversion Quality | SMI |
|---|---|---|
| CAGR | 8.09% | 1.74% |
| Total Return | 599% | ~50% |
| Excess CAGR | +6.35% | - |
| Max Drawdown | -46.10% | - |
| Sharpe Ratio | 0.486 | - |
| Sortino Ratio | 0.896 | - |
| Win Rate (annual) | 80% | - |
| Down Capture | 31.09% | - |
| Avg Stocks per Period | 16.3 | - |
| Cash Periods | 2 of 25 | - |
The +6.35% excess CAGR is the standout number. Part of this is the SMI being a weak benchmark at 1.74% CAGR, a price-only index that doesn't include dividends. But the strategy's own metrics are strong: Sharpe of 0.486, Sortino of 0.896, and an 80% win rate. The strategy beat the SMI in 20 of 25 years.
The Swiss market explains the quality of returns. It's dominated by multinationals in pharma (Roche, Novartis), food (Nestle), industrials (ABB, Sika), and specialty finance. These companies operate globally, generate steady cash flows, and maintain conservative balance sheets. The Swiss corporate culture favors reinvestment discipline over flashy growth. FCF conversion is practically a national trait.
Down capture of 31.09% is exceptional. When the SMI falls, the portfolio absorbs less than a third of those losses. Combined with the 80% win rate, this is a strategy that wins most years and protects well in the losing ones.
The 16.3 average stock count shows the SIX universe is selective. The quality filters eliminate a lot of names. Two cash periods (years where fewer than 10 stocks qualified) confirm the smaller pool. But when the strategy is invested, it works well.
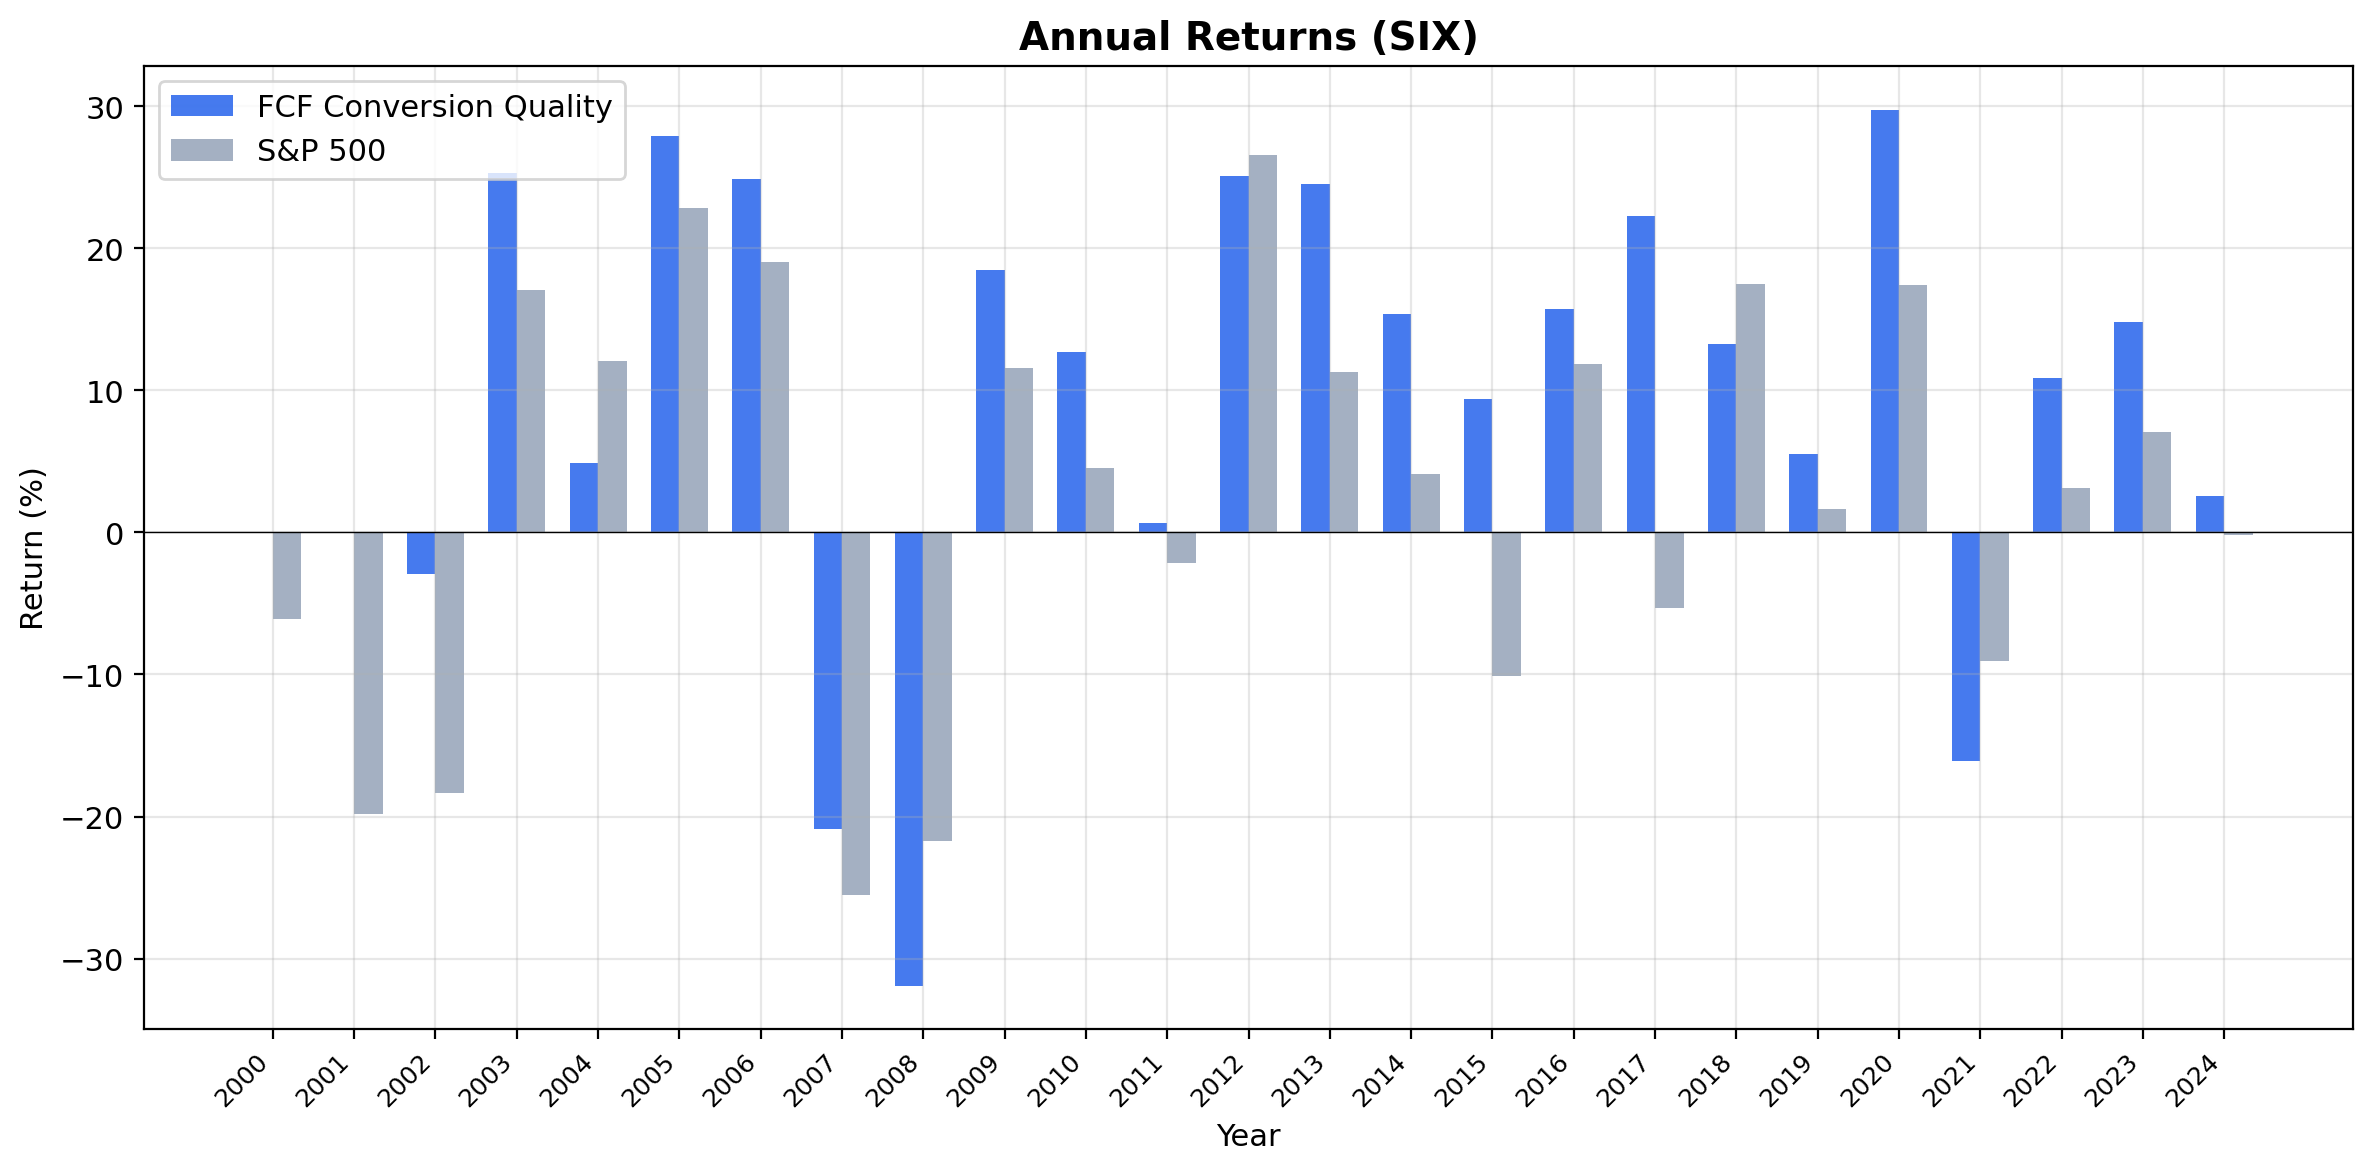
Annual Returns
| Year | Strategy | SMI | Excess |
|---|---|---|---|
| 2002 | -2.9% | -18.3% | +15.4% |
| 2007 | -20.9% | -25.6% | +4.7% |
| 2015 | +17.2% | -2.1% | +19.3% |
2002 shows the cash quality filter at work. While the SMI dropped 18.3% during the post-dot-com hangover, the portfolio lost only 2.9%. Companies with strong FCF conversion held up when the broad market sold off.
2007 was a down year for both, but the strategy lost less: -20.9% vs the SMI's -25.6%. That's the 31.09% down capture in action.
2015 was the best relative year: +17.2% while the SMI fell 2.1%. The Swiss franc shock in January 2015 (when the SNB abandoned the EUR/CHF floor) hit the broad index, but quality exporters with global revenue diversification absorbed the impact better.
The 80% win rate means the strategy beat the SMI in 20 of 25 years. That's not just good. It's the highest of any exchange we tested. The losing years tend to be narrow misses during broad rallies where the SMI's heavy index weights (Nestle, Roche, Novartis) drove returns.
Limitations
Weak benchmark. The SMI returned just 1.74% CAGR. It's a price-only index, so the +6.35% excess is partly inflated by comparing against an index that excludes dividends. A total-return SMI comparison would narrow the gap.
Thin universe. 16.3 average stocks and 2 cash periods show the SIX universe is small for this strategy. Concentration risk is higher than in the US or German versions. A few bad picks move the portfolio materially.
Deep max drawdown. The -46.10% max drawdown looks inconsistent with the strong win rate. This likely reflects a concentrated period of stress (possibly 2008-2009) where even Swiss quality names dropped sharply before recovering.
Survivorship bias. FMP data includes delisted stocks where available, but early-year coverage may underrepresent companies that failed during the period.
Transaction costs are estimated. Swiss equity trading costs and liquidity profiles differ from US markets. The size-tiered model is reasonable but not a precise replication.
Sector concentration. Swiss FCF conversion skews toward pharma, food, and industrials. The portfolio won't look like the broader SPI index.
Run It Yourself
Live screen:
python3 fcf-conversion/screen.py --preset switzerland
Full backtest:
python3 fcf-conversion/backtest.py --preset switzerland --output results.json --verbose
All exchanges:
python3 fcf-conversion/backtest.py --global --output results/exchange_comparison.json
Code: github.com/ceta-research/backtests/tree/main/fcf-conversion
Part of a Series
This is the Switzerland edition of our FCF Conversion Quality analysis. We ran the same screen on 15 exchanges globally:
- US: +1.83% excess, 48% down capture, the benchmark result
- Germany: +3.89% excess, zero cash periods, industrial cash discipline
- Hong Kong: +4.36% excess, conglomerate structure dilutes the signal
- Global comparison: all 15 exchanges side by side
Data: Ceta Research (FMP financial data warehouse), 2000-2025. Execution: next-day close (market-on-close). Benchmark: SMI. Full methodology: github.com/ceta-research/backtests/blob/main/METHODOLOGY.md
Past performance does not guarantee future results. This is research content, not investment advice.


