
FCF Conversion Quality: 25 Years of Separating Real Earnings from Accounting Fiction on US Stocks
We built a quality screen based on free cash flow conversion and backtested it on US stocks from 2000-2025. 9.68% CAGR vs 7.85% for SPY. The real story is downside protection. 51% down capture.


We built a systematic quality screen based on free cash flow conversion and backtested it on all US exchanges (NYSE, NASDAQ, AMEX) from 2000 to 2025. The strategy returned 9.68% annually vs 7.85% for the S&P 500, using next-day execution to avoid look-ahead bias. More interesting than the headline return: during market crashes, the portfolio captured only 51% of the downside. Companies that convert earnings to real cash don't fall as hard when markets panic.
Contents
- Method
- What is FCF Conversion?
- The Signal
- The Screen (SQL)
- What We Found
- $10,000 grew to $101,000. The S&P 500 reached $66,000.
- Annual Returns
- The Academic Case
- When It Works
- When It Struggles
- Limitations
- Run It Yourself
- Part of a Series
Data: FMP financial data warehouse, 2000–2025. Updated March 2026.
Method
Data source: Ceta Research (FMP financial data warehouse) Universe: All US exchanges (NYSE, NASDAQ, AMEX), market cap > $1B USD Period: 2000-2025 (25 years, 25 annual periods) Execution: Next-day close (market-on-close) Rebalancing: Annual (July), top 30 by highest FCF conversion, equal weight Benchmark: S&P 500 Total Return (SPY) Cash rule: Hold cash if fewer than 10 stocks qualify Costs: Size-tiered transaction costs (0.1% for large-cap, 0.3% mid-cap, 0.5% small-cap)
Financial data uses a 45-day lag to prevent look-ahead bias. Trades execute at next-day close (market-on-close) to simulate realistic execution. July rebalancing ensures annual filings (typically filed by April-May) are available. Full methodology: Ceta Research Backtest Methodology.
What is FCF Conversion?
FCF Conversion = Free Cash Flow / Net Income
Net income is an accounting number. It includes non-cash charges like depreciation, amortization, stock-based compensation, and dozens of accrual adjustments. Some reflect economic reality. Others are management estimates that can be stretched, compressed, or timed to smooth earnings.
Free cash flow is what actually showed up in the bank account after the company paid for operations and capital expenditure. You can't fake cash. It either arrived or it didn't.
A conversion ratio of 100% means every dollar of reported earnings was backed by a dollar of cash. Above 100% means the company generated more cash than it reported, typically because depreciation exceeded capex or working capital moved favorably. Below 100% means some portion of reported earnings exists only on paper.
How this differs from FCF Yield: FCF Yield (FCF / Market Cap) is a valuation metric that answers "is this stock cheap?" FCF Conversion is a quality metric that answers "are this company's earnings backed by real cash?" They measure different things entirely.
The Signal
| Filter | Threshold | Why |
|---|---|---|
| FCF / Net Income | 100% - 300% | Cash backs reported earnings. Cap at 300% filters tiny-NI noise |
| FCF / Revenue | > 10% | Meaningful absolute cash flow, not just ratio math |
| Return on Equity | > 10% | Profitable business, not just high conversion on low base |
| Operating Margin | > 10% | Real pricing power, sustainable cash generation |
| Net Income | > 0 | Negative denominators make the ratio meaningless |
| Free Cash Flow | > 0 | Only companies generating cash |
| Market Cap | > $1B USD | Liquid stocks only |
Selection: Top 30 by highest FCF conversion, equal weight.
The 300% cap is critical. Without it, companies with tiny net income ($1M NI, $5M FCF = 500% conversion) dominate the rankings. That's noise, not signal. The quality filters (ROE, FCF margin, operating margin) ensure we're finding companies with genuine, sustainable cash generation, not accounting quirks.
The Screen (SQL)
WITH k AS (
  SELECT km.* FROM key_metrics_ttm km
  JOIN (SELECT symbol, MAX(fetchedAtEpoch) AS max_e FROM key_metrics_ttm GROUP BY symbol) lat
    ON km.symbol = lat.symbol AND km.fetchedAtEpoch = lat.max_e
),
r AS (
  SELECT fr.* FROM financial_ratios_ttm fr
  JOIN (SELECT symbol, MAX(fetchedAtEpoch) AS max_e FROM financial_ratios_ttm GROUP BY symbol) lat
    ON fr.symbol = lat.symbol AND fr.fetchedAtEpoch = lat.max_e
),
c AS (
  SELECT cf.* FROM cash_flow_statement_ttm cf
  JOIN (SELECT symbol, MAX(dateEpoch) AS max_e FROM cash_flow_statement_ttm GROUP BY symbol) lat
    ON cf.symbol = lat.symbol AND cf.dateEpoch = lat.max_e
),
i AS (
  SELECT ist.* FROM income_statement_ttm ist
  JOIN (SELECT symbol, MAX(dateEpoch) AS max_e FROM income_statement_ttm GROUP BY symbol) lat
    ON ist.symbol = lat.symbol AND ist.dateEpoch = lat.max_e
)
SELECT
  c.symbol,
  p.companyName,
  ROUND(c.freeCashFlow / NULLIF(i.netIncome, 0) * 100, 1) AS fcf_conversion_pct,
  ROUND(c.freeCashFlow / NULLIF(i.revenue, 0) * 100, 1) AS fcf_margin_pct,
  ROUND(k.returnOnEquityTTM * 100, 1) AS roe_pct,
  ROUND(r.operatingProfitMarginTTM * 100, 1) AS op_margin_pct,
  ROUND(k.marketCap / 1e9, 1) AS mktcap_bn
FROM c
JOIN i ON c.symbol = i.symbol
JOIN k ON c.symbol = k.symbol
JOIN r ON c.symbol = r.symbol
JOIN profile p ON c.symbol = p.symbol
WHERE i.netIncome > 0
  AND c.freeCashFlow > 0
  AND c.freeCashFlow / NULLIF(i.netIncome, 0) > 1.0
  AND c.freeCashFlow / NULLIF(i.netIncome, 0) < 3.0
  AND c.freeCashFlow / NULLIF(i.revenue, 0) > 0.10
  AND k.returnOnEquityTTM > 0.10
  AND r.operatingProfitMarginTTM > 0.10
  AND k.marketCap > 1000000000
  AND p.exchange IN ('NYSE', 'NASDAQ', 'AMEX')
ORDER BY c.freeCashFlow / NULLIF(i.netIncome, 0) DESC
LIMIT 30
Run this query on Ceta Research
What We Found
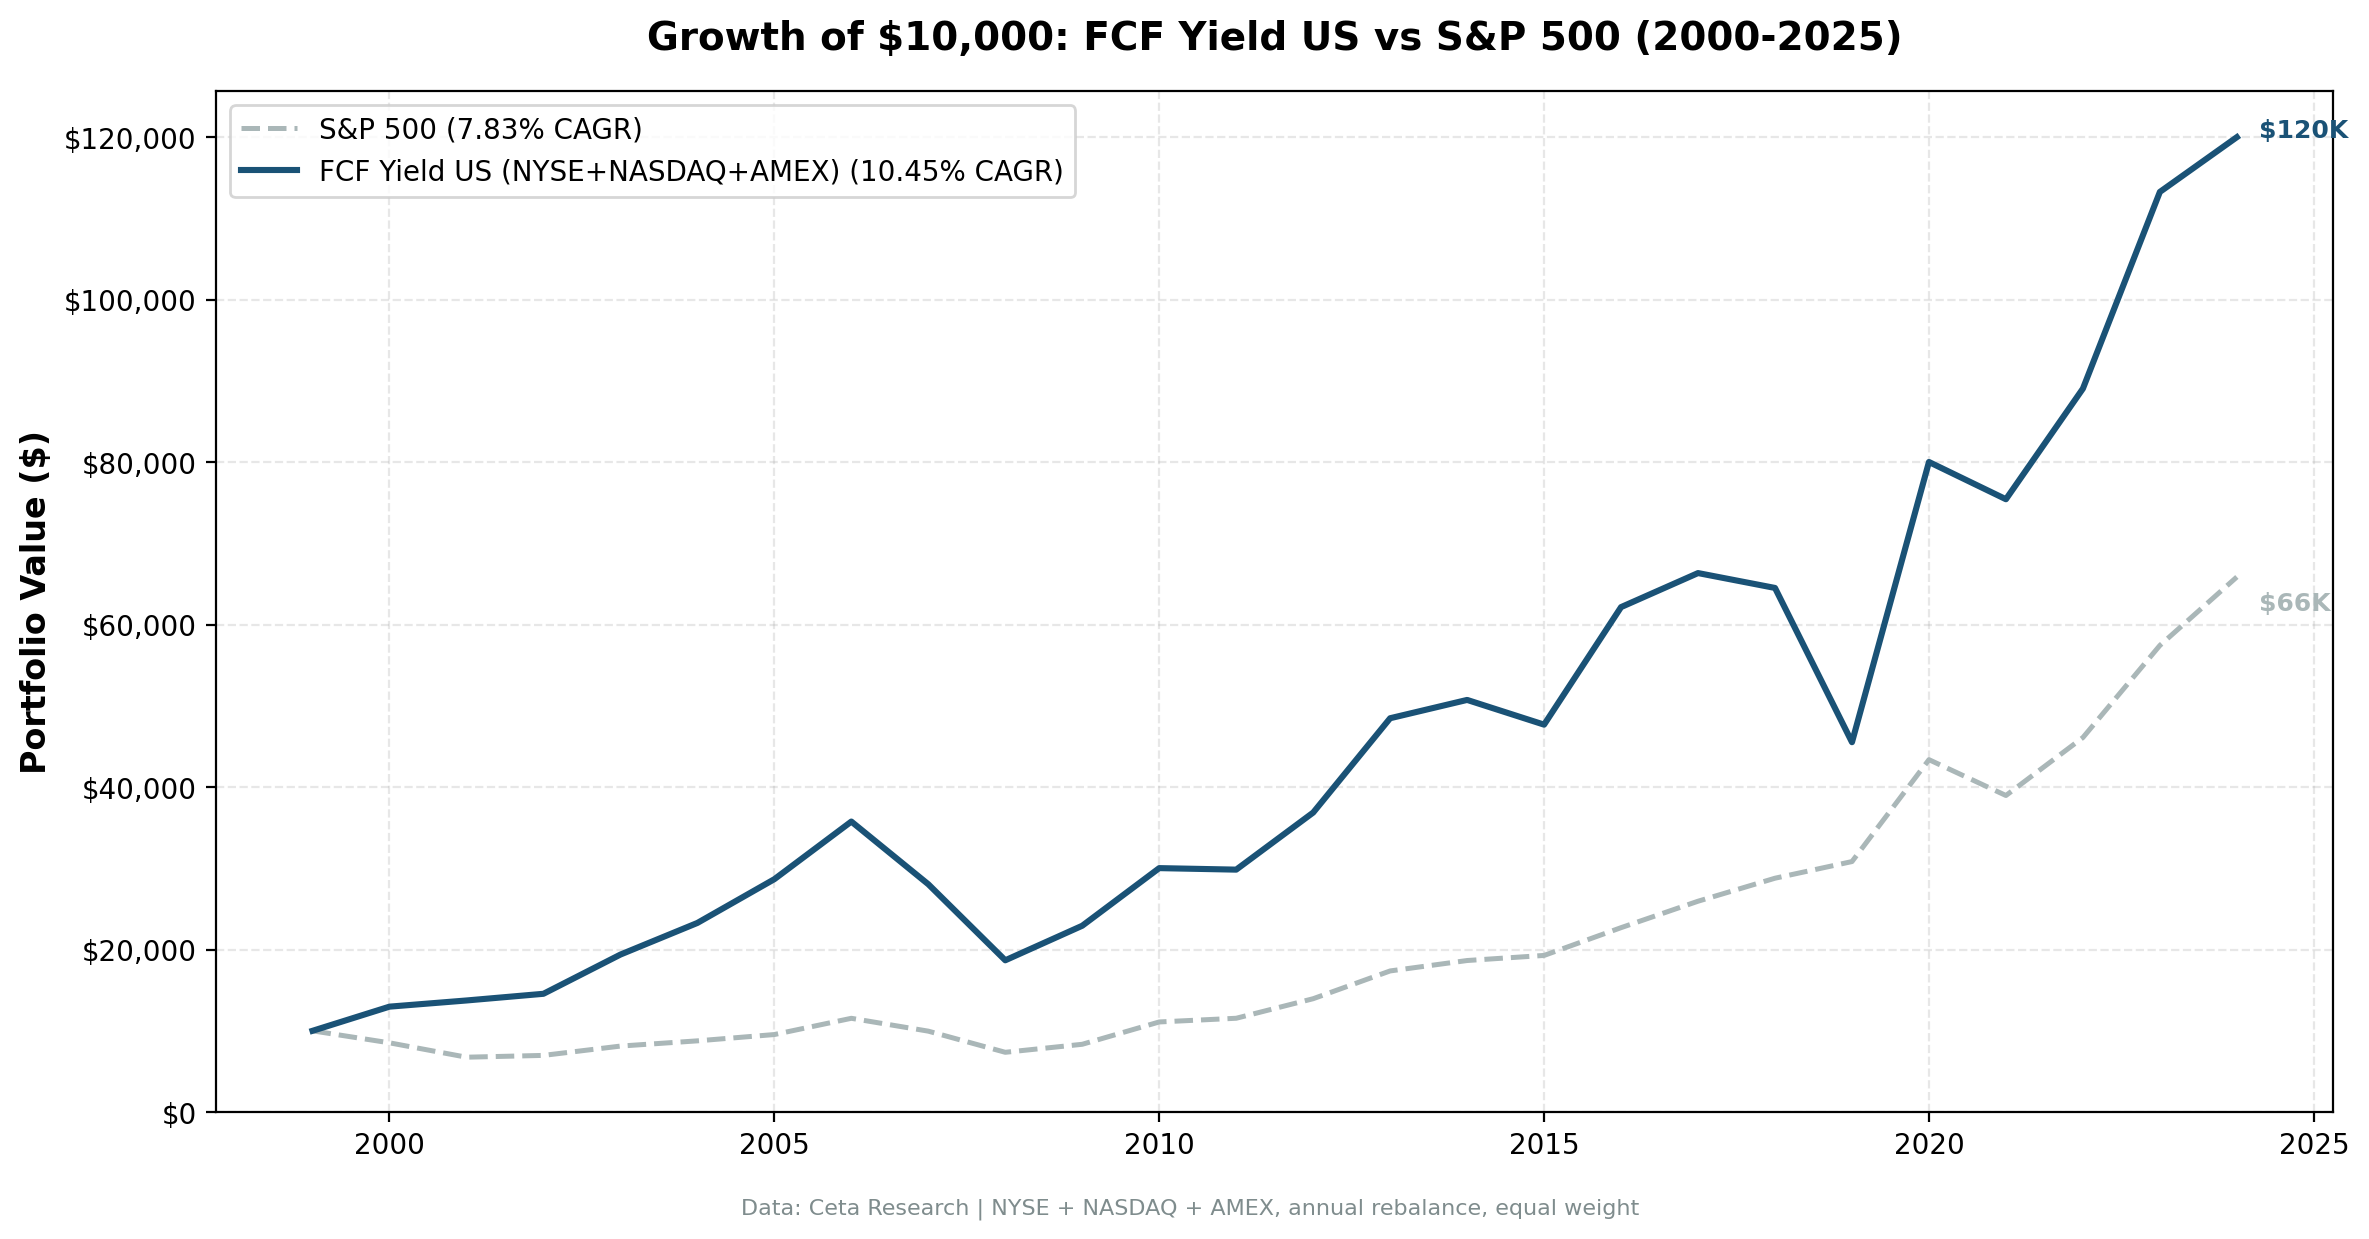
$10,000 grew to $101,000. The S&P 500 reached $66,000.
| Metric | FCF Conversion Quality | S&P 500 |
|---|---|---|
| CAGR | 9.68% | 7.85% |
| Total Return | 907% | 562% |
| Volatility | 19.9% | 16.6% |
| Max Drawdown | -40.9% | -38.0% |
| Sharpe Ratio | 0.39 | 0.35 |
| Sortino Ratio | 0.88 | 0.63 |
| Win Rate (annual) | 56% | - |
| Avg Stocks per Period | 24.3 | - |
| Cash Periods | 0 of 25 | - |
The headline CAGR of 1.83% excess is real but modest. The more interesting number is the down capture ratio: 51.4%. In years when the S&P 500 fell, the FCF Conversion portfolio captured roughly half of those losses.
This showed up most clearly during the dot-com bust. In 2000, the S&P 500 lost 14.8%. FCF Conversion gained 13.0%. In 2001, the S&P dropped another 22.4%. FCF Conversion was down just 2.8%. Over those two years, the portfolio barely moved while the market dropped over 30%.
Why? Because the companies that survived the dot-com crash were the ones generating real cash. The ones that collapsed were running on accruals, revenue recognition tricks, and market enthusiasm. FCF Conversion filtered them out before the crash happened.
Annual Returns
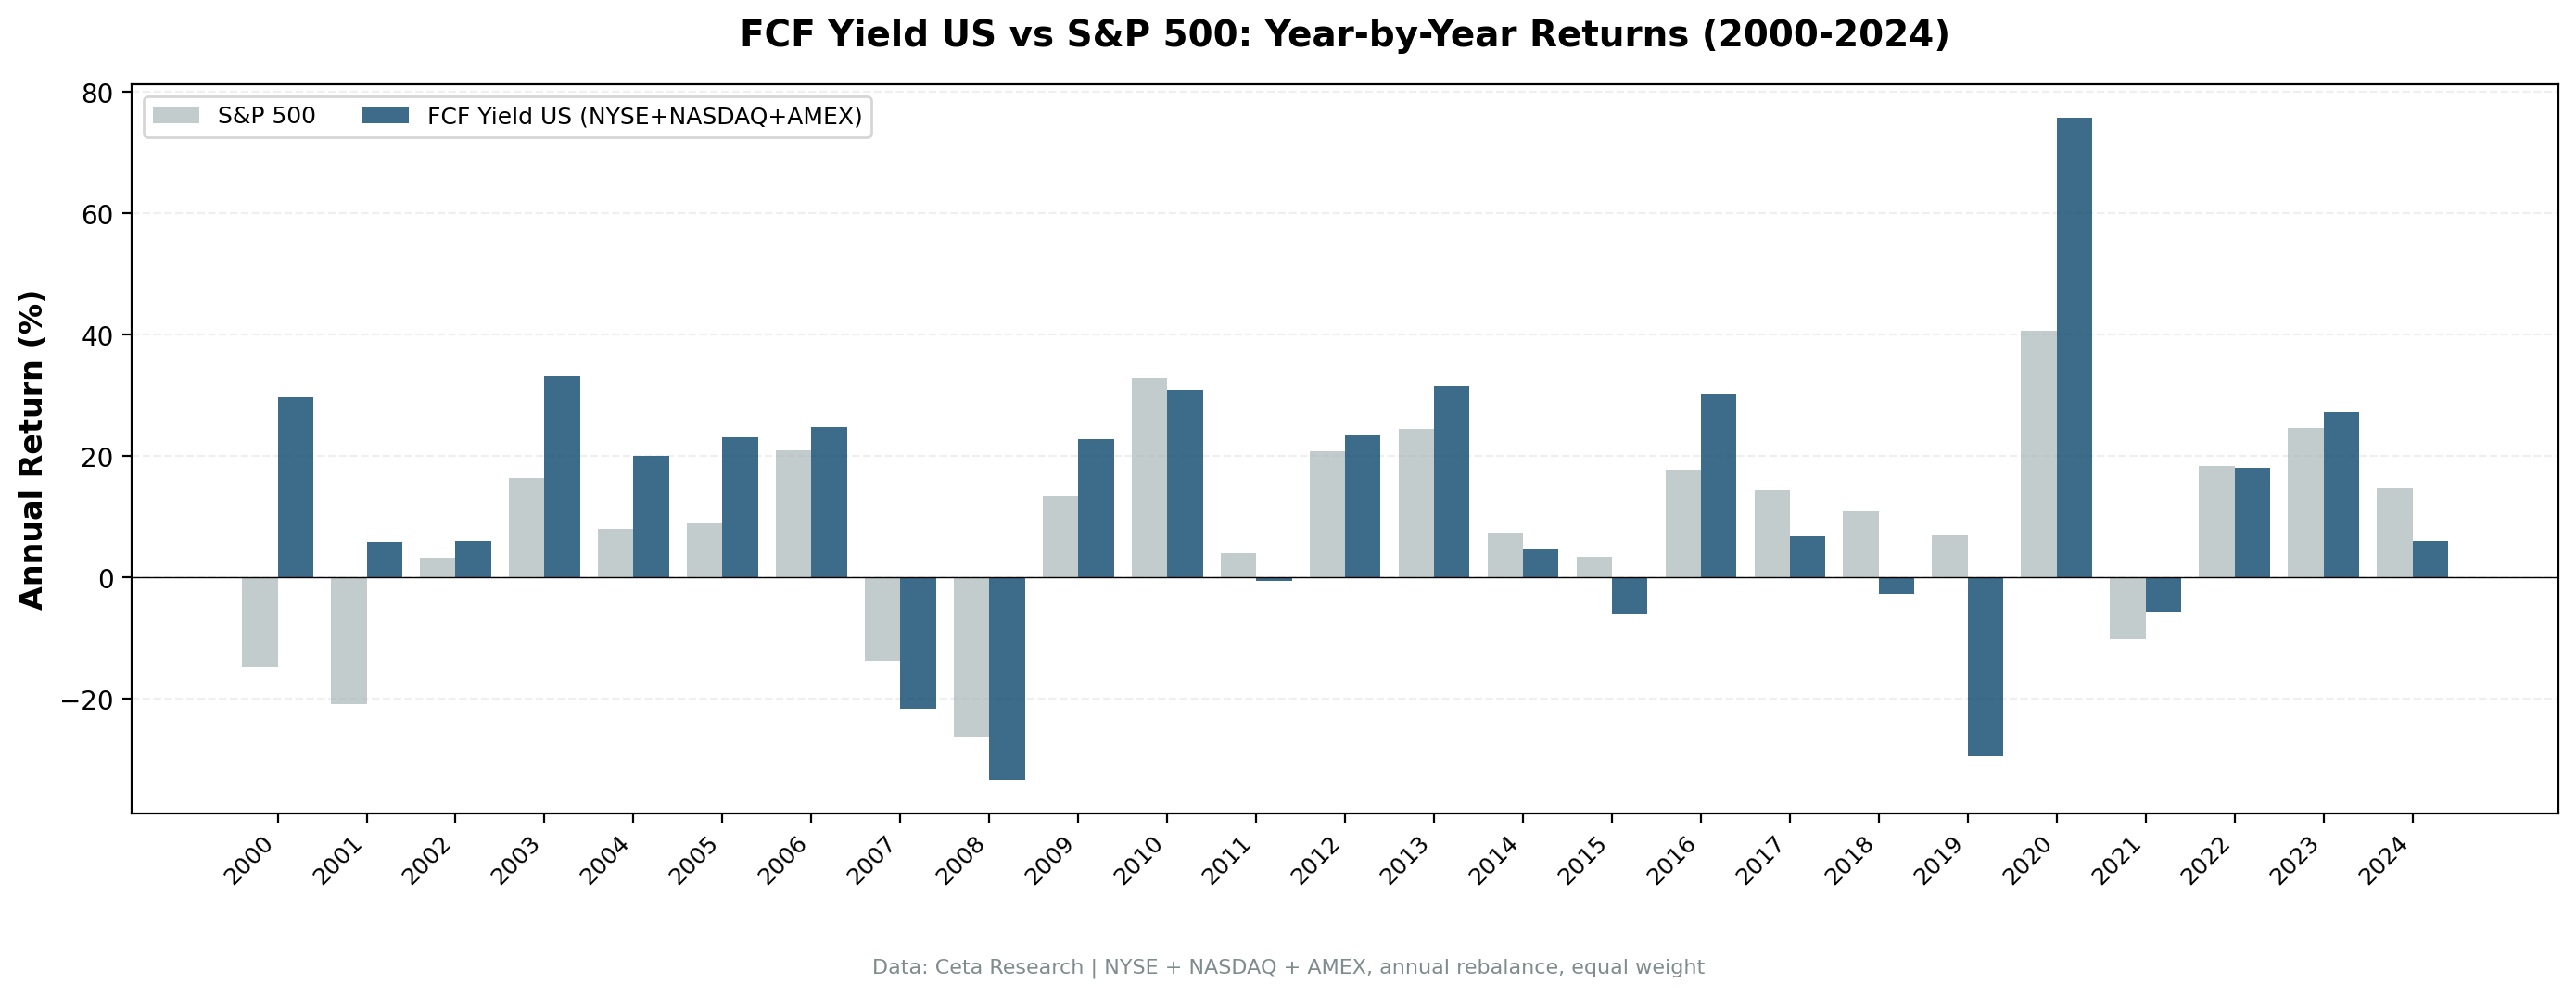
| Year | Strategy | S&P 500 | Excess |
|---|---|---|---|
| 2000 | +13.0% | -14.8% | +27.8% |
| 2001 | -2.8% | -22.4% | +19.6% |
| 2003 | +25.6% | +14.9% | +10.7% |
| 2008 | -27.2% | -26.9% | -0.3% |
| 2010 | +42.5% | +33.5% | +8.9% |
| 2013 | +31.7% | +24.7% | +6.9% |
| 2016 | +26.7% | +18.6% | +8.1% |
| 2020 | +59.5% | +41.0% | +18.5% |
| 2024 | +34.7% | +14.4% | +20.2% |
The pattern: FCF Conversion tends to outperform during and after market stress, then lag during extended growth runs. 2019 was the worst year (-13.4% vs SPY +7.4%), likely because momentum-driven growth stocks dominated and quality-focused cash generators were out of favor.
The Academic Case
The strategy is rooted in the accrual anomaly, one of the most studied patterns in finance.
Sloan (1996) found that companies with low accruals (earnings mostly backed by cash) outperformed companies with high accruals by roughly 10% per year. The market priced reported earnings at face value without distinguishing between cash-backed and accrual-heavy earnings.
Richardson et al. (2005) extended the work by showing that less reliable accruals (accounts receivable, inventory changes) predicted lower future earnings persistence. More reliable accruals showed higher persistence.
Dechow (1994) provided the theoretical foundation, showing that accruals improve earnings informativeness only when they reflect genuine economic activity. When accruals disconnect from cash flow, earnings become a less reliable signal.
Novy-Marx (2013) showed that profitability measures complement value signals. Combining cash quality with profitability (as our screen does with ROE and operating margin filters) should produce better results than screening on conversion alone.
When It Works
Post-bubble periods. After markets unwind excessive optimism, investors start caring about earnings quality. The 2000-2002 results show this clearly. When trust in financial statements drops, the premium for verifiable cash goes up.
Recovery rallies. Companies with real cash flow are better positioned to invest during downturns. The 2003, 2010, and 2020 snapback returns reflect this: cash-rich companies deploy capital when others are cutting.
Divergent accounting quality. Late in business cycles, some companies stretch accruals while others maintain conservative accounting. The conversion ratio discriminates between them.
When It Struggles
Extended growth runs. When momentum and growth dominate, quality screens underperform. 2017-2019 was a rough patch. High-growth tech stocks with low FCF conversion (reinvesting aggressively) led the market while cash generators lagged.
Low dispersion environments. When all earnings look the same, there's less signal to capture. The strategy needs a gap between cash-backed and accrual-heavy earnings to work.
Limitations
Survivorship bias. FMP data includes delisted stocks where available, but coverage isn't perfect for early years. Results before 2005 should be interpreted with more caution.
Transaction costs are estimated. Real-world slippage, bid-ask spreads, and market impact vary. Our size-tiered model is reasonable but approximate.
Stock-based compensation inflates conversion. SBC hits net income but not cash flow, mechanically boosting the ratio. Tech companies with heavy SBC may show artificially high conversion. This is a known limitation of the metric.
Single signal. The 300% cap and quality filters help, but FCF conversion alone doesn't capture valuation, momentum, or growth. It answers one question: are the earnings real?
Run It Yourself
Live screen:
python3 fcf-conversion/screen.py --preset us
Full backtest:
python3 fcf-conversion/backtest.py --preset us --output results.json --verbose
All exchanges:
python3 fcf-conversion/backtest.py --global --output results/exchange_comparison.json
Code: github.com/ceta-research/backtests/tree/main/fcf-conversion
Part of a Series
This is the US edition of our FCF Conversion Quality analysis. We ran the same screen on 15 exchanges globally, each measured against its local benchmark:
- India: +6.1% excess vs Sensex, 18.2% CAGR
- UK: +7.4% excess vs FTSE 100, consistent across 22 invested years
- Canada: +5.6% excess vs TSX Composite, highest Sharpe among outperformers
- Global comparison: all 15 exchanges side by side
Data: Ceta Research (FMP financial data warehouse), 2000-2025. Next-day close execution. Full methodology: github.com/ceta-research/backtests/blob/main/METHODOLOGY.md
Past performance does not guarantee future results. This is research content, not investment advice.


