
FCF Conversion Quality on Japanese Stocks: Corporate Governance Reforms Meet Cash Flow Signal
We ran our FCF Conversion screen on JPX-listed stocks from 2000-2025. 4.89% CAGR in JPY, beating the Nikkei 225 (3.31%) by 1.58% annually. 52% win rate, 51% down capture. $10K grew to ~$33K vs ~$23K for the Nikkei.

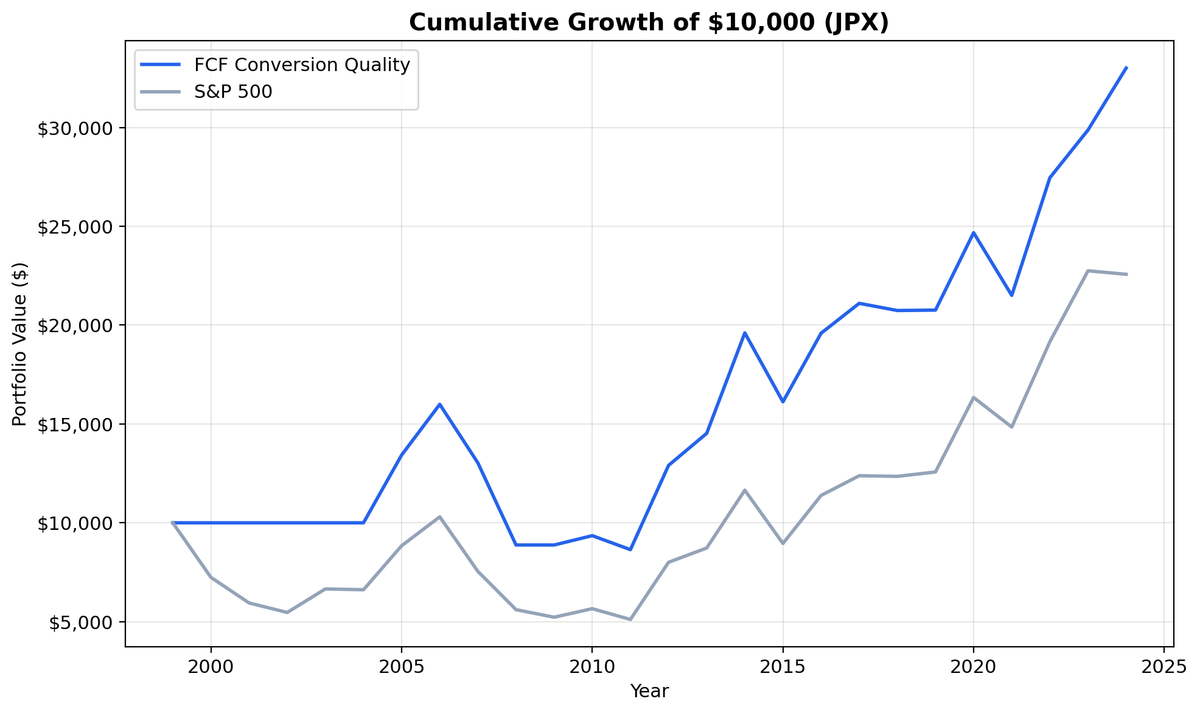
Japan's corporate governance revolution is the backdrop for this backtest. We ran our FCF Conversion Quality screen on JPX-listed stocks from 2000 to 2025 and found 4.89% CAGR in Yen, beating the Nikkei 225 (3.31% CAGR) by 1.58% annually. $10,000 grew to ~$33K while the Nikkei reached ~$23K. That's modest alpha, not a blowout. The more interesting story is how the signal interacted with Japan's structural reforms, and why 6 cash periods out of 25 is a real limitation.
Contents
- Method
- The Screen (SQL)
- What We Found
- $10,000 grew to ~$33K in JPY. The Nikkei 225 reached ~$23K.
- Annual Returns
- 2007: Downside protection in action
- 2012: Abenomics ignites
- 2024: Recent outperformance
- The Governance Story
- When It Works
- When It Struggles
- Currency Context
- Limitations
- Run It Yourself
- Part of a Series
Data: FMP financial data warehouse, 2000–2025. Updated March 2026.
Method
Data source: Ceta Research (FMP financial data warehouse) Universe: JPX, market cap > ¥100B (~$660M USD) Period: 2000-2025 (25 years, 25 annual periods) Rebalancing: Annual (July), top 30 by highest FCF conversion, equal weight Execution: Next-day close (market-on-close) Benchmark: Nikkei 225 (local index, JPY) Cash rule: Hold cash if fewer than 10 stocks qualify Costs: Size-tiered transaction costs (0.1% large-cap, 0.3% mid-cap, 0.5% small-cap)
Financial data uses a 45-day lag to prevent look-ahead bias. July rebalancing ensures annual filings are available. Trades execute at the next trading day's close to avoid same-day entry bias. Returns are in JPY. Full methodology: Ceta Research Backtest Methodology.
For a detailed explanation of FCF Conversion as a quality signal and the academic research behind it, see the US FCF Conversion Quality post.
The Screen (SQL)
SELECT
  c.symbol, p.companyName,
  ROUND(c.freeCashFlow / NULLIF(i.netIncome, 0) * 100, 1) AS fcf_conversion_pct,
  ROUND(c.freeCashFlow / NULLIF(i.revenue, 0) * 100, 1) AS fcf_margin_pct,
  ROUND(k.returnOnEquityTTM * 100, 1) AS roe_pct,
  ROUND(r.operatingProfitMarginTTM * 100, 1) AS op_margin_pct,
  ROUND(k.marketCap / 1e9, 1) AS mktcap_bn
FROM cash_flow_statement_ttm c
JOIN income_statement_ttm i ON c.symbol = i.symbol
JOIN key_metrics_ttm k ON c.symbol = k.symbol
JOIN financial_ratios_ttm r ON c.symbol = r.symbol
JOIN profile p ON c.symbol = p.symbol
WHERE i.netIncome > 0 AND c.freeCashFlow > 0
  AND c.freeCashFlow / NULLIF(i.netIncome, 0) > 1.0
  AND c.freeCashFlow / NULLIF(i.netIncome, 0) < 3.0
  AND c.freeCashFlow / NULLIF(i.revenue, 0) > 0.10
  AND k.returnOnEquityTTM > 0.10
  AND r.operatingProfitMarginTTM > 0.10
  AND k.marketCap > 100e9  -- ¥100B (~$660M USD)
  AND p.exchange IN ('JPX')
ORDER BY c.freeCashFlow / NULLIF(i.netIncome, 0) DESC
LIMIT 30
Run this query on Ceta Research
What We Found

$10,000 grew to ~$33K in JPY. The Nikkei 225 reached ~$23K.
| Metric | FCF Conversion (JPY) | Nikkei 225 |
|---|---|---|
| CAGR | 4.89% | 3.31% |
| Total Return | 230% | ~130% |
| Excess CAGR | +1.58% | - |
| Max Drawdown | -45.97% | - |
| Sharpe Ratio | 0.261 | - |
| Sortino Ratio | 0.547 | - |
| Down Capture | 51.05% | - |
| Win Rate (annual) | 52% | - |
| Avg Stocks per Period | 24.6 | - |
| Cash Periods | 6 of 25 | - |
Against the Nikkei 225, the numbers look different than they did against SPY. The +1.58% excess CAGR is modest but positive. The 52% win rate means the strategy beat the local index in slightly more than half the years. Down capture of 51.05% means the portfolio absorbed about half of the Nikkei's losses during down years.
The -45.97% max drawdown is deep. Japan spent the first decade of this backtest stuck in a post-bubble deflationary trap. Corporate cash hoarding was a feature of survival, not a signal of quality. Companies didn't convert earnings to cash because they had great businesses. They did it because they had nowhere to invest.
Six cash periods out of 25 is a real drag. That's nearly a quarter of the backtest spent on the sidelines. The signal started telling a different story after 2012.
Annual Returns
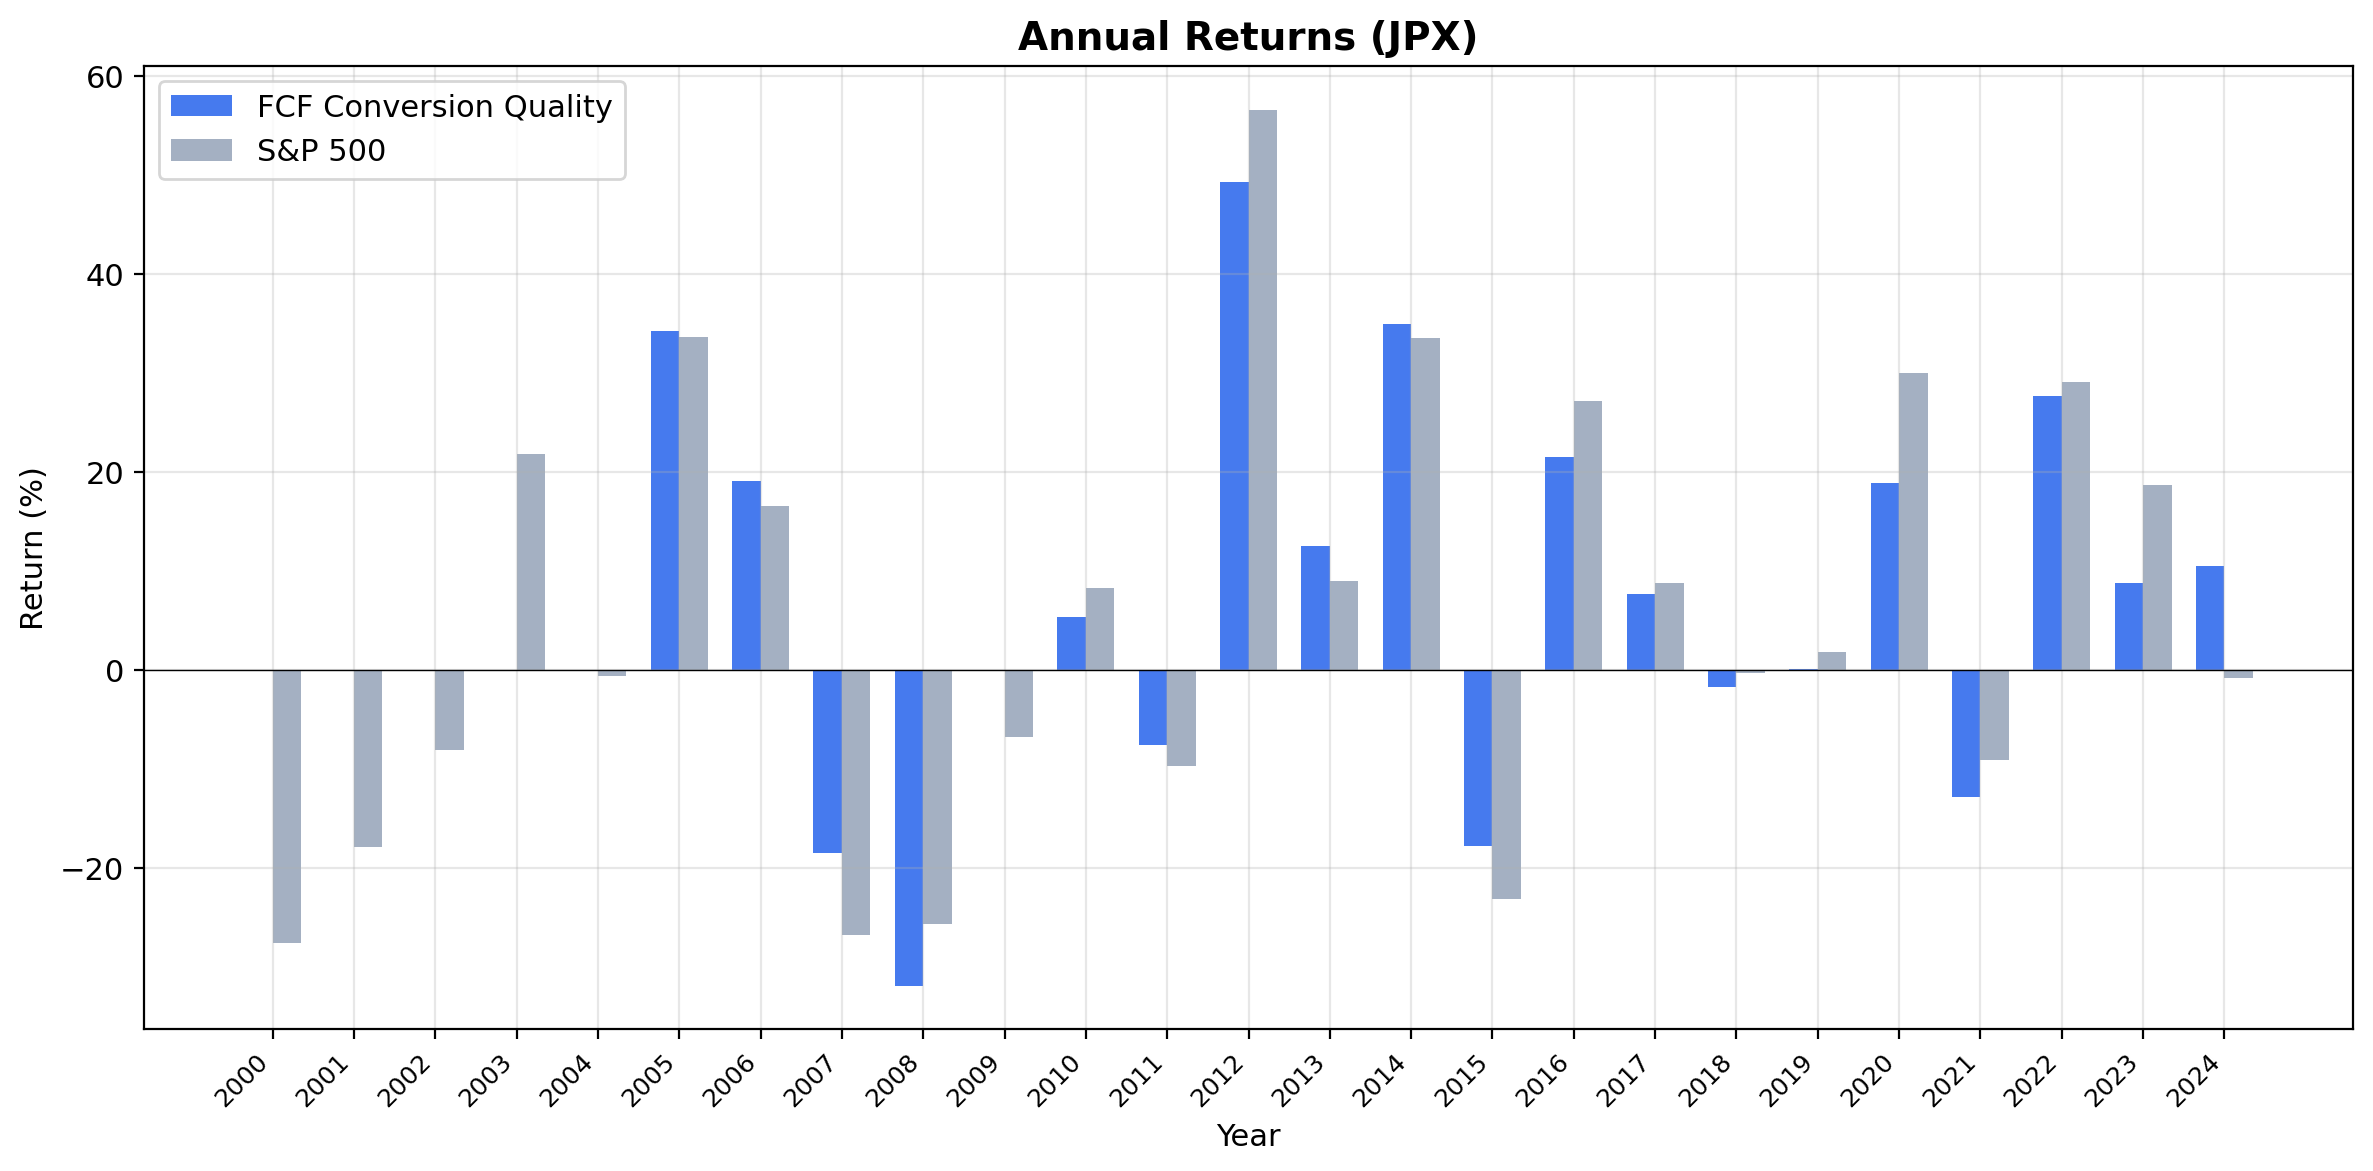
| Year | Strategy (JPY) | Nikkei 225 | Excess |
|---|---|---|---|
| 2007 | -18.5% | -26.8% | +8.3% |
| 2012 | +49.3% | +56.6% | -7.3% |
| 2024 | +10.5% | -0.8% | +11.3% |
2007: Downside protection in action
The portfolio fell 18.5% while the Nikkei dropped 26.8%. That +8.3% relative outperformance during a down year is exactly what down capture of 51.05% looks like in practice. Companies with real cash flows held up better when the subprime crisis started hitting global markets.
2012: Abenomics ignites
The portfolio gained 49.3%, trailing the Nikkei's 56.6%. December 2012 marked the beginning of Shinzo Abe's "three arrows" program: monetary easing, fiscal stimulus, and structural reform. The structural reform arrow directly targeted corporate governance, pushing companies to deploy their cash piles, improve ROE, and prioritize shareholder returns. The strategy participated in most of the rally but didn't quite keep up with the broad market surge.
2024: Recent outperformance
The strategy gained 10.5% while the Nikkei was roughly flat at -0.8%. That +11.3% excess in the most recent year suggests the signal remains relevant in Japan's evolving governance landscape.
The Governance Story
Japan is unique among developed markets. For decades, companies hoarded cash on their balance sheets, cross-held shares in friendly companies, and operated with minimal accountability to shareholders. ROE consistently trailed US and European peers.
The Tokyo Stock Exchange reforms that accelerated in 2023 (requiring companies below 1x price-to-book to disclose improvement plans) are the latest chapter. But the shift started earlier. Japan's Stewardship Code (2014) and Corporate Governance Code (2015) established expectations around capital efficiency.
For FCF Conversion Quality, this matters. The strategy's filters (ROE > 10%, operating margin > 10%) already screened out the cash-hoarding zombie companies. As the broader market began rewarding capital discipline, the companies passing our screen became more aligned with what Japanese investors started demanding.
The 24.6 average stocks per year shows the signal consistently found qualifying companies when it was invested. Japan has a deep equity market and plenty of businesses generating real cash. The 6 cash periods drag the compound return, but when invested, the strategy delivers modest alpha over the Nikkei.
When It Works
Post-reform periods. As Japan's governance reforms push companies toward higher ROE and better capital allocation, cash quality becomes a more meaningful discriminator. The post-2012 period showed this clearly.
Yen weakness cycles. Many Japanese companies passing the screen are exporters (autos, electronics, industrials). Yen depreciation boosts their earnings in local currency terms.
Sector rotation into quality. When global investors rotate from growth to quality, Japan's cash-rich industrials and consumer companies benefit.
When It Struggles
Deflationary traps. Japan's lost decades meant that cash hoarding was universal, not a quality signal. When every company sits on cash because investment returns are negative, FCF conversion doesn't separate winners from losers.
Risk-on rallies. In strong years like 2012 (+56.6% Nikkei), the strategy trails the index. Quality screening is conservative by nature, and broad market surges leave cash-rich companies behind.
Currency Context
Both the strategy and the Nikkei 225 benchmark are in Japanese Yen, so the comparison is clean. No currency mismatch to worry about.
Limitations
Cash drag. 6 of 25 periods were in cash. That's nearly a quarter of the backtest, dragging the compound return.
Deep drawdown. -45.97% max drawdown is severe. Japan's equity market experienced sharp declines during the GFC and earlier deflationary periods.
Governance evolution. The strategy's relevance improved as Japan's governance landscape changed. Early-period results may not reflect the forward-looking opportunity.
Survivorship bias. Delisted Japanese companies aren't fully captured in early years.
Run It Yourself
Live screen:
python3 fcf-conversion/screen.py --preset japan
Full backtest:
python3 fcf-conversion/backtest.py --preset japan --output results.json --verbose
Code: github.com/ceta-research/backtests/tree/main/fcf-conversion
Part of a Series
This is the Japan edition of our FCF Conversion Quality analysis. We ran the same screen on 15 exchanges globally:
- FCF Conversion on US Stocks (NYSE + NASDAQ + AMEX) - 9.68% CAGR, the baseline
- India: +6.13% excess vs Sensex, best absolute return at 18.18% CAGR
- Taiwan: lowest drawdown and volatility of any exchange
- Thailand: low beta, honest underperformance
- Global comparison: all 15 exchanges side by side
Data: Ceta Research (FMP financial data warehouse), 2000-2025. Execution: next-day close (market-on-close). Benchmark: Nikkei 225. Returns in JPY. Full methodology: github.com/ceta-research/backtests/blob/main/METHODOLOGY.md
Past performance does not guarantee future results. This is research content, not investment advice.


