
FCF Conversion Quality on German Stocks: +3.89% Alpha vs DAX Over 25 Years on XETRA
We screened XETRA for FCF conversion quality from 2000-2025. 8.93% CAGR vs 5.04% for the DAX with zero cash periods in 25 years. $10K grew to $85K vs $34K for the index. 60% win rate, 39% down capture.

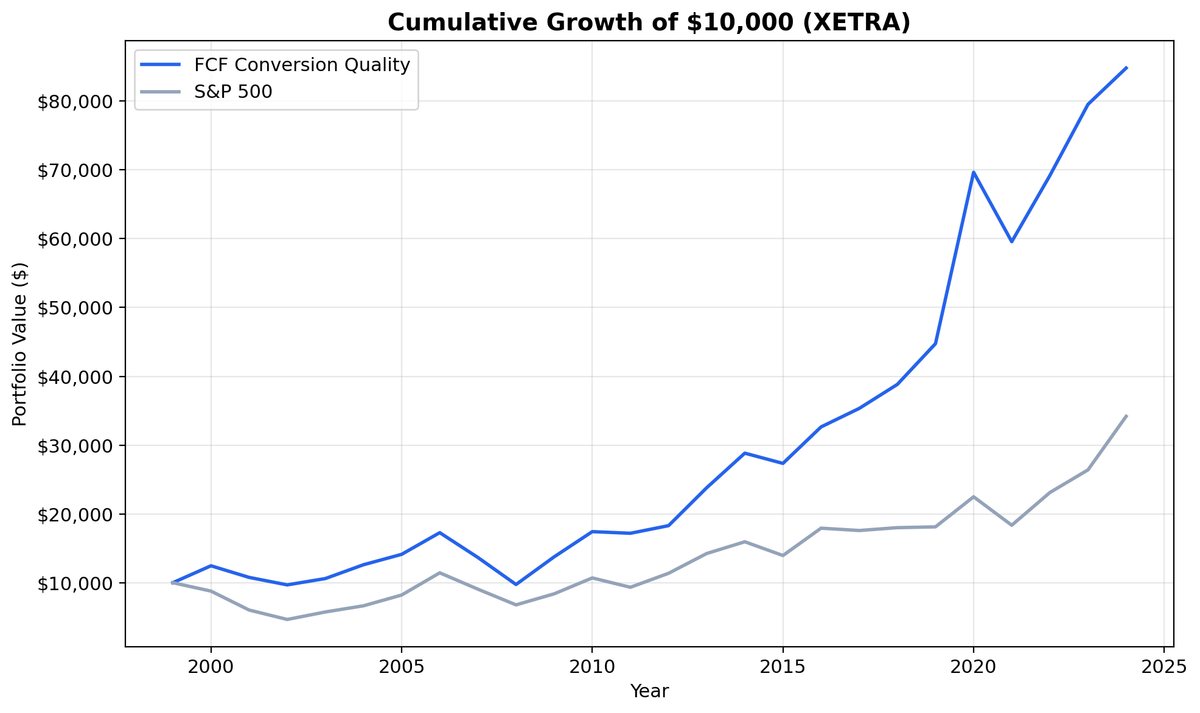
Germany's industrial economy is built on companies that make real things and collect real money. We applied the same FCF conversion quality screen to XETRA-listed stocks from 2000 to 2025 and found 8.93% CAGR vs 5.04% for the DAX. That's +3.89% annual excess. Zero cash periods across 25 years and nearly 20 qualifying stocks per period confirm the signal works in Germany's manufacturing-heavy market. $10,000 grew to ~$85,000 vs the DAX's ~$34,000.
Contents
- Method
- The Signal
- The Screen (SQL)
- What We Found
- $10,000 grew to ~$85,000. The DAX reached ~$34,000.
- Annual Returns
- Limitations
- Run It Yourself
- Part of a Series
Data: FMP financial data warehouse, 2000–2025. Updated March 2026.
Method
Data source: Ceta Research (FMP financial data warehouse) Universe: XETRA (Deutsche Borse), market cap > ~$545M USD equivalent Period: 2000-2025 (25 years, 25 annual periods) Rebalancing: Annual (July), top 30 by highest FCF conversion, equal weight Execution: Next-day close (market-on-close) Benchmark: DAX Total Return (EUR) Cash rule: Hold cash if fewer than 10 stocks qualify Costs: Size-tiered transaction costs (0.1% large-cap, 0.3% mid-cap, 0.5% small-cap) Currency: Returns in EUR. Benchmark in EUR. No currency mismatch.
Financial data uses a 45-day lag to prevent look-ahead bias. July rebalancing ensures annual filings are available. Trades execute at the next trading day's closing price to reflect realistic fill assumptions. Full methodology: Ceta Research Backtest Methodology.
This is the German edition of our US FCF Conversion Quality analysis.
The Signal
| Filter | Threshold | Why |
|---|---|---|
| FCF / Net Income | 100% - 300% | Cash backs reported earnings. Cap at 300% filters tiny-NI noise |
| FCF / Revenue | > 10% | Meaningful absolute cash flow, not just ratio math |
| Return on Equity | > 10% | Profitable business, not just high conversion on low base |
| Operating Margin | > 10% | Real pricing power, sustainable cash generation |
| Net Income | > 0 | Negative denominators make the ratio meaningless |
| Free Cash Flow | > 0 | Only companies generating cash |
| Market Cap | > ~$545M USD | Liquid stocks only |
Selection: Top 30 by highest FCF conversion, equal weight.
The Screen (SQL)
SELECT
  c.symbol,
  p.companyName,
  ROUND(c.freeCashFlow / NULLIF(i.netIncome, 0) * 100, 1) AS fcf_conversion_pct,
  ROUND(c.freeCashFlow / NULLIF(i.revenue, 0) * 100, 1) AS fcf_margin_pct,
  ROUND(k.returnOnEquityTTM * 100, 1) AS roe_pct,
  ROUND(r.operatingProfitMarginTTM * 100, 1) AS op_margin_pct,
  ROUND(k.marketCap / 1e9, 1) AS mktcap_bn
FROM cash_flow_statement_ttm c
JOIN income_statement_ttm i ON c.symbol = i.symbol
JOIN key_metrics_ttm k ON c.symbol = k.symbol
JOIN financial_ratios_ttm r ON c.symbol = r.symbol
JOIN profile p ON c.symbol = p.symbol
WHERE i.netIncome > 0
  AND c.freeCashFlow > 0
  AND c.freeCashFlow / NULLIF(i.netIncome, 0) > 1.0
  AND c.freeCashFlow / NULLIF(i.netIncome, 0) < 3.0
  AND c.freeCashFlow / NULLIF(i.revenue, 0) > 0.10
  AND k.returnOnEquityTTM > 0.10
  AND r.operatingProfitMarginTTM > 0.10
  AND k.marketCap > 500000000
  AND p.exchange IN ('XETRA')
ORDER BY c.freeCashFlow / NULLIF(i.netIncome, 0) DESC
LIMIT 30
Run this query on Ceta Research
What We Found

$10,000 grew to ~$85,000. The DAX reached ~$34,000.
| Metric | FCF Conversion Quality | DAX |
|---|---|---|
| CAGR | 8.93% | 5.04% |
| Total Return | 748% | ~240% |
| Excess CAGR | +3.89% | - |
| Max Drawdown | -43.62% | - |
| Sharpe Ratio | 0.36 | - |
| Sortino Ratio | 0.74 | - |
| Down Capture | 38.95% | - |
| Win Rate (annual) | 60% | - |
| Avg Stocks per Period | 19.8 | - |
| Cash Periods | 0 of 25 | - |
Zero cash periods in 25 years and an average of nearly 20 qualifying stocks per period show that Germany's industrial economy consistently produces companies that convert earnings to real cash. The Mittelstand, Germany's mid-cap industrial champions, tends to operate with conservative accounting and tangible assets. Depreciation closely tracks actual capex. Working capital cycles are predictable. These are exactly the traits that produce high FCF conversion ratios.
Down capture of 38.95% means the portfolio absorbed less than 40% of the DAX's losses in bad years. That's solid protection. The max drawdown of -43.62% is steep in absolute terms, reflecting the euro zone's exposure to global trade shocks. When world trade contracts, Germany's export-heavy companies feel it quickly. But relative to the DAX, the strategy weathered downturns well.
The 60% win rate means the strategy beat the DAX in three out of five years. Combined with the down capture, you get a return profile that participates in the upside and sheds most of the downside.
Annual Returns
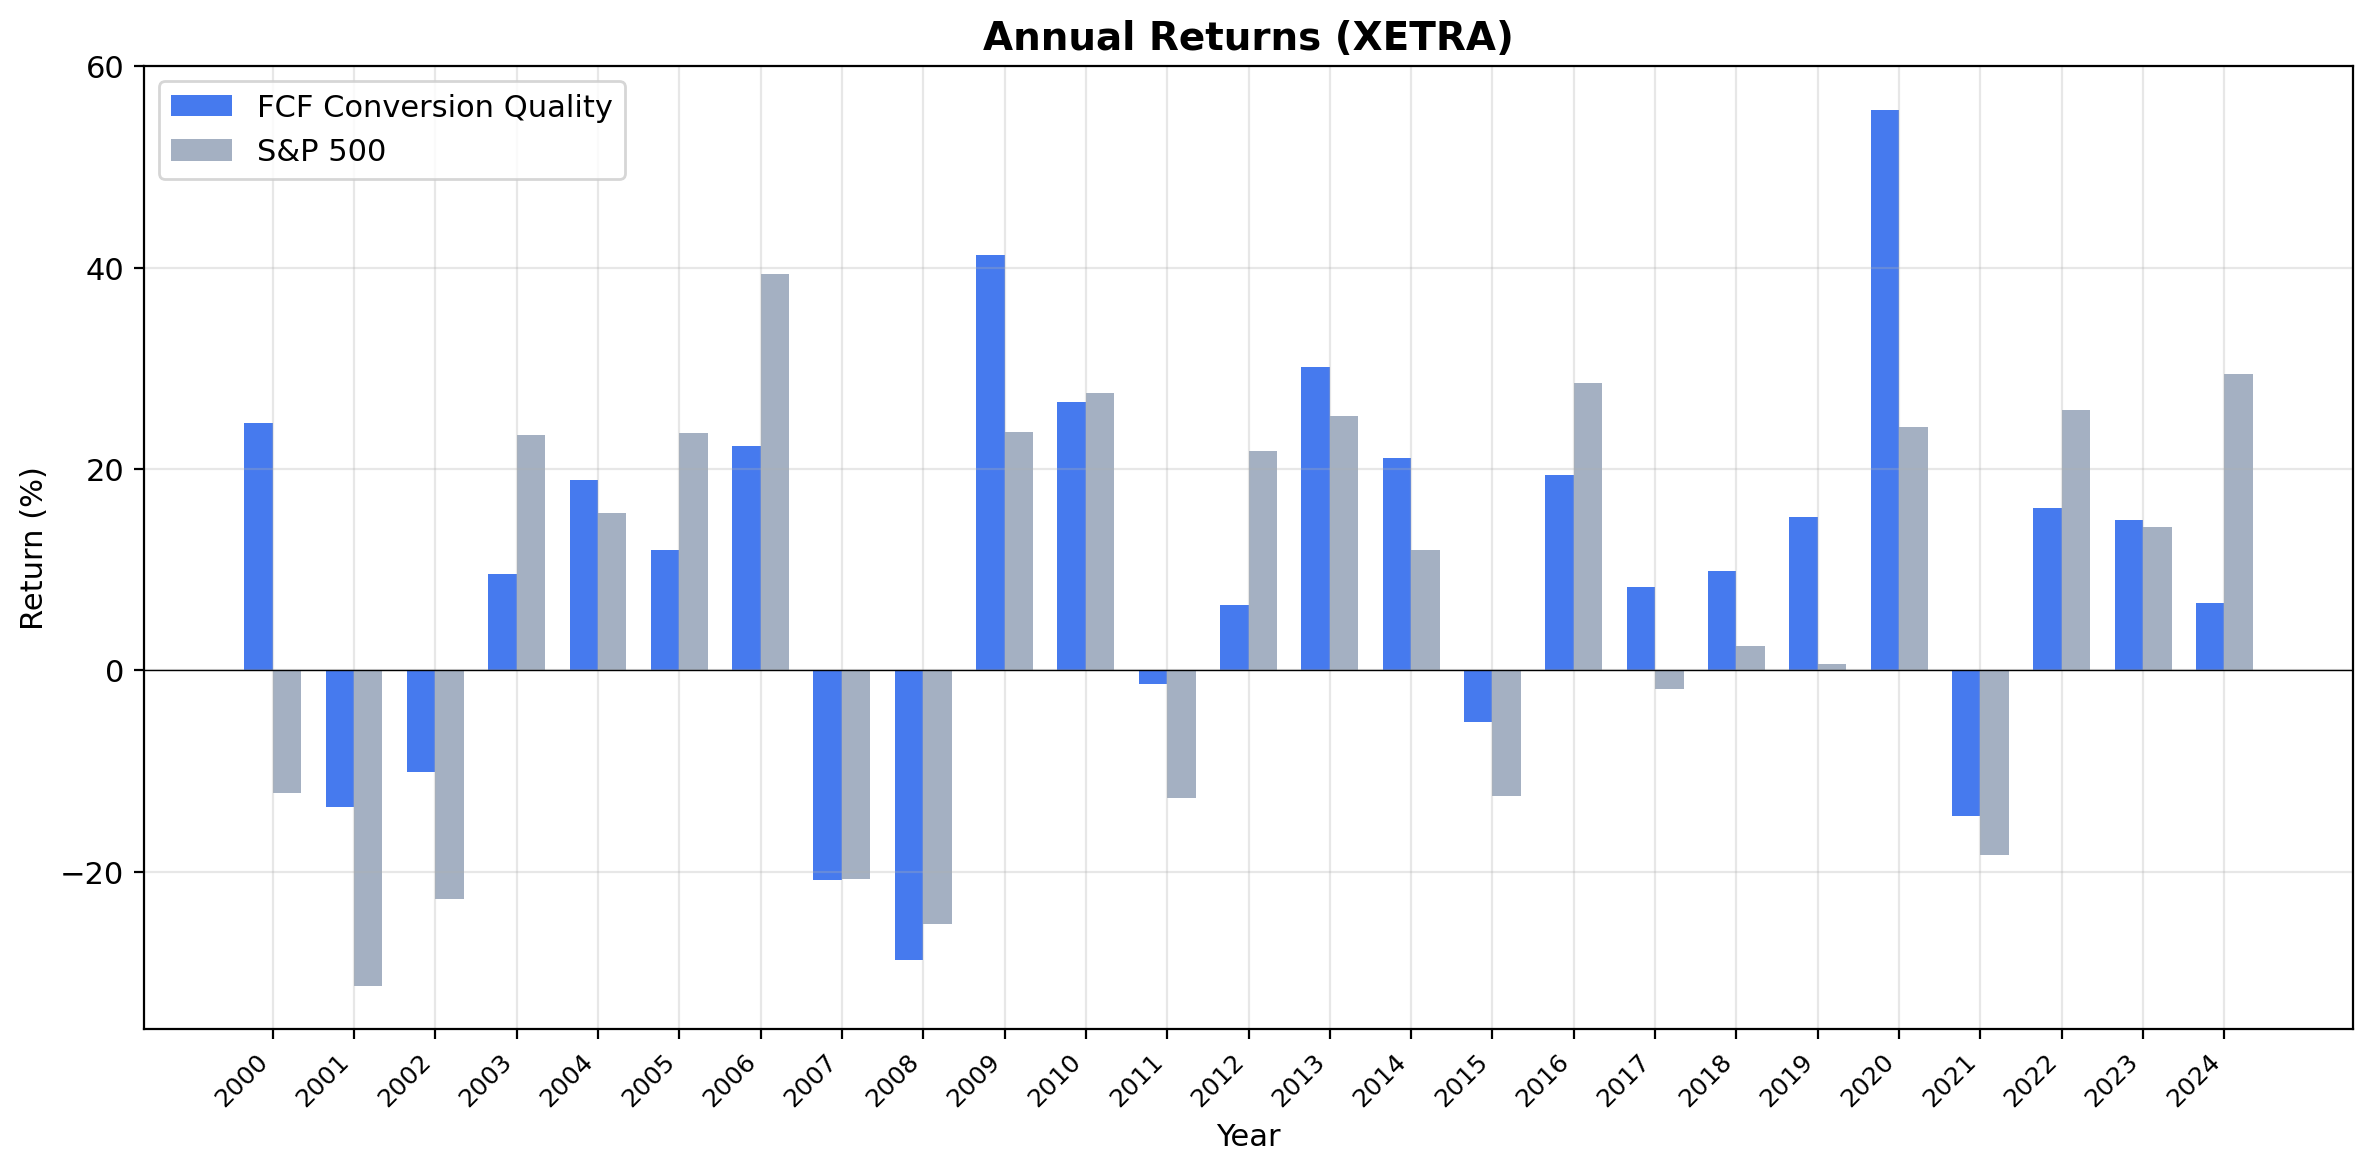
| Year | Strategy | DAX | Excess |
|---|---|---|---|
| 2000 | +24.6% | -12.2% | +36.8% |
| 2001 | -13.5% | -31.3% | +17.8% |
| 2020 | +55.7% | +24.1% | +31.6% |
The dot-com era was the strategy's strongest period. In 2000, German cash generators gained 24.6% while the DAX fell 12.2%. In 2001, the strategy lost 13.5%, but the DAX fell 31.3%, a 17.8% cushion. German industrials and exporters had minimal exposure to the tech bubble. They were selling machine tools and chemicals, collecting real cash, and trading at reasonable valuations.
2020 stands out: +55.7% vs the DAX's +24.1%. Cash-rich companies led the recovery as capital-light businesses with strong conversion powered through the disruption.
The 60% win rate means the strategy beat the DAX in 15 of 25 years. The wins tend to be larger than the losses, which is why cumulative performance compounds to a 2.5x advantage over the DAX ($85K vs $34K).
Limitations
Deep drawdowns. The -43.62% max drawdown is steep. Germany's trade-dependent economy amplifies global recessions. Investors need to stomach that volatility.
Thin universe. 19.8 average stocks is below the 30-stock target. XETRA qualifies fewer names under these filters than US exchanges. Concentration risk is real.
Sector concentration. FCF conversion in Germany skews heavily toward industrials, chemicals, auto suppliers, and specialty manufacturing. The portfolio won't resemble a diversified market benchmark.
Survivorship bias. FMP data includes delisted stocks where available, but early-year coverage may underrepresent companies that failed during the period.
Transaction costs are estimated. European bid-ask spreads and settlement costs vary. The size-tiered model is reasonable but approximate.
Run It Yourself
Live screen:
python3 fcf-conversion/screen.py --preset germany
Full backtest:
python3 fcf-conversion/backtest.py --preset germany --output results.json --verbose
All exchanges:
python3 fcf-conversion/backtest.py --global --output results/exchange_comparison.json
Code: github.com/ceta-research/backtests/tree/main/fcf-conversion
Part of a Series
This is the Germany edition of our FCF Conversion Quality analysis. We ran the same screen on 15 exchanges globally:
- US: +1.83% excess, 48% down capture, the benchmark result
- Switzerland: Highest Sharpe ratio (0.486) despite modest excess CAGR
- Hong Kong: +4.36% excess vs Hang Seng, conglomerate structure limits protection
- Global comparison: all 15 exchanges side by side
Data: Ceta Research (FMP financial data warehouse), 2000-2025. Benchmark: DAX Total Return. Execution: next-day close (MOC). Full methodology: github.com/ceta-research/backtests/blob/main/METHODOLOGY.md
Past performance does not guarantee future results. This is research content, not investment advice.


