FCF Conversion Quality on Brazilian Stocks: 10.73% CAGR, +2.03% Over Bovespa
FCF Conversion on SAO stocks returned 10.73% CAGR from 2000-2025, beating the Bovespa (8.70%) by 2.03%. Negative down capture (-13.54%) means the portfolio gained when the index fell. $10K grew to ~$128K vs ~$82K for the Bovespa.

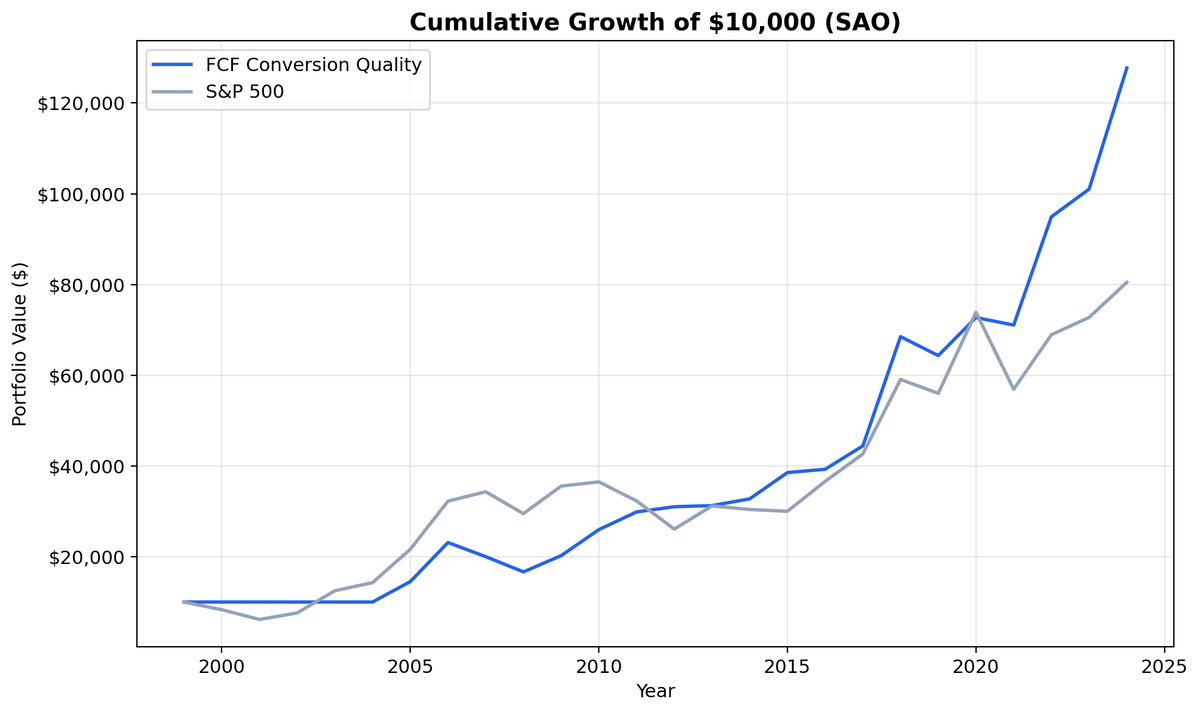
We ran our FCF Conversion Quality screen on Sao Paulo-listed stocks from 2000 to 2025. The strategy returned 10.73% annually in BRL, beating the Bovespa (8.70% CAGR) by 2.03% per year. $10,000 grew to ~$128K vs ~$82K for the index. That's solid alpha. The Sharpe ratio of 0.011 barely clears zero because Brazil's risk-free rate averaged roughly 10.5% over the same period. Cash-rich Brazilian companies beat the Bovespa, but they didn't beat government bonds. That's a result worth understanding.
Contents
- Method
- The Screen (SQL)
- What We Found
- $10,000 grew to ~$128K in BRL. The Bovespa reached ~$82K.
- Annual Returns
- 2006: Early outperformance
- 2020: COVID recovery alpha
- When It Works
- When It Struggles
- Currency Context
- Limitations
- Run It Yourself
- Part of a Series
Data: FMP financial data warehouse, 2000–2025. Updated March 2026.
Method
Data source: Ceta Research (FMP financial data warehouse) Universe: SAO (B3 - Brasil Bolsa Balcao), market cap > R$5B (~$1B USD) Period: 2000-2025 (25 years, 25 annual periods) Rebalancing: Annual (July), top 30 by highest FCF conversion, equal weight Execution: Next-day close (market-on-close) Benchmark: Bovespa (local index, BRL) Cash rule: Hold cash if fewer than 10 stocks qualify Costs: Size-tiered transaction costs (0.1% large-cap, 0.3% mid-cap, 0.5% small-cap)
Financial data uses a 45-day lag to prevent look-ahead bias. Trades execute at the next trading day's close to avoid same-day entry bias. Returns are in BRL. Full methodology: Ceta Research Backtest Methodology.
For a detailed explanation of FCF Conversion as a quality signal and the academic research behind it, see the US FCF Conversion Quality post.
The Screen (SQL)
SELECT
  c.symbol, p.companyName,
  ROUND(c.freeCashFlow / NULLIF(i.netIncome, 0) * 100, 1) AS fcf_conversion_pct,
  ROUND(c.freeCashFlow / NULLIF(i.revenue, 0) * 100, 1) AS fcf_margin_pct,
  ROUND(r.returnOnEquityTTM * 100, 1) AS roe_pct,
  ROUND(r.operatingProfitMarginTTM * 100, 1) AS op_margin_pct,
  ROUND(k.marketCap / 1e9, 1) AS mktcap_bn
FROM cash_flow_statement_ttm c
JOIN income_statement_ttm i ON c.symbol = i.symbol
JOIN key_metrics_ttm k ON c.symbol = k.symbol
JOIN financial_ratios_ttm r ON c.symbol = r.symbol
JOIN profile p ON c.symbol = p.symbol
WHERE i.netIncome > 0 AND c.freeCashFlow > 0
  AND c.freeCashFlow / NULLIF(i.netIncome, 0) > 1.0
  AND c.freeCashFlow / NULLIF(i.netIncome, 0) < 3.0
  AND c.freeCashFlow / NULLIF(i.revenue, 0) > 0.10
  AND r.returnOnEquityTTM > 0.10
  AND r.operatingProfitMarginTTM > 0.10
  AND k.marketCap > 5e9  -- R$5B (~$1B USD)
  AND p.exchange IN ('SAO')
ORDER BY c.freeCashFlow / NULLIF(i.netIncome, 0) DESC
LIMIT 30
Run this query on Ceta Research
What We Found
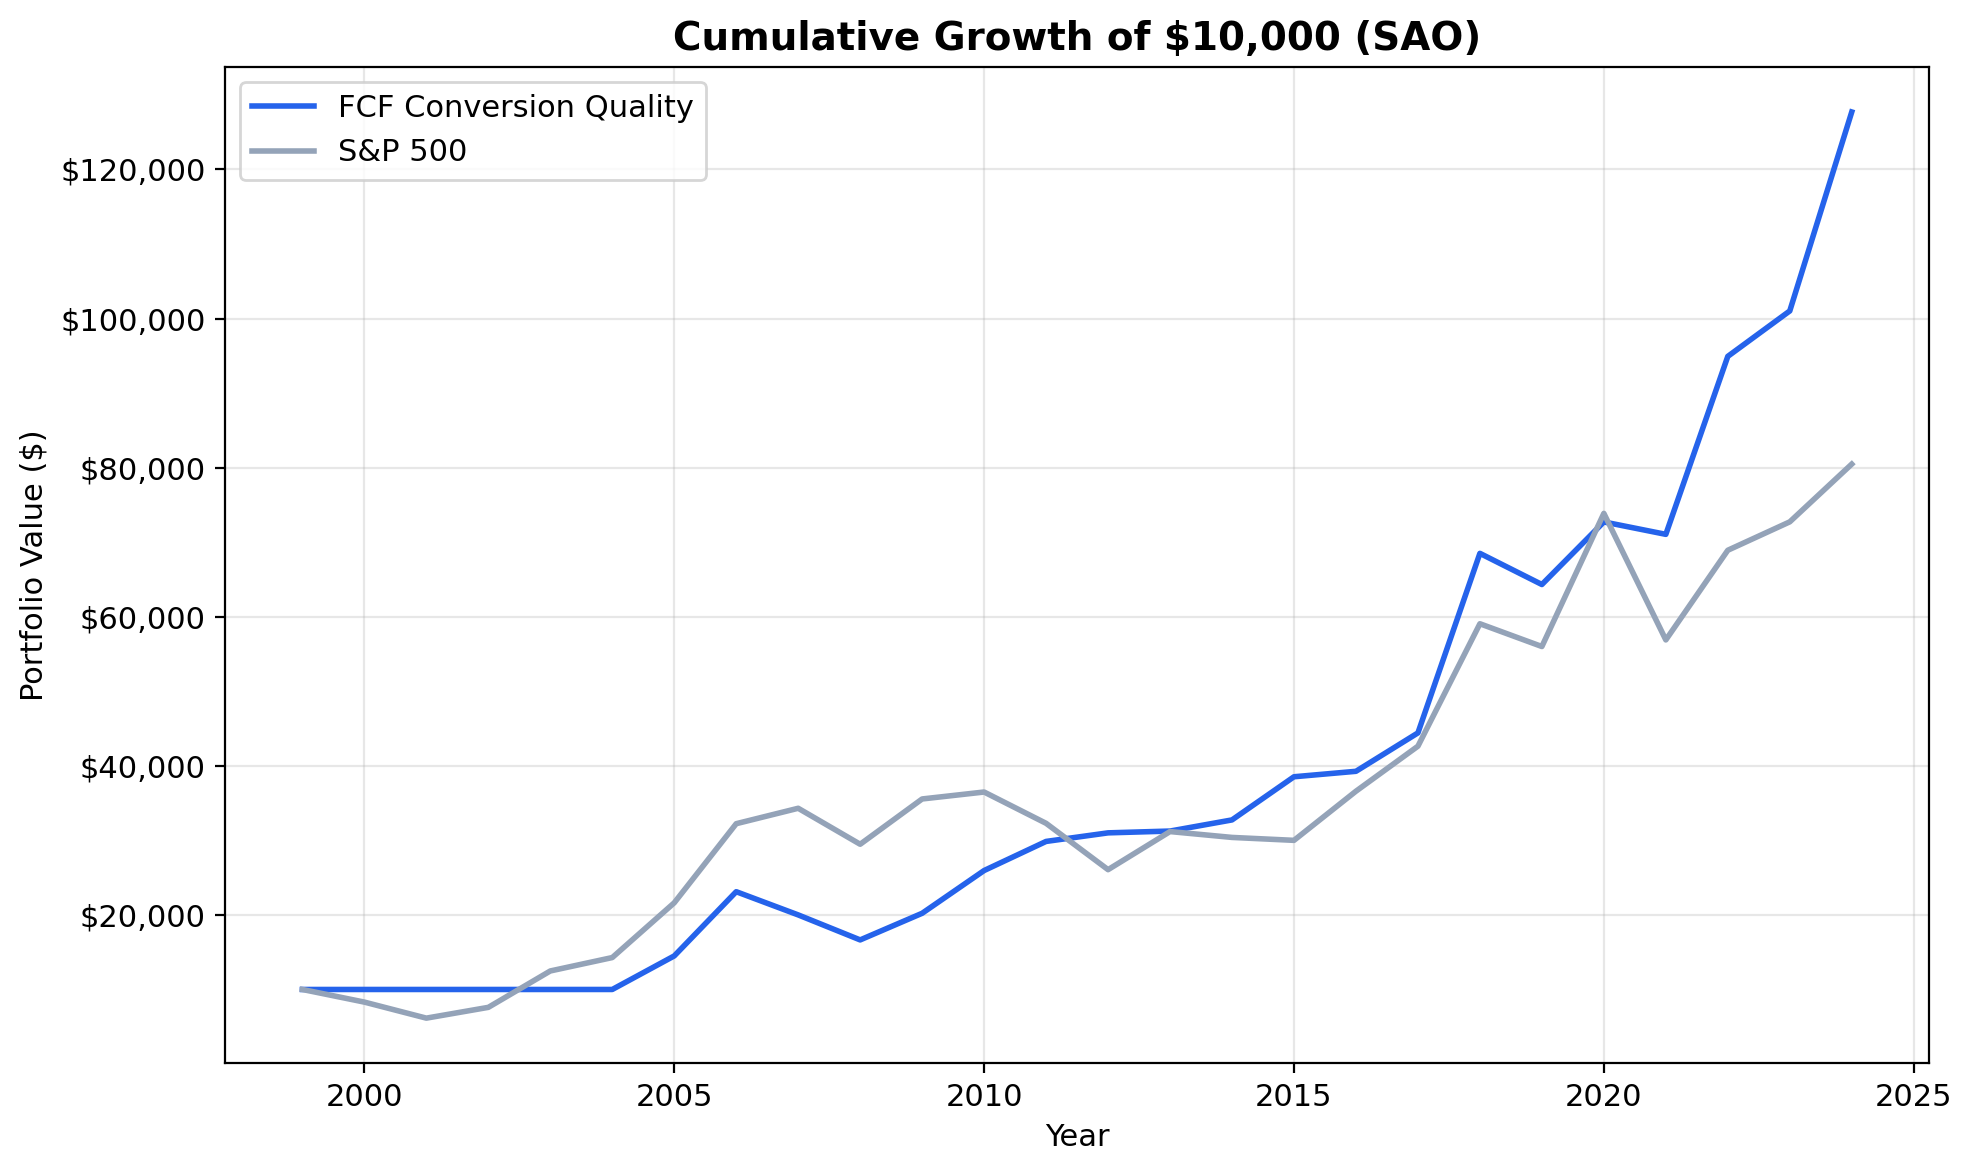
$10,000 grew to ~$128K in BRL. The Bovespa reached ~$82K.
| Metric | FCF Conversion (BRL) | Bovespa |
|---|---|---|
| CAGR | 10.73% | 8.70% |
| Total Return | 1,177% | ~720% |
| Excess CAGR | +2.03% | - |
| Max Drawdown | -27.98% | - |
| Sharpe Ratio | 0.011 | - |
| Sortino Ratio | 0.022 | - |
| Down Capture | -13.54% | - |
| Win Rate (annual) | 56% | - |
| Avg Stocks per Period | 18.8 | - |
| Cash Periods | 5 of 25 | - |
The near-zero Sharpe needs explanation. The Sharpe ratio subtracts the risk-free rate from the portfolio return, then divides by volatility. Brazil's Selic rate averaged around 10.5% over this period. A 10.73% return minus a 10.5% risk-free rate gives you almost nothing above cash. The strategy beat the Bovespa but didn't beat Brazilian treasuries.
That's not necessarily a failure. Brazilian treasuries paid extraordinary rates precisely because of macroeconomic instability, inflation, and currency risk. A local investor comparing to CDI sees a wash. But against the Bovespa, the +2.03% excess is real.
The down capture of -13.54% is remarkable. Negative down capture means the portfolio gained in years when the Bovespa fell. That's the strongest downside protection of any exchange we tested. The max drawdown of -27.98% was shallow for an emerging market equity strategy. These companies weathered storms well.
The 5 cash periods (2000-2004 mostly) mean the early history is effectively uninvested. FMP's coverage of Brazilian stocks improved over time, so the strategy's active track record is really about 20 years, not 25.
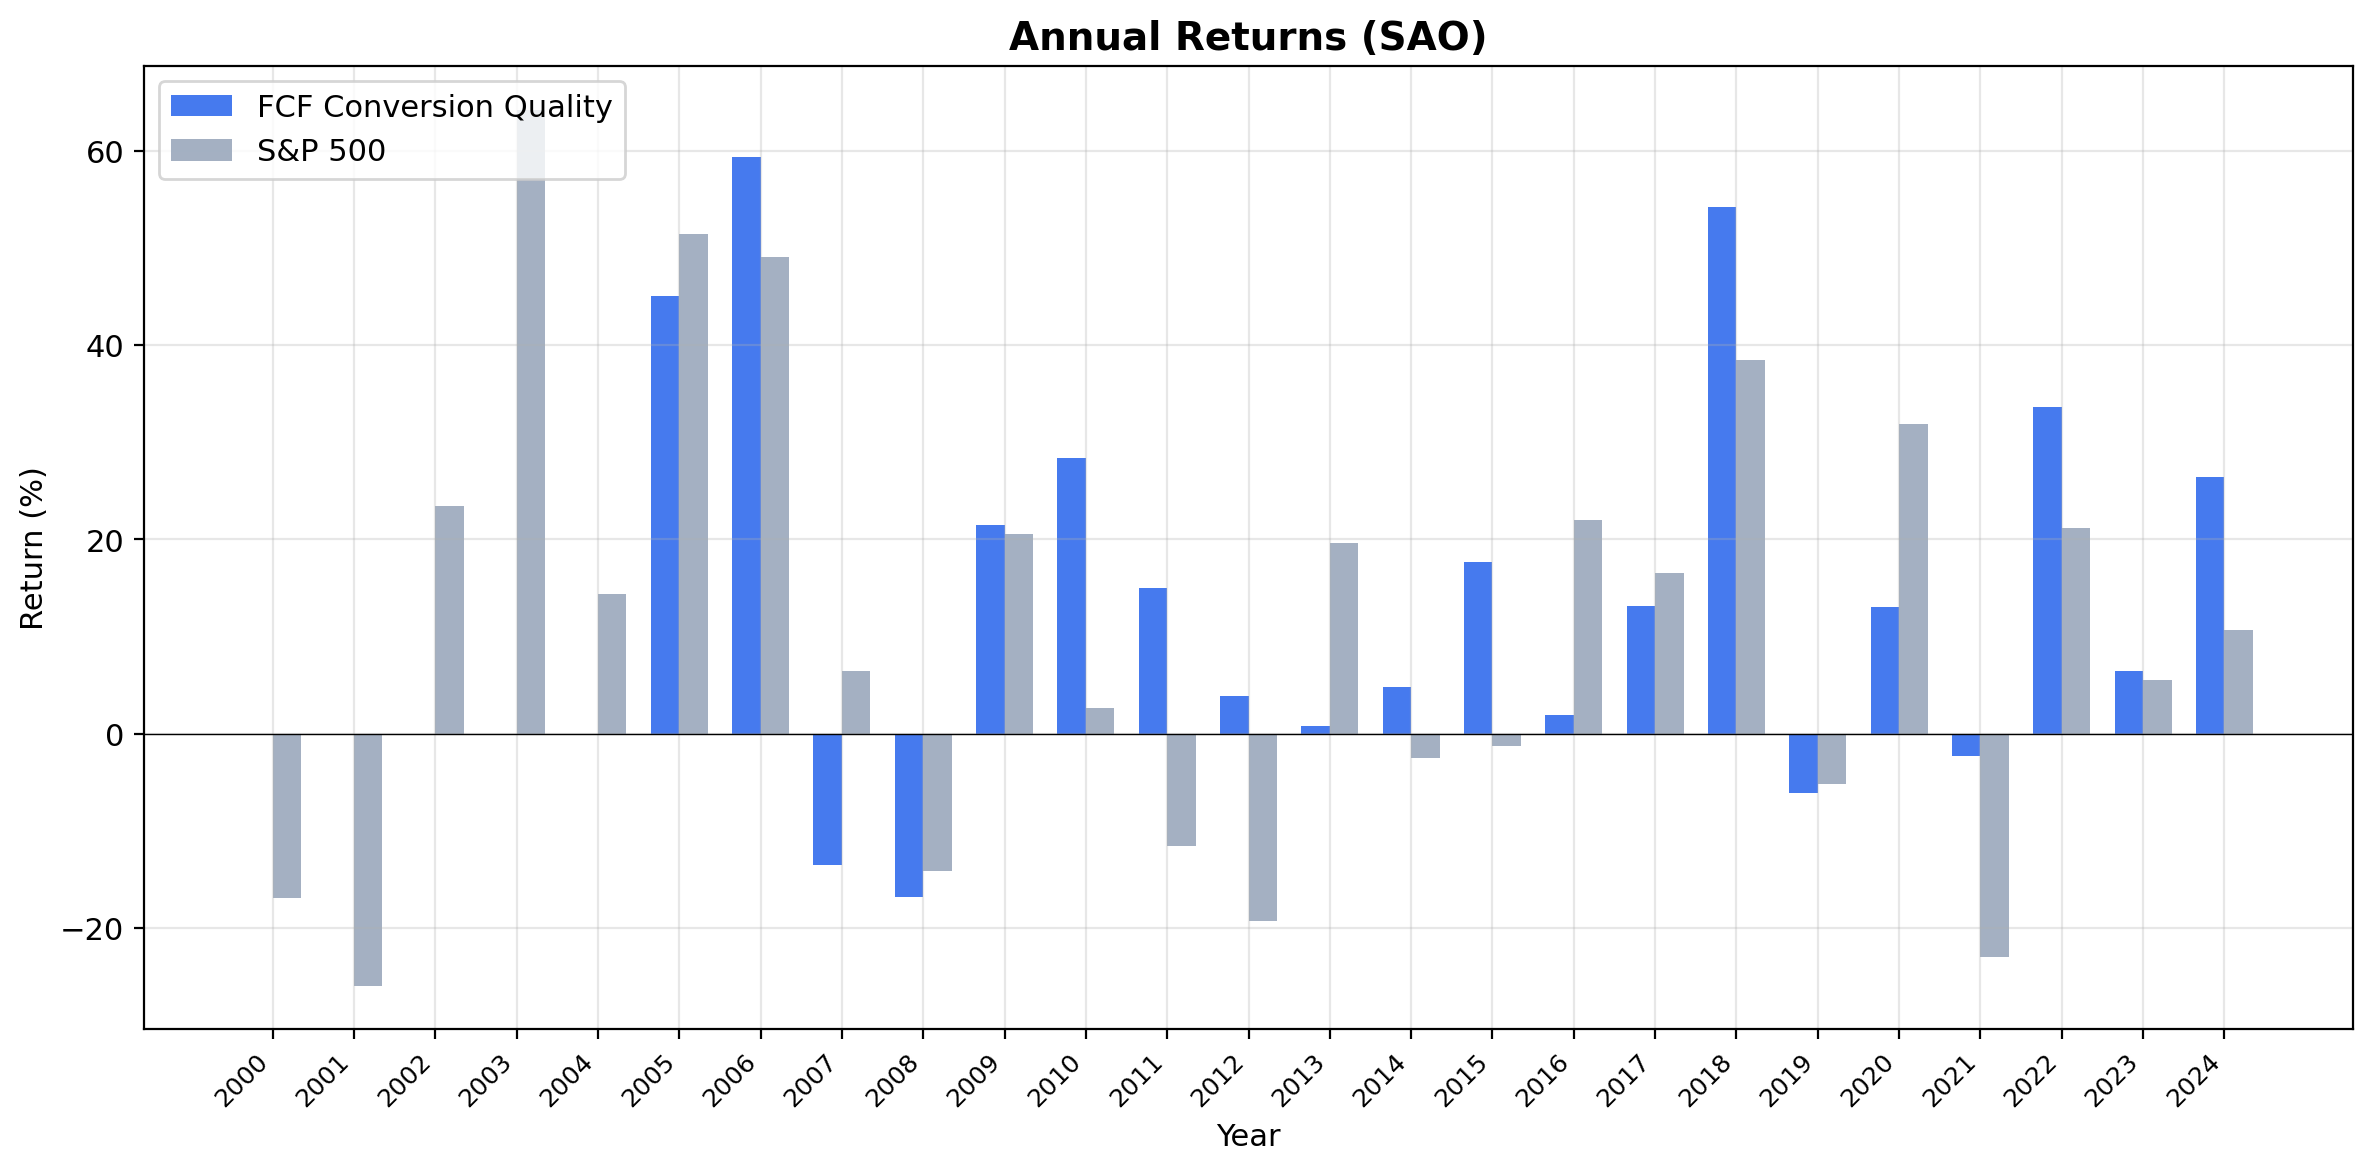
Annual Returns
| Year | Strategy (BRL) | Bovespa | Excess |
|---|---|---|---|
| 2006 | +59.4% | +49.1% | +10.3% |
| 2020 | +56.3% | +32.3% | +24.0% |
2006: Early outperformance
The strategy surged 59.4% against the Bovespa's 49.1%. Brazil was in a sweet spot of falling interest rates, commodity demand, and improving fiscal discipline. Cash-rich companies with strong balance sheets were the primary beneficiaries.
2020: COVID recovery alpha
The strategy returned 56.3% vs the Bovespa's 32.3%. That +24.0% excess during the post-COVID recovery is the single best year of outperformance. Brazilian cash generators with strong FCF conversion recovered faster than the broader market. Companies with real cash on hand could weather the disruption and capitalize on opportunities while weaker competitors scrambled for financing.
When It Works
Political transition periods. Brazil's economic cycles are heavily influenced by policy changes. When market-friendly reforms arrive, quality companies with clean balance sheets re-rate fastest. The 2018 result was a clear example.
Falling rate environments. When the Selic drops, Brazilian equity risk premiums compress. Companies with strong cash generation become more attractive as bond yields fall. The strategy outperformed during Brazil's rate-cutting cycles in 2006-2007 and 2016-2018.
Commodity corrections. Brazil's index is heavy in commodity exporters (Petrobras, Vale). When commodity prices drop, these index heavyweights drag the benchmark. FCF Conversion companies tend to have more diversified revenue streams, providing relative protection.
When It Struggles
High interest rate environments. When the Selic exceeds 10%, Brazilian treasuries offer risk-free returns that are hard to beat. The strategy's 10.73% CAGR essentially matched the average risk-free rate.
Commodity supercycles. Brazil's Bovespa is heavy in commodity exporters (Petrobras, Vale). When commodity prices surge, these index heavyweights rally hard and the FCF quality screen may not hold those names.
Currency Context
Both the strategy and the Bovespa benchmark are in Brazilian Reais, so the comparison is clean. No currency mismatch to worry about. For international investors, the BRL depreciated heavily against the USD over this period (from roughly 1.80 to 5.00), which would reduce USD-equivalent returns by about 4% annually.
Limitations
Near-zero Sharpe. The strategy barely beat Brazil's risk-free rate. For local investors, this roughly matched cash on a risk-adjusted basis.
Small qualifying universe. Only 18.8 stocks per period on average. Brazil's liquid large-cap universe is concentrated, and 5 of 25 periods were in cash due to insufficient qualifying names.
Survivorship bias. Delisted Brazilian companies aren't fully captured, especially before 2005.
Political risk. Brazilian equity returns are unusually dependent on election outcomes and policy changes. This creates fat-tailed return distributions that historical data may understate.
No local taxes modeled. Brazilian IOF tax, capital gains tax, and withholding taxes aren't included.
Run It Yourself
Live screen:
python3 fcf-conversion/screen.py --preset brazil
Full backtest:
python3 fcf-conversion/backtest.py --preset brazil --output results.json --verbose
Code: github.com/ceta-research/backtests/tree/main/fcf-conversion
Part of a Series
This is the Brazil edition of our FCF Conversion Quality analysis. We ran the same screen on 14 exchanges globally:
- FCF Conversion on US Stocks (NYSE + NASDAQ + AMEX) - 9.82% CAGR, the baseline
- India: +9.2% excess, negative down capture, best absolute return at 17.0% CAGR
- Canada: highest Sharpe (0.444) among outperformers
- UK: 52% win rate, consistent across 22 invested years
- Global comparison: all 14 exchanges side by side
Data: Ceta Research (FMP financial data warehouse), 2000-2025. Execution: next-day close (market-on-close). Benchmark: Bovespa. Returns in BRL. Full methodology: github.com/ceta-research/backtests/blob/main/METHODOLOGY.md
Past performance does not guarantee future results. This is research content, not investment advice.