
FCF Compounders: 25 Years of Buying Companies That Grow Cash Every Year on US Stocks
We screened for companies that grew FCF in 4+ of the last 5 years with ROIC above 15% and backtested on US stocks from 2000-2025. 12.15% CAGR vs 7.85% for SPY. 68% win rate, 51.2% down capture, invested 23 of 25 years.

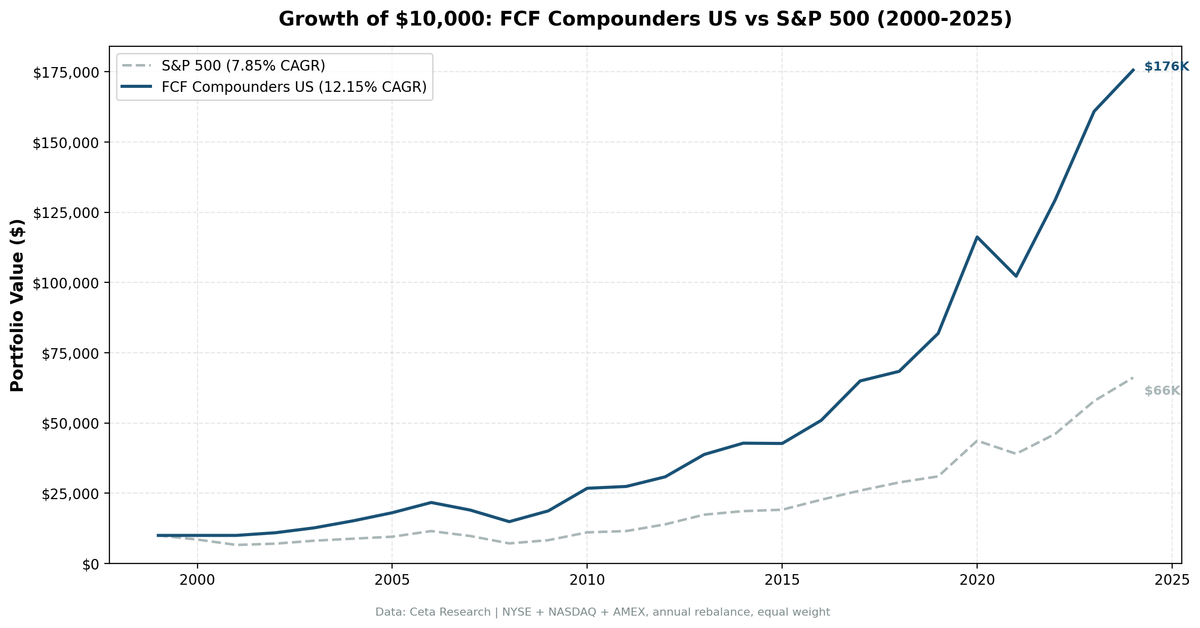
We built a systematic screen for companies that grow free cash flow consistently, combined it with quality filters (ROIC > 15%, operating margin > 15%), and backtested it on all US exchanges from 2000 to 2025. The strategy returned 12.15% annually vs 7.85% for the S&P 500. $10,000 became $175,600. It was invested in 23 of 25 years, posted a 68% win rate, and a down capture of 51.2%. Companies that compound cash generation don't just outperform. They fall less when everything else does.
Contents
- Method
- The Signal
- The Screen (SQL)
- What We Found
- $10,000 grew to $175,600. The S&P 500 reached $66,200.
- Annual Returns
- The Academic Case
- When It Works
- When It Struggles
- Limitations
- Run It Yourself
- Part of a Series
Data: FMP financial data warehouse, 2000–2025. Updated May 2026.
Method
Data source: Ceta Research (FMP financial data warehouse) Universe: All US exchanges (NYSE, NASDAQ, AMEX), market cap > $1B USD Period: 2000-2025 (25 years, 25 annual periods) Rebalancing: Annual (July), top 30 by highest ROIC, equal weight Execution: Next-day close (signal computed from the prior close, traded at the next session's close) Benchmark: S&P 500 Total Return (SPY) Cash rule: Hold cash if fewer than 10 stocks qualify Costs: Size-tiered transaction costs (0.1% for large-cap, 0.3% mid-cap, 0.5% small-cap)
Financial data uses a 45-day lag to prevent look-ahead bias. July rebalancing ensures annual filings (typically filed by April-May) are available. Full methodology: Ceta Research Backtest Methodology.
The Signal
| Filter | Threshold | Why |
|---|---|---|
| FCF growth years | >= 4 of last 5 FY years | Consistent cash generation, not one good year |
| All FCF positive | Every year > 0 | No negative cash flow years allowed |
| ROIC | > 15% | Capital-efficient business |
| Operating Margin | > 15% | Real pricing power and sustainable operations |
| Market Cap | > $1B USD | Liquid stocks only |
Selection: Top 30 by highest ROIC, equal weight.
The signal looks for something specific: companies that grew free cash flow in at least 4 of the last 5 fiscal years, never dipped into negative FCF, and currently earn high returns on invested capital with strong margins. This is a quality-growth filter. It finds businesses that compound cash generation efficiently, not just companies with one lucky year.
The ROIC ranking is key. Among all companies passing the filters, we pick the 30 with the highest return on invested capital. These are the businesses with the strongest competitive positions. They grow cash while deploying relatively little capital to do it.
The Screen (SQL)
WITH yearly_fcf AS (
  SELECT
    symbol,
    freeCashFlow,
    date,
    LAG(freeCashFlow) OVER (PARTITION BY symbol ORDER BY date) AS prev_fcf
  FROM cash_flow_statement
  WHERE period = 'FY'
    AND freeCashFlow IS NOT NULL
),
fcf_stats AS (
  SELECT
    symbol,
    COUNT(*) AS total_pairs,
    SUM(CASE WHEN freeCashFlow > prev_fcf AND prev_fcf > 0 THEN 1 ELSE 0 END) AS growth_years,
    MIN(freeCashFlow) AS min_fcf,
    MIN(prev_fcf) AS min_prev_fcf
  FROM yearly_fcf
  WHERE prev_fcf IS NOT NULL
    AND date >= '2019-01-01'
  GROUP BY symbol
  HAVING COUNT(*) >= 4
)
SELECT
  fs.symbol,
  p.companyName,
  p.exchange,
  p.sector,
  fs.growth_years,
  fs.total_pairs AS total_years,
  ROUND(k.returnOnInvestedCapitalTTM * 100, 1) AS roic_pct,
  ROUND(r.operatingProfitMarginTTM * 100, 1) AS op_margin_pct,
  ROUND(k.marketCap / 1e9, 1) AS market_cap_billions
FROM fcf_stats fs
JOIN key_metrics_ttm k ON fs.symbol = k.symbol
JOIN financial_ratios_ttm r ON fs.symbol = r.symbol
JOIN profile p ON fs.symbol = p.symbol
WHERE fs.growth_years >= 4
  AND fs.min_fcf > 0
  AND fs.min_prev_fcf > 0
  AND k.returnOnInvestedCapitalTTM > 0.15
  AND r.operatingProfitMarginTTM > 0.15
  AND k.marketCap > 1000000000
  AND p.exchange IN ('NYSE', 'NASDAQ', 'AMEX')
ORDER BY k.returnOnInvestedCapitalTTM DESC
LIMIT 30
Run this query on Ceta Research
What We Found

$10,000 grew to $175,600. The S&P 500 reached $66,200.
| Metric | FCF Compounders | S&P 500 |
|---|---|---|
| CAGR | 12.15% | 7.85% |
| Total Return | 1,656% | 562% |
| Volatility | 15.82% | 16.63% |
| Max Drawdown | -31.41% | -38.01% |
| Sharpe Ratio | 0.641 | 0.352 |
| Sortino Ratio | 1.622 | 0.628 |
| Win Rate (annual) | 68% | - |
| Up Capture | 118.3% | - |
| Down Capture | 51.2% | - |
| Beta | 0.853 | - |
| Alpha | 5.16% | - |
| Avg Stocks per Period | 27.0 | - |
| Cash Periods | 2 of 25 | - |
The +4.29% excess CAGR compounded into a substantial terminal value gap. $10K became $175,600 vs $66,200 for the S&P 500. That's 2.7x the benchmark. The Sharpe ratio of 0.641 vs 0.352 shows the excess return came with slightly lower volatility (15.82% vs 16.63%).
Down capture of 51.2% means in years when SPY fell, this portfolio absorbed about half the damage. Part of that is honest timing rather than active protection: in two of the five down years (2000 and 2001), the screen couldn't find 10 qualifying stocks and held cash, earning 0% while SPY fell 14.8% and 22.4%. In the three down years it was actually invested (2007, 2008, 2021), it beat SPY in two. Combined with up capture of 118.3%, you captured more upside than the benchmark while shedding roughly half the downside.
The Sortino ratio tells the story cleanly: 1.622 vs 0.628. More than double. The downside volatility is structurally lower than total volatility suggests. These companies don't collapse during drawdowns because their cash generation is real.
The screen held cash in just 2 of 25 years, both in 2000-2001, before FMP's coverage gave enough companies a full six-year fiscal-year history to clear the consistency filter. From 2002 on, it found enough qualifying stocks (27.0 average) in every single year. Deep markets with consistent financial reporting produce reliable results for quality-growth screens.
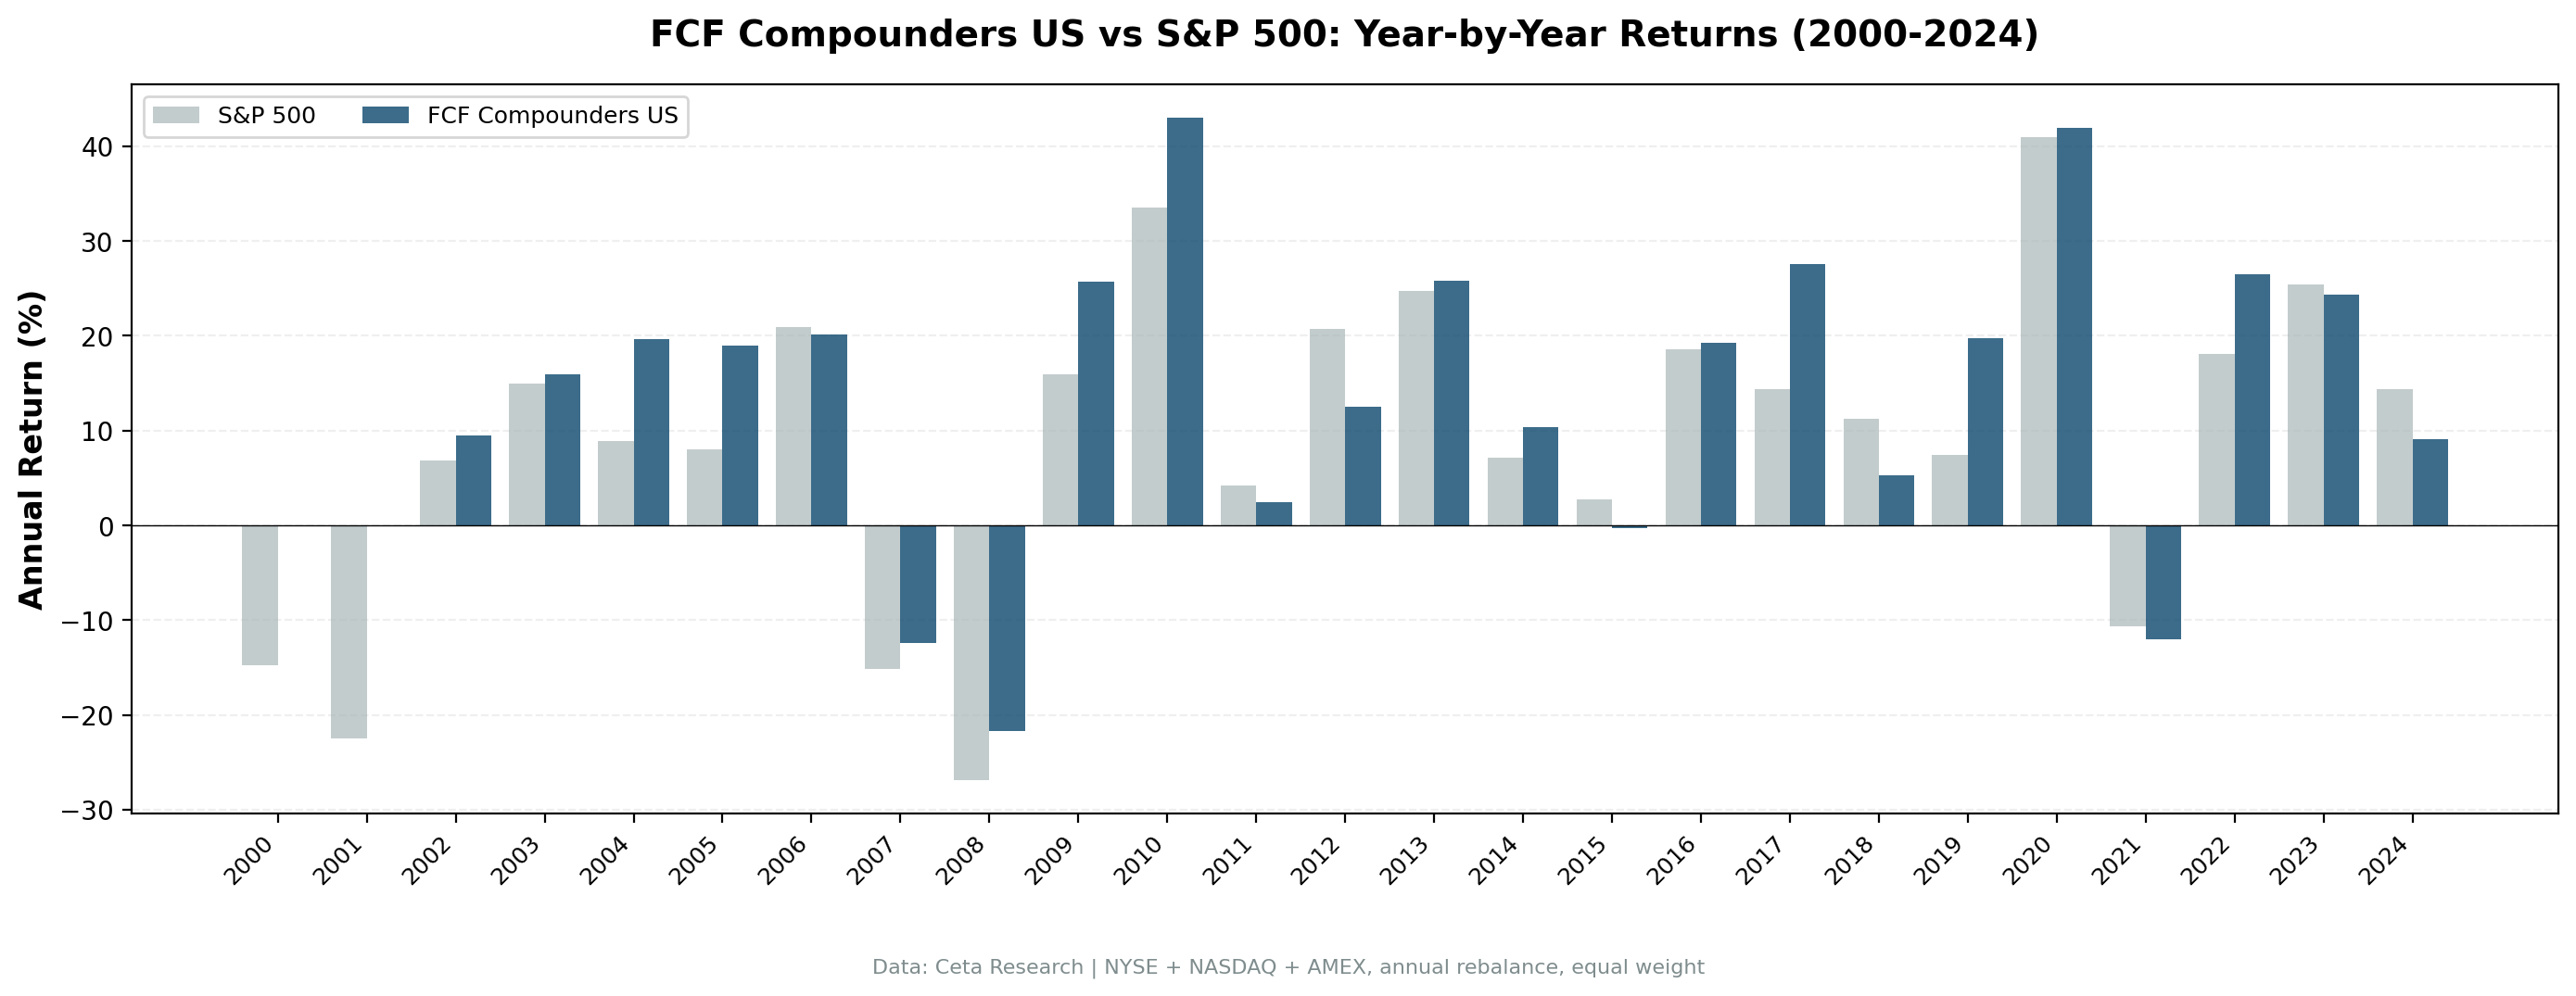
Annual Returns
| Year | Strategy | S&P 500 | Excess |
|---|---|---|---|
| 2000 | 0.0% (cash) | -14.8% | +14.8% |
| 2001 | 0.0% (cash) | -22.4% | +22.4% |
| 2004 | +19.7% | +8.9% | +10.8% |
| 2005 | +19.0% | +8.0% | +11.0% |
| 2008 | -21.7% | -26.9% | +5.2% |
| 2009 | +25.7% | +16.0% | +9.7% |
| 2010 | +43.0% | +33.5% | +9.5% |
| 2017 | +27.6% | +14.3% | +13.2% |
| 2020 | +41.9% | +41.0% | +0.9% |
| 2022 | +26.5% | +18.1% | +8.4% |
The pattern: outperformance clusters around market stress and early recoveries. In 2000 and 2001, when the dot-com crash wiped 14.8% then 22.4% off the S&P 500, the screen couldn't find 10 qualifying stocks and sat in cash. That isn't active protection, it's the filter being strict on a young dataset, but the effect was the same: 0% beats a 20% loss. In 2008, the strategy fell 21.7% vs SPY's 26.9%. Still painful, but 5.2 points of protection during the worst financial crisis in modern history.
2010 was the standout: +43.0% vs +33.5%. Quality companies that survived the GFC captured the recovery aggressively. They had cash to deploy while competitors were deleveraging.
The strategy lagged most in 2012 (-8.2% excess), 2018 (-5.9%), and 2024 (-5.3%), years when a handful of megacaps drove the index and an equal-weight quality screen couldn't keep pace. Quality-growth screens tend to trail when the market's biggest names dominate the return.
The Academic Case
The strategy is rooted in combining growth signals with quality metrics, an approach with strong academic backing.
Mohanram (2005) built a financial strength score for growth stocks and showed that combining cash flow stability with quality metrics separated winners from losers among high-growth companies. Traditional value metrics fail for growth stocks. Consistency and quality don't.
Frankel and Lee (1998) demonstrated that fundamental valuation models using accounting data predict cross-sectional stock returns. Systematic fundamental analysis, which is exactly what this screen does, identifies mispriced securities more reliably than price-based metrics alone.
Novy-Marx (2013) showed that profitable firms outperform unprofitable firms independently of value. High-ROIC compounders capture this quality premium directly.
Asness, Frazzini, and Pedersen (2019) formalized quality as a factor in "Quality Minus Junk" and demonstrated it works across countries, time periods, and asset classes. FCF compounders sit squarely in the quality bucket.
When It Works
During and after market stress. Companies with 4+ years of consistent FCF growth don't depend on favorable conditions. When credit tightens and weaker companies struggle, compounders keep generating cash. The 2007-2008 drawdown showed it clearly: the strategy fell 12.4% then 21.7% while SPY fell 15.2% then 26.9%. The 2009-2010 recovery was even stronger, with the portfolio up 25.7% then 43.0%.
In rising rate environments. High ROIC means these companies finance growth internally. When the cost of external capital goes up, self-funding businesses become relatively more valuable.
Over long holding periods. The compounding math needs time. 4.29% excess CAGR doesn't look dramatic in year one. Over 25 years it turns $10K into $175,600 vs $66,200. The consistency premium compounds.
When It Struggles
Megacap-led markets. When a few large index names drive most of the return, an equal-weight quality screen underperforms. 2012 (-8.2% excess), 2018, and 2024 all saw the strategy trail as the S&P's biggest constituents outran the broader market.
Late-cycle momentum. 2011 and 2015 both showed small negative excess. Extended bull markets where everything rises make quality's protective edge less valuable.
Limitations
Survivorship bias. FMP data includes delisted stocks where available, but early-year coverage isn't perfect. Results before 2005 should be interpreted with more caution.
Transaction costs are estimated. The size-tiered model (0.1% large-cap, 0.3% mid, 0.5% small) is reasonable but approximate. Real-world slippage varies.
Point-in-time data quality. We use a 45-day filing lag and FY data ordered by filing date. FMP coverage of filing dates improves over time. Early periods may have slight timing imperfections.
Single strategy. This combines growth consistency with quality, but doesn't account for valuation, momentum, or sentiment. Pairing with other signals could improve results.
The filter is strict. Requiring 4+ years of FCF growth, all positive, ROIC > 15%, and OPM > 15% narrows the universe significantly. Only about 27 stocks qualify per year on US exchanges, and in 2000-2001 the screen couldn't find 10. Smaller markets struggle to produce enough candidates at all.
Run It Yourself
Live screen:
python3 fcf-compounders/screen.py --preset us
Full backtest:
python3 fcf-compounders/backtest.py --preset us --output results.json --verbose
All exchanges:
python3 fcf-compounders/backtest.py --global --output results/exchange_comparison.json
Code: github.com/ceta-research/backtests/tree/main/fcf-compounders
Part of a Series
This is the US edition of our FCF Compounders analysis. We ran the same screen on 18 exchanges globally:
- Germany: +3.80% excess vs DAX, 20 invested years out of 25
- UK: +9.48% excess vs FTSE, 20 invested years out of 25
- Global comparison: exchanges with invested periods side by side
Past performance does not guarantee future results. Backtested returns are hypothetical and subject to survivorship bias, look-ahead bias, and estimated transaction costs. This is research content, not investment advice.
Data: Ceta Research (FMP financial data warehouse), 2000-2025. Full methodology: github.com/ceta-research/backtests/blob/main/METHODOLOGY.md


