
FCF Compounders on UK Stocks: +9.48% Annual Excess vs FTSE 100 Over 25 Years
FCF Compounders screen on LSE from 2000-2025. 10.71% CAGR vs 1.23% for the FTSE 100. Invested 20 of 25 years, beating the benchmark by 9.48% annually.

FCF Compounders on UK Stocks: Quality Cash Growth on the LSE for 25 Years
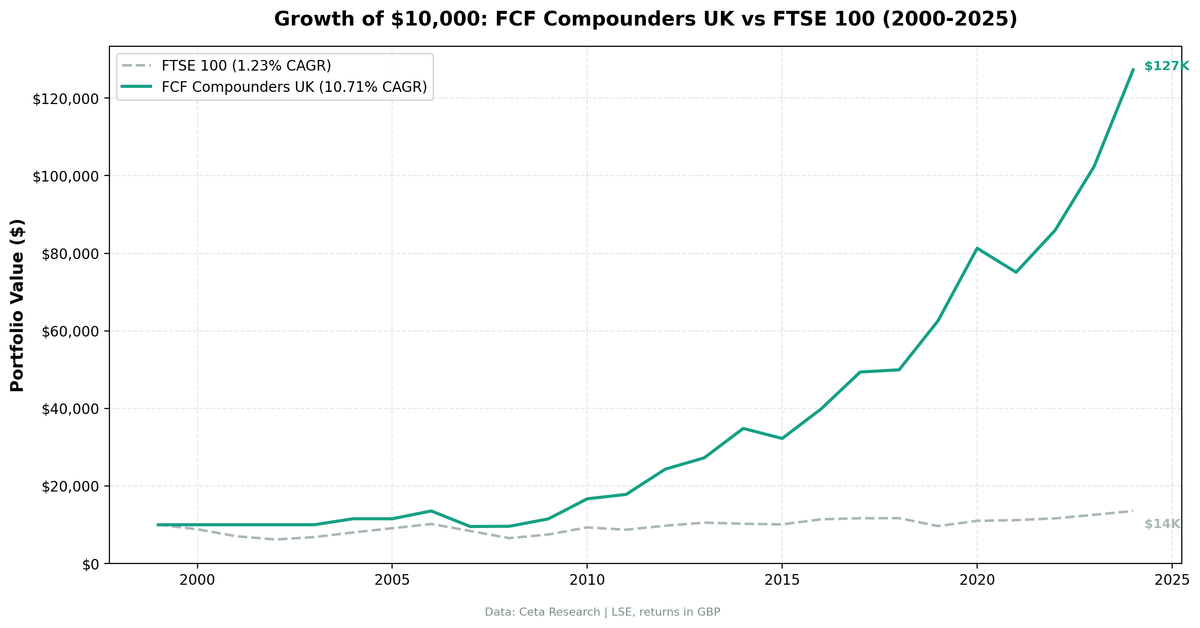
The FTSE 100 gained 1.23% annually over 25 years. A strict quality screen for LSE-listed FCF compounders returned 10.71% over the same period. The filter held cash in 5 of those 25 years, all in the early 2000s when too few UK companies had the required data history. From 2006 on it was invested almost every year, and the +9.48% annual excess vs the FTSE 100 is the most direct measure of the signal's strength in UK equities. $10,000 became $127,300 vs $13,600 for the index.
Contents
- Method
- The Signal
- The Screen (SQL)
- What We Found
- $10,000 grew to $127,300. The FTSE 100 reached $13,600.
- The 5 Cash Years
- Annual Returns (Invested Years)
- The Early Cash Years
- Limitations
- Run It Yourself
- Part of a Series
Data: FMP financial data warehouse, 2000–2025. Updated May 2026.
Method
Data source: Ceta Research (FMP financial data warehouse) Universe: LSE (London Stock Exchange), market cap > £500M Period: 2000-2025 (25 years, 25 annual periods) Rebalancing: Annual (July), top 30 by highest ROIC, equal weight Execution: Next-day close (signal computed from the prior close, traded at the next session's close) Benchmark: FTSE 100 (^FTSE price index, GBP) Cash rule: Hold cash if fewer than 10 stocks qualify Costs: Size-tiered transaction costs (0.1% large-cap, 0.3% mid-cap, 0.5% small-cap)
Note on the benchmark: The ^FTSE price index doesn't include dividends. FTSE 100 total return (with dividends) is meaningfully higher, roughly 4-5% annually. Strategy returns use FMP adjClose, which is dividend-adjusted for individual stocks. This creates a partial mismatch that modestly overstates the raw excess. The strategy's consistent outperformance suggests the signal is real regardless, but readers should interpret the +9.48% figure as an upper bound.
Financial data uses a 45-day lag to prevent look-ahead bias. July rebalancing ensures annual filings are available. Full methodology: Ceta Research Backtest Methodology.
The Signal
| Filter | Threshold | Why |
|---|---|---|
| FCF growth years | >= 4 of last 5 FY years | Consistent cash generation |
| All FCF positive | Every year > 0 | No negative cash flow years |
| ROIC | > 15% | Capital-efficient business |
| Operating Margin | > 15% | Real pricing power |
| Market Cap | > £500M | Liquid stocks only |
Selection: Top 30 by highest ROIC, equal weight.
The Screen (SQL)
WITH yearly_fcf AS (
  SELECT
    symbol,
    freeCashFlow,
    date,
    LAG(freeCashFlow) OVER (PARTITION BY symbol ORDER BY date) AS prev_fcf
  FROM cash_flow_statement
  WHERE period = 'FY'
    AND freeCashFlow IS NOT NULL
),
fcf_stats AS (
  SELECT
    symbol,
    COUNT(*) AS total_pairs,
    SUM(CASE WHEN freeCashFlow > prev_fcf AND prev_fcf > 0 THEN 1 ELSE 0 END) AS growth_years,
    MIN(freeCashFlow) AS min_fcf,
    MIN(prev_fcf) AS min_prev_fcf
  FROM yearly_fcf
  WHERE prev_fcf IS NOT NULL
    AND date >= '2019-01-01'
  GROUP BY symbol
  HAVING COUNT(*) >= 4
)
SELECT
  fs.symbol,
  p.companyName,
  p.sector,
  fs.growth_years,
  ROUND(k.returnOnInvestedCapitalTTM * 100, 1) AS roic_pct,
  ROUND(r.operatingProfitMarginTTM * 100, 1) AS op_margin_pct,
  ROUND(k.marketCap / 1e9, 1) AS market_cap_billions
FROM fcf_stats fs
JOIN key_metrics_ttm k ON fs.symbol = k.symbol
JOIN financial_ratios_ttm r ON fs.symbol = r.symbol
JOIN profile p ON fs.symbol = p.symbol
WHERE fs.growth_years >= 4
  AND fs.min_fcf > 0
  AND fs.min_prev_fcf > 0
  AND k.returnOnInvestedCapitalTTM > 0.15
  AND r.operatingProfitMarginTTM > 0.15
  AND k.marketCap > 500000000
  AND p.exchange IN ('LSE')
ORDER BY k.returnOnInvestedCapitalTTM DESC
LIMIT 30
Run this query on Ceta Research
What We Found
$10,000 grew to $127,300. The FTSE 100 reached $13,600.
| Metric | FCF Compounders | FTSE 100 |
|---|---|---|
| CAGR | 10.71% | 1.23% |
| Total Return | 1,173% | 36% |
| Volatility | 16.48% | 12.91% |
| Max Drawdown | -29.61% | -38.07% |
| Sharpe Ratio | 0.437 | -0.176 |
| Sortino Ratio | 0.959 | -0.217 |
| Win Rate (annual) | 76% | - |
| Up Capture | 168.8% | - |
| Down Capture | -21.2% | - |
| Beta | 0.729 | - |
| Alpha | 8.87% | - |
| Avg Stocks per Period | 12.3 | - |
| Cash Periods | 5 of 25 (20%) | - |
The -21.2% down capture needs explanation. A negative down capture means that in years when the FTSE 100 fell, the strategy's average return was actually positive. Two things drive this. First, the early cash years (2000-2002) overlapped the dot-com decline, so the portfolio sat at 0% while the index dropped. Second, 2019 was a genuine standout: the FTSE fell 17.4% on Brexit and early-COVID fears while the strategy gained 25.4%. That single year does a lot of work. The one invested down-year where the strategy fell harder than the index was 2007 (-29.6% vs -17.7%).
The important number is the Sharpe ratio: 0.437 vs -0.176 for the FTSE 100 price index. On a risk-adjusted basis, this isn't close.
The 5 Cash Years
The filter was invested in 20 of 25 years. The five cash periods were all early:
2000-2005: The filter found qualifying stocks in only 1 of these 6 years (2004 was the first invested year, then 2006 onward). The LSE simply didn't have enough companies passing the strict 4/5 FCF growth + ROIC > 15% + OPM > 15% filter with the required six-year data history in the early period.
2006 onward: The strategy was invested in every year. As FMP's LSE data coverage improved and UK financial reporting became more standardized, enough companies accumulated the required 6+ years of consecutive FY data to fill the portfolio.
Annual Returns (Invested Years)
| Year | Strategy | FTSE 100 | Excess |
|---|---|---|---|
| 2004 | +15.4% | +17.6% | -2.2% |
| 2006 | +17.4% | +12.0% | +5.4% |
| 2007 | -29.6% | -17.7% | -11.9% |
| 2008 | +0.7% | -22.0% | +22.6% |
| 2009 | +19.7% | +14.3% | +5.5% |
| 2010 | +45.2% | +24.4% | +20.8% |
| 2011 | +6.8% | -6.3% | +13.1% |
| 2012 | +36.5% | +11.8% | +24.7% |
| 2013 | +12.0% | +8.1% | +3.9% |
| 2014 | +27.8% | -2.7% | +30.6% |
| 2015 | -7.4% | -1.6% | -5.8% |
| 2016 | +23.7% | +13.1% | +10.6% |
| 2017 | +23.9% | +2.3% | +21.5% |
| 2018 | +1.1% | +0.1% | +1.0% |
| 2019 | +25.4% | -17.4% | +42.9% |
| 2020 | +29.8% | +14.2% | +15.7% |
| 2021 | -7.6% | +1.5% | -9.2% |
| 2022 | +14.4% | +4.1% | +10.4% |
| 2023 | +19.2% | +7.9% | +11.3% |
| 2024 | +24.3% | +8.1% | +16.3% |
2019 stands out: +25.4% vs -17.4% for the FTSE 100. The FTSE fell sharply on Brexit uncertainty and early COVID fears. FCF compounders, cash-generative businesses with low leverage, held up and gained. The 42.9-point spread is the largest in the series.
2010 was a huge year: +45.2% vs +24.4%. The recovery from the GFC was aggressive for high-quality cash compounders that survived with their balance sheets intact. 2012 (+36.5%) and 2014 (+27.8%) kept the run going.
2007 was the worst year: -29.6% vs -17.7%. The screen's quality names fell harder than the index as the credit crunch began, the one invested down-year where the strategy lost more than the FTSE. 2021 also lagged (-7.6% vs +1.5%) as cyclical and recovery stocks dominated.
The Early Cash Years
The 20% cash rate is concentrated entirely in the first six years (2000-2005). After 2005, the screen was invested every single year. The early cash periods reflect data history, not a recurring deployment problem: a UK company needs six consecutive years of fiscal-year filings to clear the 4-of-5 FCF growth test, and FMP's LSE coverage was thin before the mid-2000s.
The cash years still drag the headline CAGR. Those five years at 0% sit in the compounding chain and pull the 25-year average down. Measured only over the 20 invested years, the strategy's annualized return is well above the 10.71% full-period CAGR. The signal, when it fires, is strong.
The practical implication: Running this screen on LSE works, but expect a slow start. A live investor beginning in 2000 would have waited until 2004 for the first portfolio. From the mid-2000s on, the filter found enough qualifying names in a 500-company universe to stay invested.
Limitations
Benchmark mismatch. ^FTSE is a price-only index. FTSE 100 total return (with dividends, roughly 3-4% annually) would reduce the stated excess. The strategy still outperforms, but by a smaller margin.
Early cash periods. The 20% cash rate (all in 2000-2005) reduces compounding and distorts some relative metrics. Down capture and the early win-rate figures look favorable partly because the cash years are included in the calculation.
Small invested universe. 12.3 stocks per period is concentrated. If any sector experiences simultaneous FCF deterioration, the portfolio could be undiversified at the worst time.
Data coverage. FMP's early LSE coverage (2000-2005) is thinner than US data. The cash periods reflect partly a data constraint, not purely a signal failure.
Currency. Returns are in GBP. No currency hedging or conversion is modeled.
Run It Yourself
Live screen:
python3 fcf-compounders/screen.py --preset uk
Full backtest:
python3 fcf-compounders/backtest.py --preset uk --output results.json --verbose
Code: github.com/ceta-research/backtests/tree/main/fcf-compounders
Part of a Series
This is the UK edition of our FCF Compounders analysis. We ran the same screen on 18 exchanges globally:
- US: +4.29% excess vs S&P 500, invested 23 of 25 years, the flagship result
- Germany: +3.80% excess vs DAX, 20 invested years out of 25
- Global comparison: all exchanges with invested periods side by side
Past performance does not guarantee future results. Backtested returns are hypothetical and subject to survivorship bias, look-ahead bias, and estimated transaction costs. This is research content, not investment advice.
Data: Ceta Research (FMP financial data warehouse), 2000-2025. Full methodology: github.com/ceta-research/backtests/blob/main/METHODOLOGY.md


