
FCF Compounders Across 5 Exchanges: A Strict Filter Reveals Where Quality Cash Growth Exists
We ran the FCF Compounders screen on 18 exchanges from 2000-2025 with local benchmarks. US led at 12.15% CAGR (+4.29% vs S&P 500). UK +9.48% vs FTSE. India trails Sensex by 6.14% annually. Only deep markets work.


FCF Compounders Across Exchanges: A Strict Filter Reveals Where Quality Cash Growth Exists
We ran the same FCF Compounders screen on 18 exchanges worldwide from 2000 to 2025. Same filters, same ROIC ranking, same rebalancing rules. Each exchange is now benchmarked against its local index (DAX for Germany, FTSE 100 for UK, Sensex for India, Hang Seng for Hong Kong) rather than SPY. Only a handful of exchanges had enough qualifying stocks to maintain invested positions. Most of the rest went heavily or entirely to cash because the filter is demanding: 4+ years of consistent FCF growth, all positive, ROIC above 15%, operating margin above 15%. This is a quality-growth screen that only works in deep markets with strong financial reporting. Where it works, the results are notable.
Contents
- Method
- The Results
- The US dominates. Deep markets produce the best results for strict quality screens.
- What Drives the Differences
- Market Depth Is Everything
- The Cash Period Problem
- Drawdown Comparison
- Sharpe Ratio Comparison
- The Honest Assessment
- All Regional Posts
Data: FMP financial data warehouse, 2000–2025. Updated May 2026.
Method
Data source: Ceta Research (FMP financial data warehouse) Signal: FCF grew 4+/5yr, all FCF positive, ROIC > 15%, Operating Margin > 15% Selection: Top 30 by highest ROIC, equal weight Period: 2000-2025 (25 years, 25 annual periods) Rebalancing: Annual (July), next-day close execution (MOC) Benchmark: Local currency index per exchange (see table). SPY used as cross-market reference only. Cash rule: Hold cash if fewer than 10 stocks qualify Costs: Size-tiered transaction costs (0.1% large-cap, 0.3% mid-cap, 0.5% small-cap)
Market cap thresholds were set per exchange to target liquid stocks: $1B for the US, £/€500M for Europe, ₹20B for India. All returns are in local currency. Full methodology: Ceta Research Backtest Methodology.
The Results
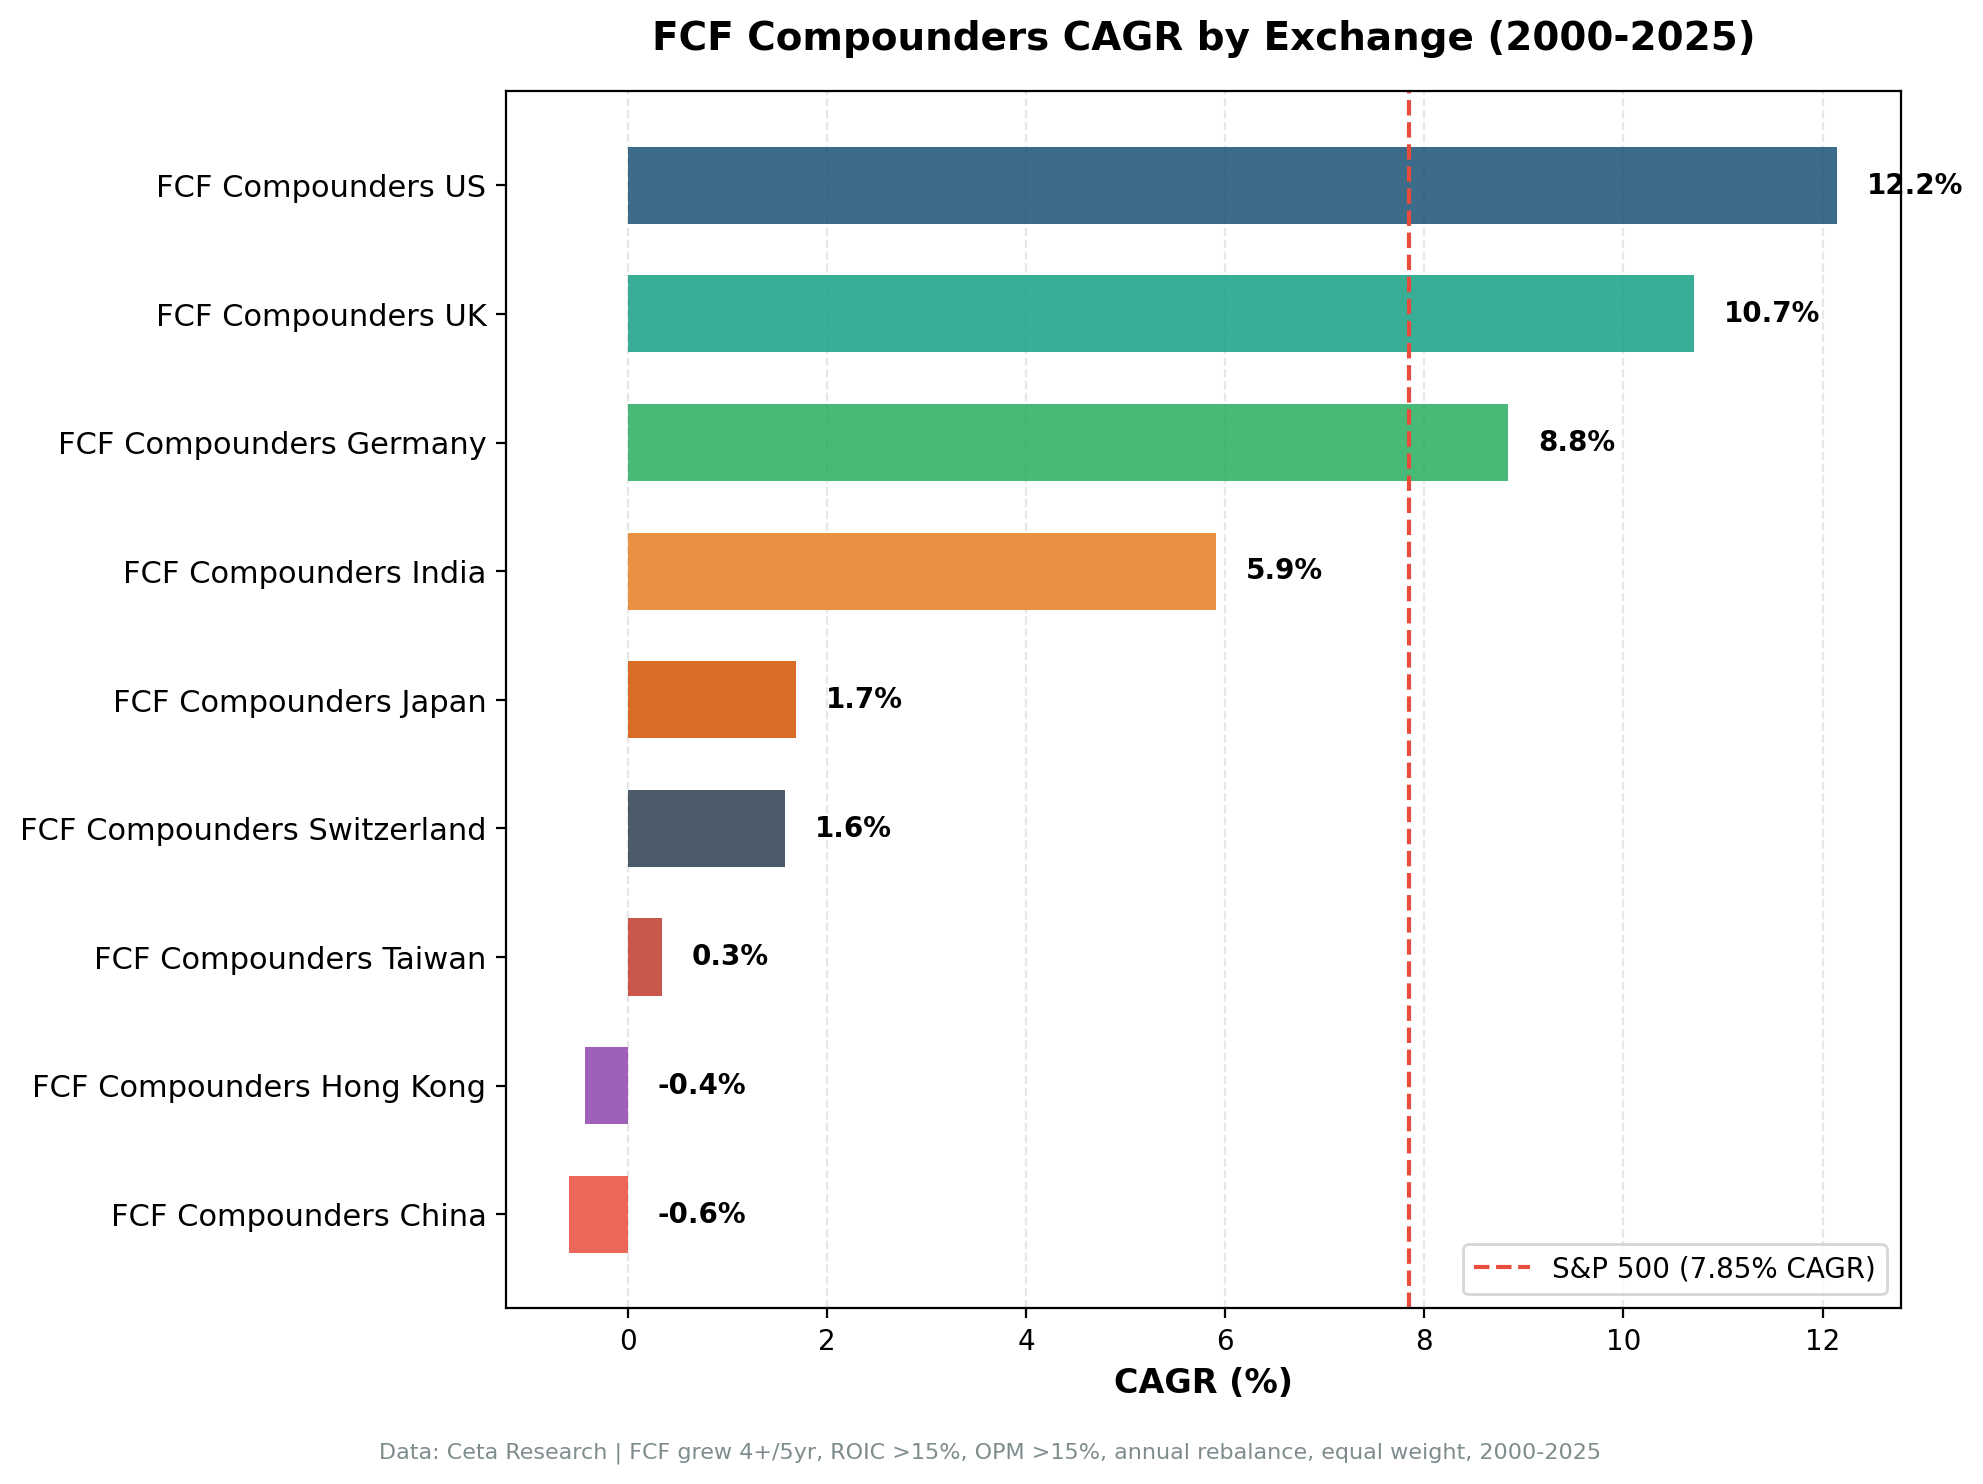
The US dominates. Deep markets produce the best results for strict quality screens.
| Exchange | CAGR | Excess vs Local | Local Benchmark | Sharpe | Max DD | Cash % | Avg Stocks |
|---|---|---|---|---|---|---|---|
| US (NYSE+NASDAQ+AMEX) | 12.15% | +4.29% | S&P 500 (7.85%) | 0.641 | -31.41% | 8% | 27.0 |
| UK (LSE) | 10.71% | +9.48% | FTSE 100 (1.23%)* | 0.437 | -29.61% | 20% | 12.3 |
| Germany (XETRA) | 8.84% | +3.80% | DAX (5.04%) | 0.516 | -35.25% | 20% | 13.7 |
| India (NSE) | 5.91% | -6.14% | Sensex (12.06%) | -0.036 | -10.81% | 56% | 20.4 |
| Hong Kong (HKSE) | -0.43% | -2.07% | Hang Seng (1.64%) | -0.315 | -41.93% | 76% | 12.0 |
| China (SHH) | -0.59% | -3.02% | SSE Composite (2.43%) | -0.201 | -44.52% | 52% | 21.7 |
*UK benchmark is the ^FTSE price-only index. FTSE total return (with dividends) is roughly 4-5% annually, which reduces the stated excess materially. See UK blog for full discussion.
For cross-market comparison using SPY as the common benchmark:
| Exchange | CAGR | vs SPY (7.85%) |
|---|---|---|
| US | 12.15% | +4.29% |
| UK | 10.71% | +2.86% |
| Germany | 8.84% | +0.99% |
| India | 5.91% | -1.94% |
| Hong Kong | -0.43% | -8.28% |
| China | -0.59% | -8.44% |
The spread tells you something important about this strategy. US: +4.29% excess, invested 23 of 25 years. China: -8.44% excess vs SPY, 52% cash. The same filter, the same logic. The difference is market depth and financial reporting quality.
Twelve additional exchanges were tested (Canada, Korea, Japan, Switzerland, Sweden, Norway, Taiwan, Thailand, South Africa, Saudi Arabia, Israel, Singapore). All had 80-100% cash periods. The filter found fewer than 10 qualifying stocks in nearly every year.
What Drives the Differences
Market Depth Is Everything
The US had 27.0 qualifying stocks per year in almost every year (it held cash only in 2000-2001). That's because NYSE+NASDAQ+AMEX gives the screen 4,000+ companies with multi-decade financial history. The filter can afford to be strict and still find 30 candidates.
Germany averaged 13.7. Below the 30-stock target. The Mittelstand produces quality compounders, but XETRA's universe is smaller. Five cash periods in the early years when data coverage was thinnest. The +3.80% excess vs the DAX reflects a genuine quality premium in German industrials.
India averaged about 20 stocks when invested but was only invested 44% of the time. The UK was a different story this time: it averaged 12 stocks but stayed invested in 20 of 25 years, and the filter sustained itself once UK data coverage matured in the mid-2000s.
The Cash Period Problem
Cash periods are the Achilles heel of strict quality screens in smaller markets. When fewer than 10 stocks qualify, the portfolio holds cash. Cash earns nothing in this backtest (no risk-free return credited). Every cash year drags the CAGR.
UK's CAGR of 10.71% beats the FTSE price index by 9.48%, and unlike the earlier read on this market, the portfolio was invested in 20 of 25 years. The five cash years were all in the early 2000s. Once UK data coverage matured, the signal deployed consistently.
India is a more sobering case. Despite 5.91% nominal CAGR, the strategy trails the Sensex by 6.14% annually. The Sensex returned 12.06% CAGR over 25 years, one of the strongest runs of any major index globally. Even with 14 cash years, missing that compounding hurt. When India's FCF compounders were invested (11 years), returns were reasonable, but the Sensex grew so fast that the strategy couldn't keep up.
Drawdown Comparison
| Exchange | Max Drawdown | Context |
|---|---|---|
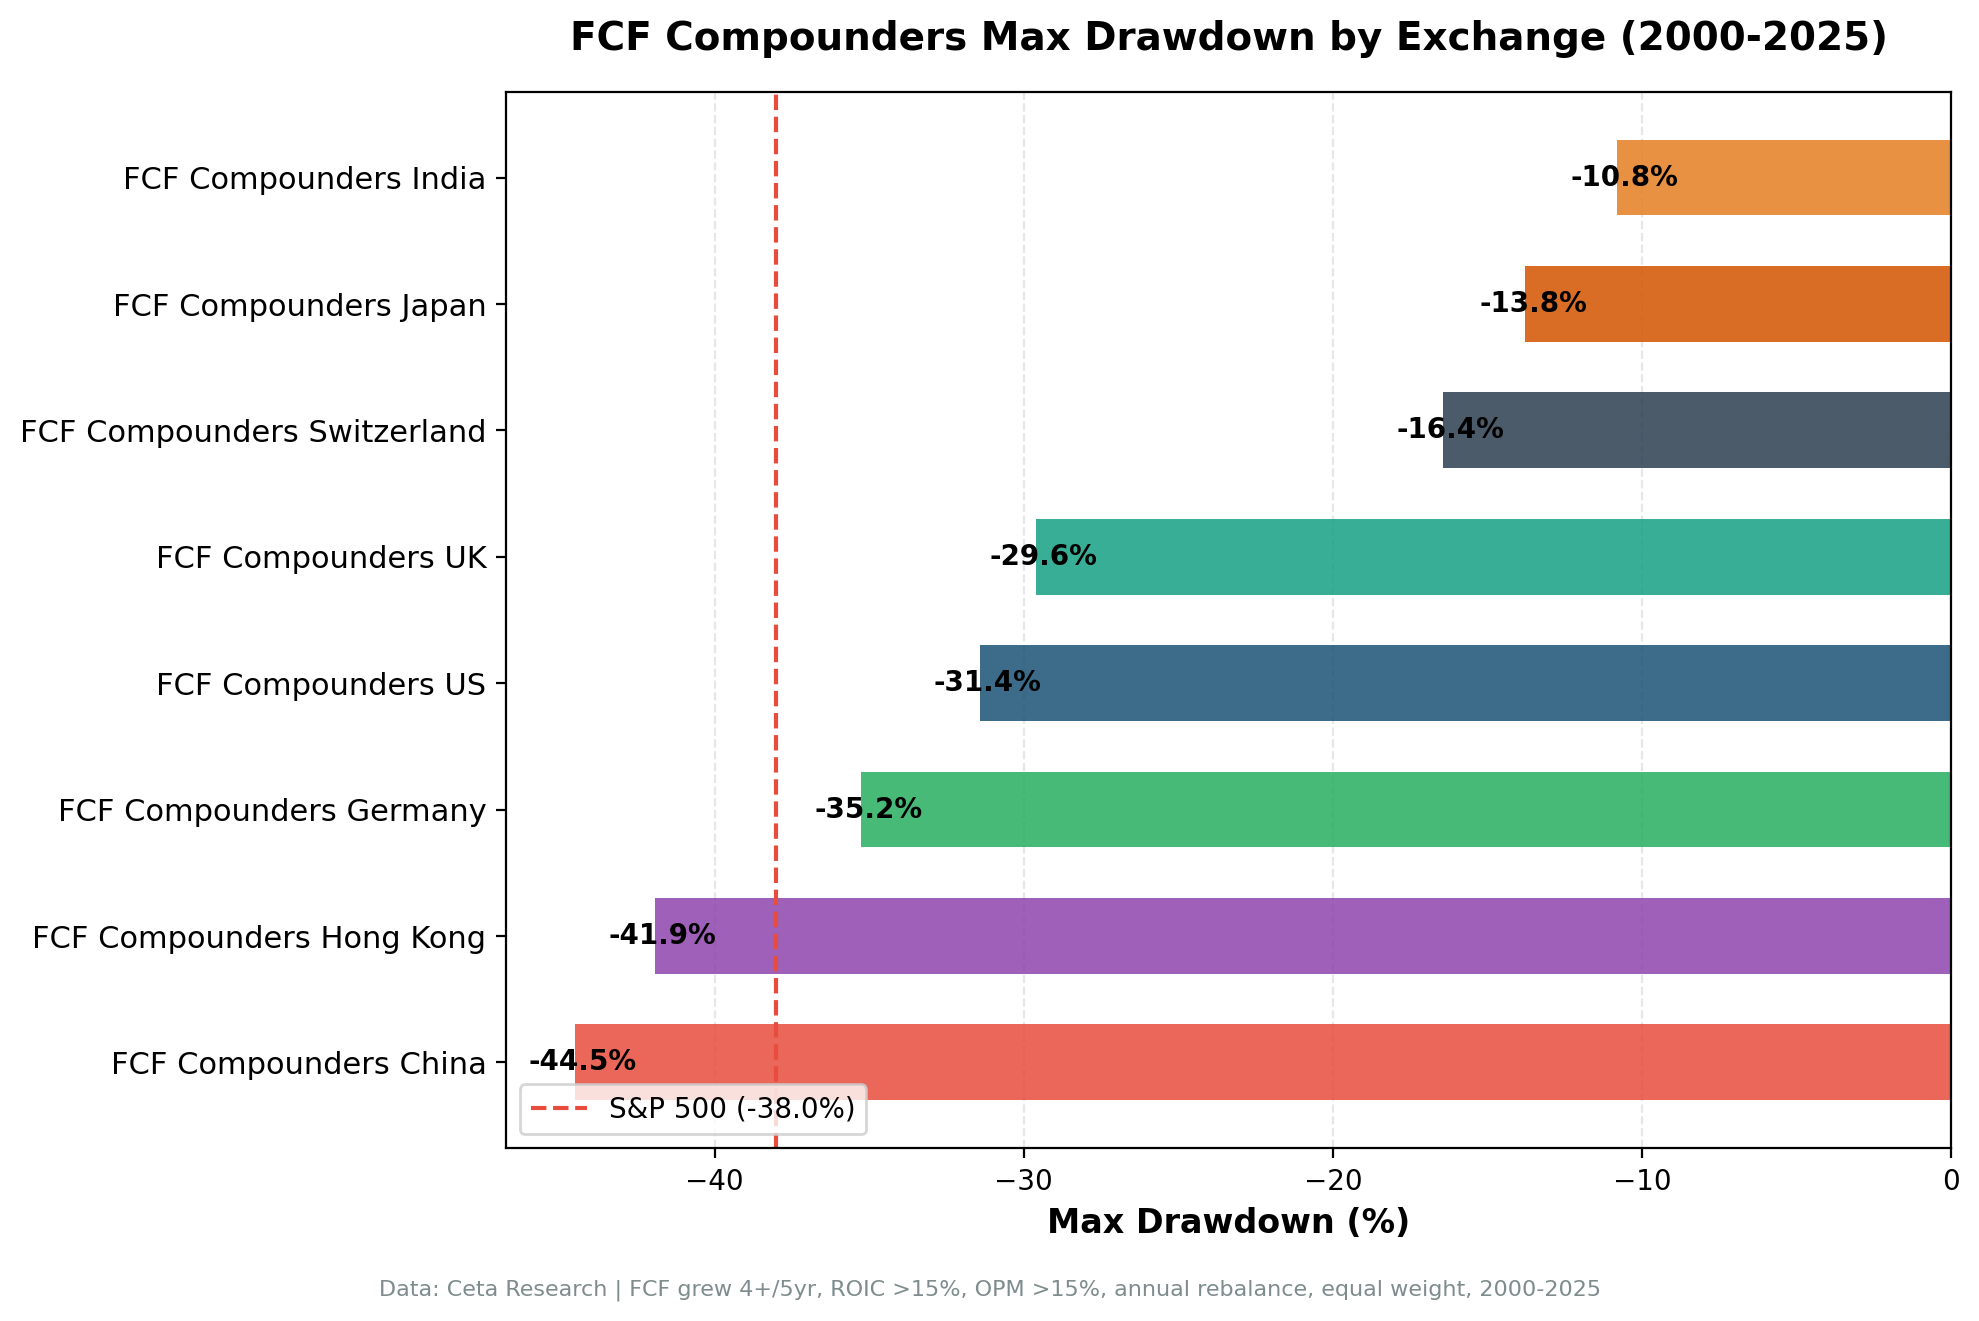
| India | -10.81% | Cash during the GFC and early 2000s absorbed the worst periods |
| UK | -29.61% | Now invested 20 of 25 years, so the drawdown is real |
| US | -31.41% | Invested 23 of 25 years, real drawdown through real crises |
| Germany | -35.25% | Export-heavy, euro zone crisis exposure |
| Hong Kong | -41.93% | Structural decline in HK-listed quality compounders |
| China | -44.52% | 2021-2023 systemic sell-off |
India's shallow -10.81% drawdown is partly an artifact. If you're holding cash during the worst years because nothing qualifies, your max drawdown will be artificially low. The US's -31.41% is the real benchmark: invested in 23 of 25 years, real losses during real crises, still shallower than SPY's -38.01%. The UK's -29.61% is now a real drawdown too, since the strategy was invested through the 2007-2008 crash.
China's -44.52% reflects the 2021-2023 sell-off in Chinese equities. The screen found qualifying stocks from ~2010, but regulatory crackdowns and structural deleveraging hit quality stocks along with everything else.
Sharpe Ratio Comparison
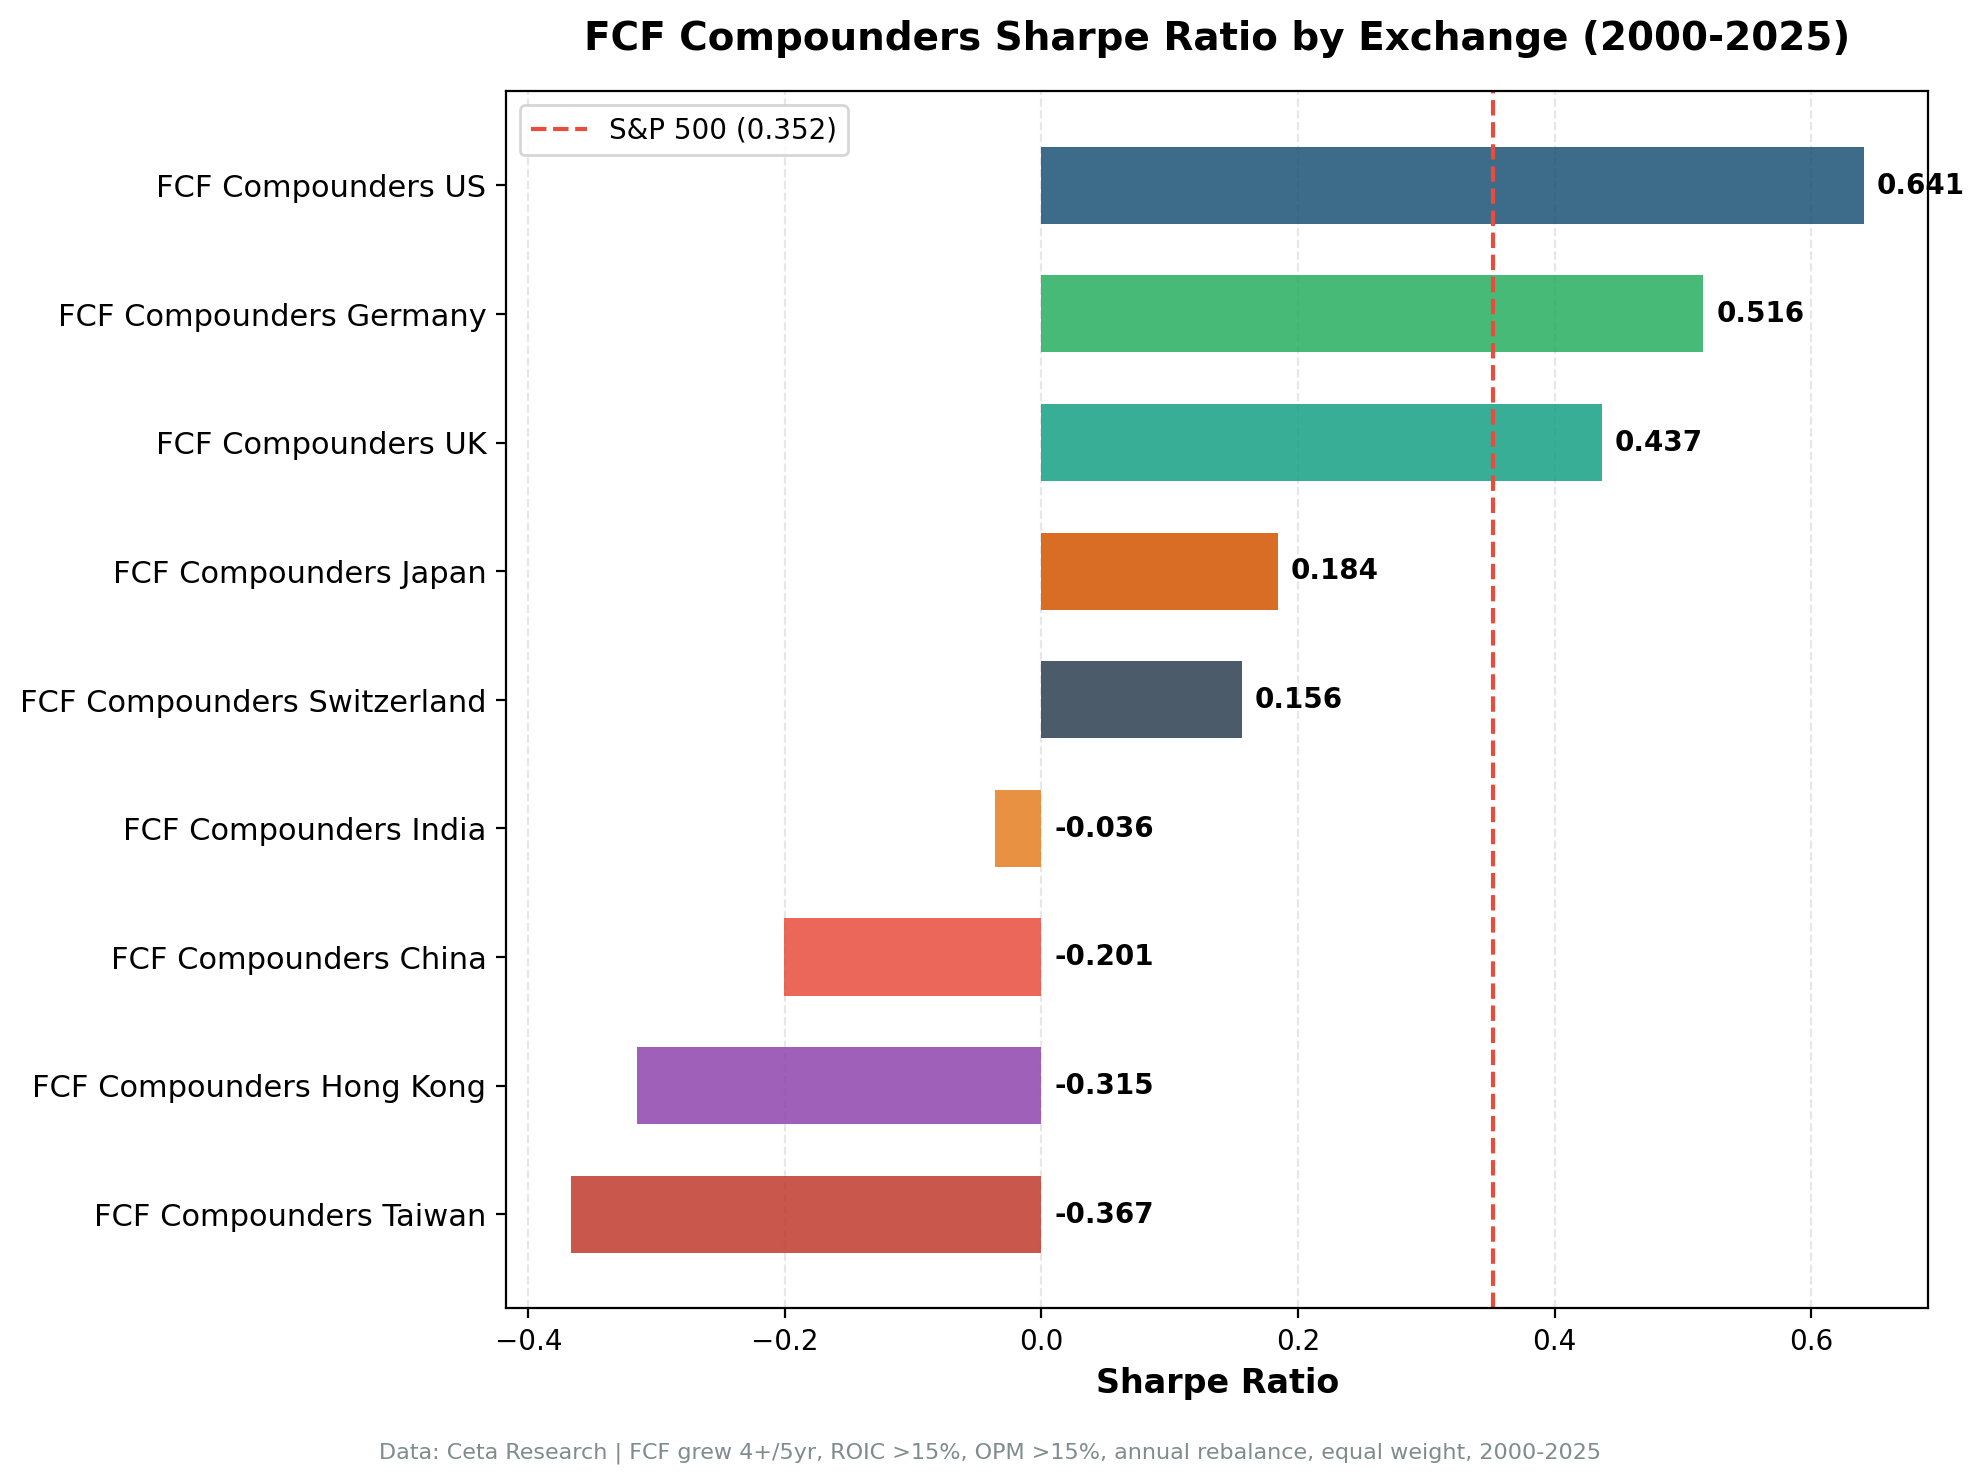
The US leads with a Sharpe of 0.641, well above SPY's 0.352. Germany at 0.516 is strong. UK at 0.437 is solid now that the strategy is invested most years.
India (-0.036), China (-0.201), and Hong Kong (-0.315) all produced negative Sharpe ratios. The strategy destroyed value relative to the risk-free rate in these markets, primarily because cash periods interrupted compounding while the local benchmarks surged (India) or the invested periods coincided with structural market declines (China, HK).
The Honest Assessment
This strategy works where it works: deep, well-reported markets with 500+ large-cap companies and decades of financial history. That means the US first, then the UK and Germany close behind (with the caveat that the FTSE benchmark comparison overstates the UK edge due to the price-only index).
India is a counter-intuitive failure case. The market is large and growing fast, but the Sensex grew so quickly that a quality screen returning 5.91% annually looks poor against a 12.06% local benchmark. The strategy wasn't bad. The alternative was just remarkable.
China and Hong Kong failed primarily due to structural headwinds during the invested period, not because the quality signal was wrong.
The practical takeaway: For running this screen, start with US equities. That's where it has the longest uninterrupted track record, the deepest universe, and the strongest risk-adjusted returns. UK is viable with realistic expectations: a slow start in the early 2000s, then consistent deployment. Germany is a credible alternative for EUR-based investors.
All Regional Posts
We published detailed analysis for the three exchanges that consistently produced enough qualifying stocks:
- US (NYSE+NASDAQ+AMEX): +4.29% excess vs S&P 500, invested 23 of 25 years, 0.641 Sharpe
- UK (LSE): +9.48% excess vs FTSE*, 20 invested years, concentrated quality screen
- Germany (XETRA): +3.80% excess vs DAX, 20 invested years, industrial cash discipline
Past performance does not guarantee future results. Backtested returns are hypothetical and subject to survivorship bias, look-ahead bias, and estimated transaction costs. This is research content, not investment advice.
Data: Ceta Research (FMP financial data warehouse), 2000-2025. All returns in local currencies. Benchmarks: S&P 500 (US), DAX (Germany), ^FTSE price index (UK), Sensex (India), HSI (Hong Kong), SSE Composite (China). Full methodology: github.com/ceta-research/backtests/blob/main/METHODOLOGY.md


