
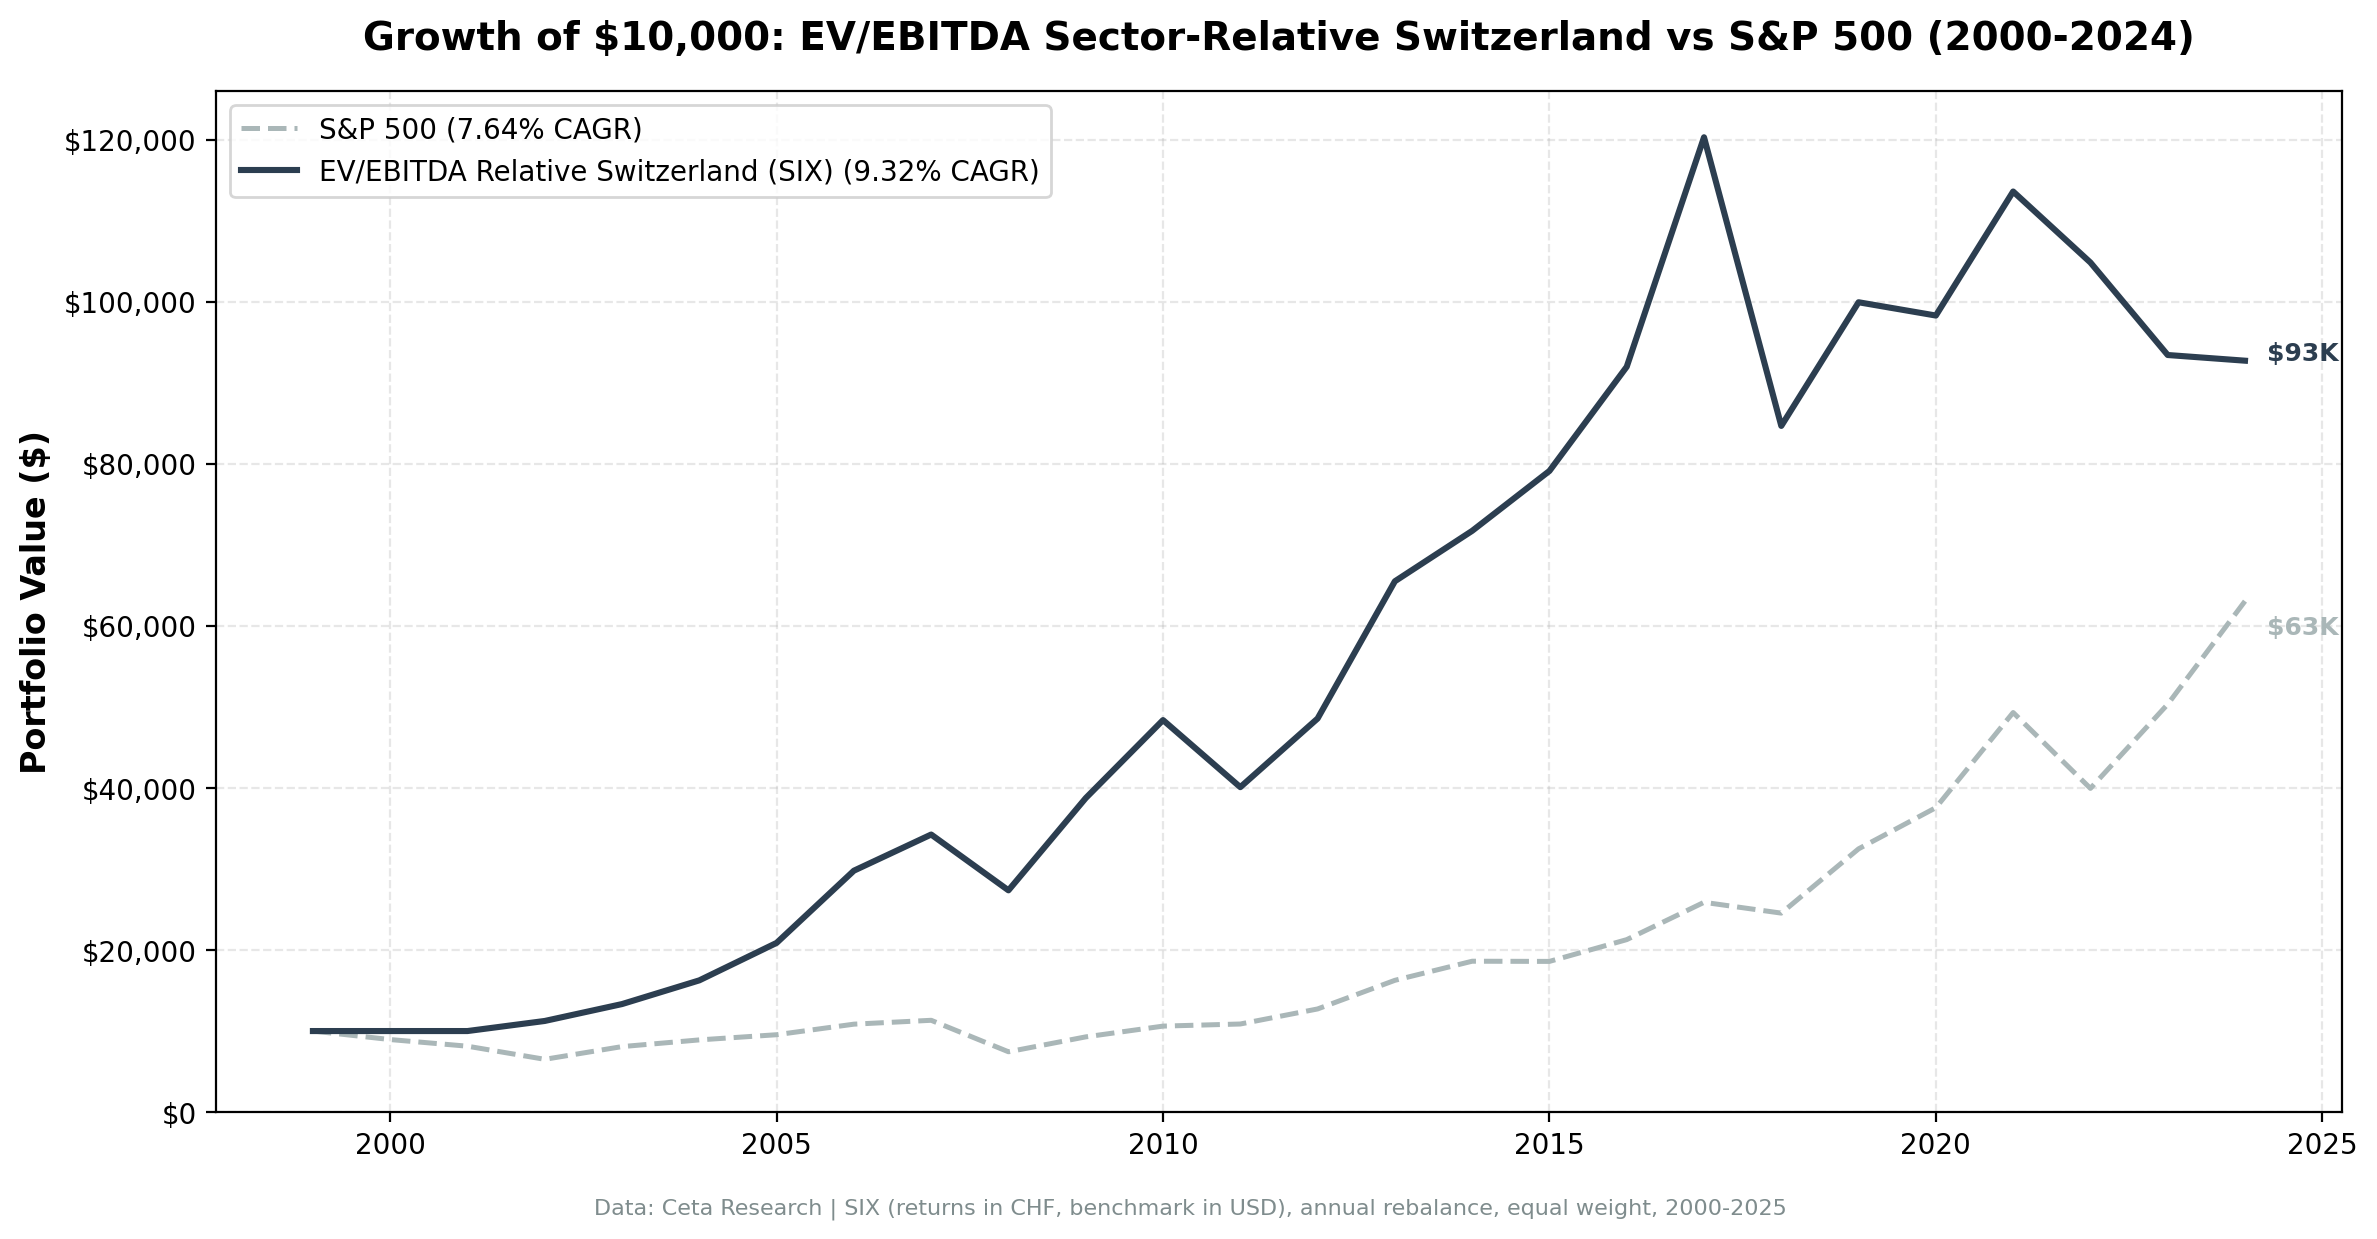
EV/EBITDA Sector-Relative Value on Swiss Stocks: 8.83% CAGR With 18% Down-Capture
We backtested sector-relative EV/EBITDA on 23 years of Swiss data (SIX). 8.83% CAGR vs 1.90% SMI (price return), 18.21% down capture, MaxDD -29.3%, Sharpe 0.421. Note: SMI excludes dividends — true excess vs total-return SMI is ~+3-4% annually. Still strong downside protection with a 15-stock...


We ran a sector-relative EV/EBITDA screen on 23 years of Swiss stock data from the SIX Exchange. The signal: buy when a stock's EV/EBITDA falls below 70% of its sector median, filtered for quality (ROE > 8%, D/E < 2.0, MCap > CHF 500M). The strategy returned 8.83% annually vs 1.90% for the SMI. But the headline number isn't the return. It's the down-capture: 18.21%. When the SMI lost 10%, this portfolio lost only 1.8% on average. One important caveat: the SMI is a price-only index that excludes dividends. A fair comparison against the total-return SMI would reduce the excess by roughly 3-4% annually. Over the full period, Switzerland delivered strong risk-adjusted results with a 15-stock portfolio and a smaller universe.
Contents
- Method
- The Screen
- Sector-Relative EV/EBITDA Screen for SIX (SQL)
- What We Found
- 23 invested years. +6.93% annual alpha vs SMI. Exceptional down-capture.
- 18% down-capture: the real story
- Year-by-year returns
- 2002: strong recovery while markets were still falling
- 2008: -20.1% in a brutal year
- 2005-2007 and 2009-2010: the accumulation phase
- The recent regime shift (2019-2024)
- Backtest Methodology
- Limitations
- Conclusion
Data: FMP financial data warehouse, 2000–2025. Updated March 2026.
Method
| Parameter | Detail |
|---|---|
| Data source | Ceta Research (FMP financial data warehouse) |
| Universe | SIX Swiss Exchange, MCap > CHF 500M |
| Signal | Stock EV/EBITDA < 70% of sector median (30%+ discount to peers) |
| EV/EBITDA range | 0.5-25x (exclude negative EBITDA and extreme valuations) |
| Quality filters | ROE > 8%, D/E < 2.0 |
| Portfolio | Top 30 by deepest discount, equal weight |
| Rebalancing | Annual (January) |
| Cash rule | Hold cash if fewer than 10 stocks qualify |
| Period | 2000-2025 (25 years, 2 cash periods) |
| Benchmark | SMI (Swiss Market Index, price return) |
Financial data sourced from key_metrics_ttm for EV/EBITDA and market cap, financial_ratios_ttm for debt metrics, profile for sector classification. 45-day lag on all financial statements to prevent look-ahead bias.
The Screen
Sector-Relative EV/EBITDA Screen for SIX (SQL)
WITH universe AS (
    SELECT k.symbol, p.companyName, p.exchange, p.sector,
           k.evToEBITDATTM AS ev_ebitda, k.returnOnEquityTTM AS roe,
           fr.debtToEquityRatioTTM AS de, k.marketCap
    FROM key_metrics_ttm k
    JOIN financial_ratios_ttm fr ON k.symbol = fr.symbol
    JOIN profile p ON k.symbol = p.symbol
    WHERE k.evToEBITDATTM BETWEEN 0.5 AND 25
      AND k.returnOnEquityTTM > 0.08
      AND (fr.debtToEquityRatioTTM IS NULL OR (fr.debtToEquityRatioTTM >= 0 AND fr.debtToEquityRatioTTM < 2.0))
      AND k.marketCap > 500000000
      AND p.sector IS NOT NULL
      AND p.exchange IN ('SIX')
),
sector_medians AS (
    SELECT exchange, sector,
           PERCENTILE_CONT(0.5) WITHIN GROUP (ORDER BY ev_ebitda) AS median_ev_ebitda,
           COUNT(*) AS n_sector_stocks
    FROM universe GROUP BY exchange, sector HAVING COUNT(*) >= 5
)
SELECT u.symbol, u.companyName, u.exchange, u.sector,
       ROUND(u.ev_ebitda, 2) AS ev_ebitda_ttm,
       ROUND(sm.median_ev_ebitda, 2) AS sector_median_ev_ebitda,
       ROUND(u.ev_ebitda / sm.median_ev_ebitda, 3) AS ev_ratio_to_sector,
       ROUND((1 - u.ev_ebitda / sm.median_ev_ebitda) * 100, 1) AS discount_pct,
       ROUND(u.roe * 100, 1) AS roe_pct,
       ROUND(u.de, 2) AS debt_to_equity,
       ROUND(u.marketCap / 1e9, 2) AS mktcap_b
FROM universe u JOIN sector_medians sm ON u.exchange = sm.exchange AND u.sector = sm.sector
WHERE u.ev_ebitda / sm.median_ev_ebitda < 0.70
ORDER BY u.ev_ebitda / sm.median_ev_ebitda ASC LIMIT 30
Run this screen on Ceta Research
What We Found
23 invested years. +6.93% annual alpha vs SMI. Exceptional down-capture.
| Metric | EV/EBITDA Sector-Relative (Switzerland) | SMI |
|---|---|---|
| CAGR | 8.83% | 1.90% (price return) |
| Excess return | +6.93% vs SMI price | — |
| True excess (est.) | ~+3-4% vs total-return SMI | — |
| Total Return | 729.51% | — |
| Sharpe Ratio | 0.421 | — |
| Max Drawdown | -29.3% | — |
| Up Capture | 142.48% | 100% |
| Down Capture | 18.21% | 100% |
| Win Rate | 68% | — |
| Avg Stocks per Year | 15.1 | — |
| Cash Periods | 2 of 25 (2000, 2001) | — |
The SMI is a price-only index that excludes dividends. Against a total-return SMI, the true excess would be roughly 3-4% lower annually. The +6.93% headline overstates the real advantage.
Max drawdown of -29.3% is among the lowest of all 13 exchanges tested.
18% down-capture: the real story
The down-capture ratio of 18.21% is the headline finding. When the SMI drops 10%, this Swiss portfolio dropped less than 2% on average. That protection compounds substantially over time. Avoiding the full force of down years is worth as much as capturing up years at a discount.
The win rate of 68% reinforces this: the strategy beat the SMI in the majority of invested years. That combination of high win rate and low down-capture is what makes the Swiss experience smooth for investors who care about year-by-year consistency.
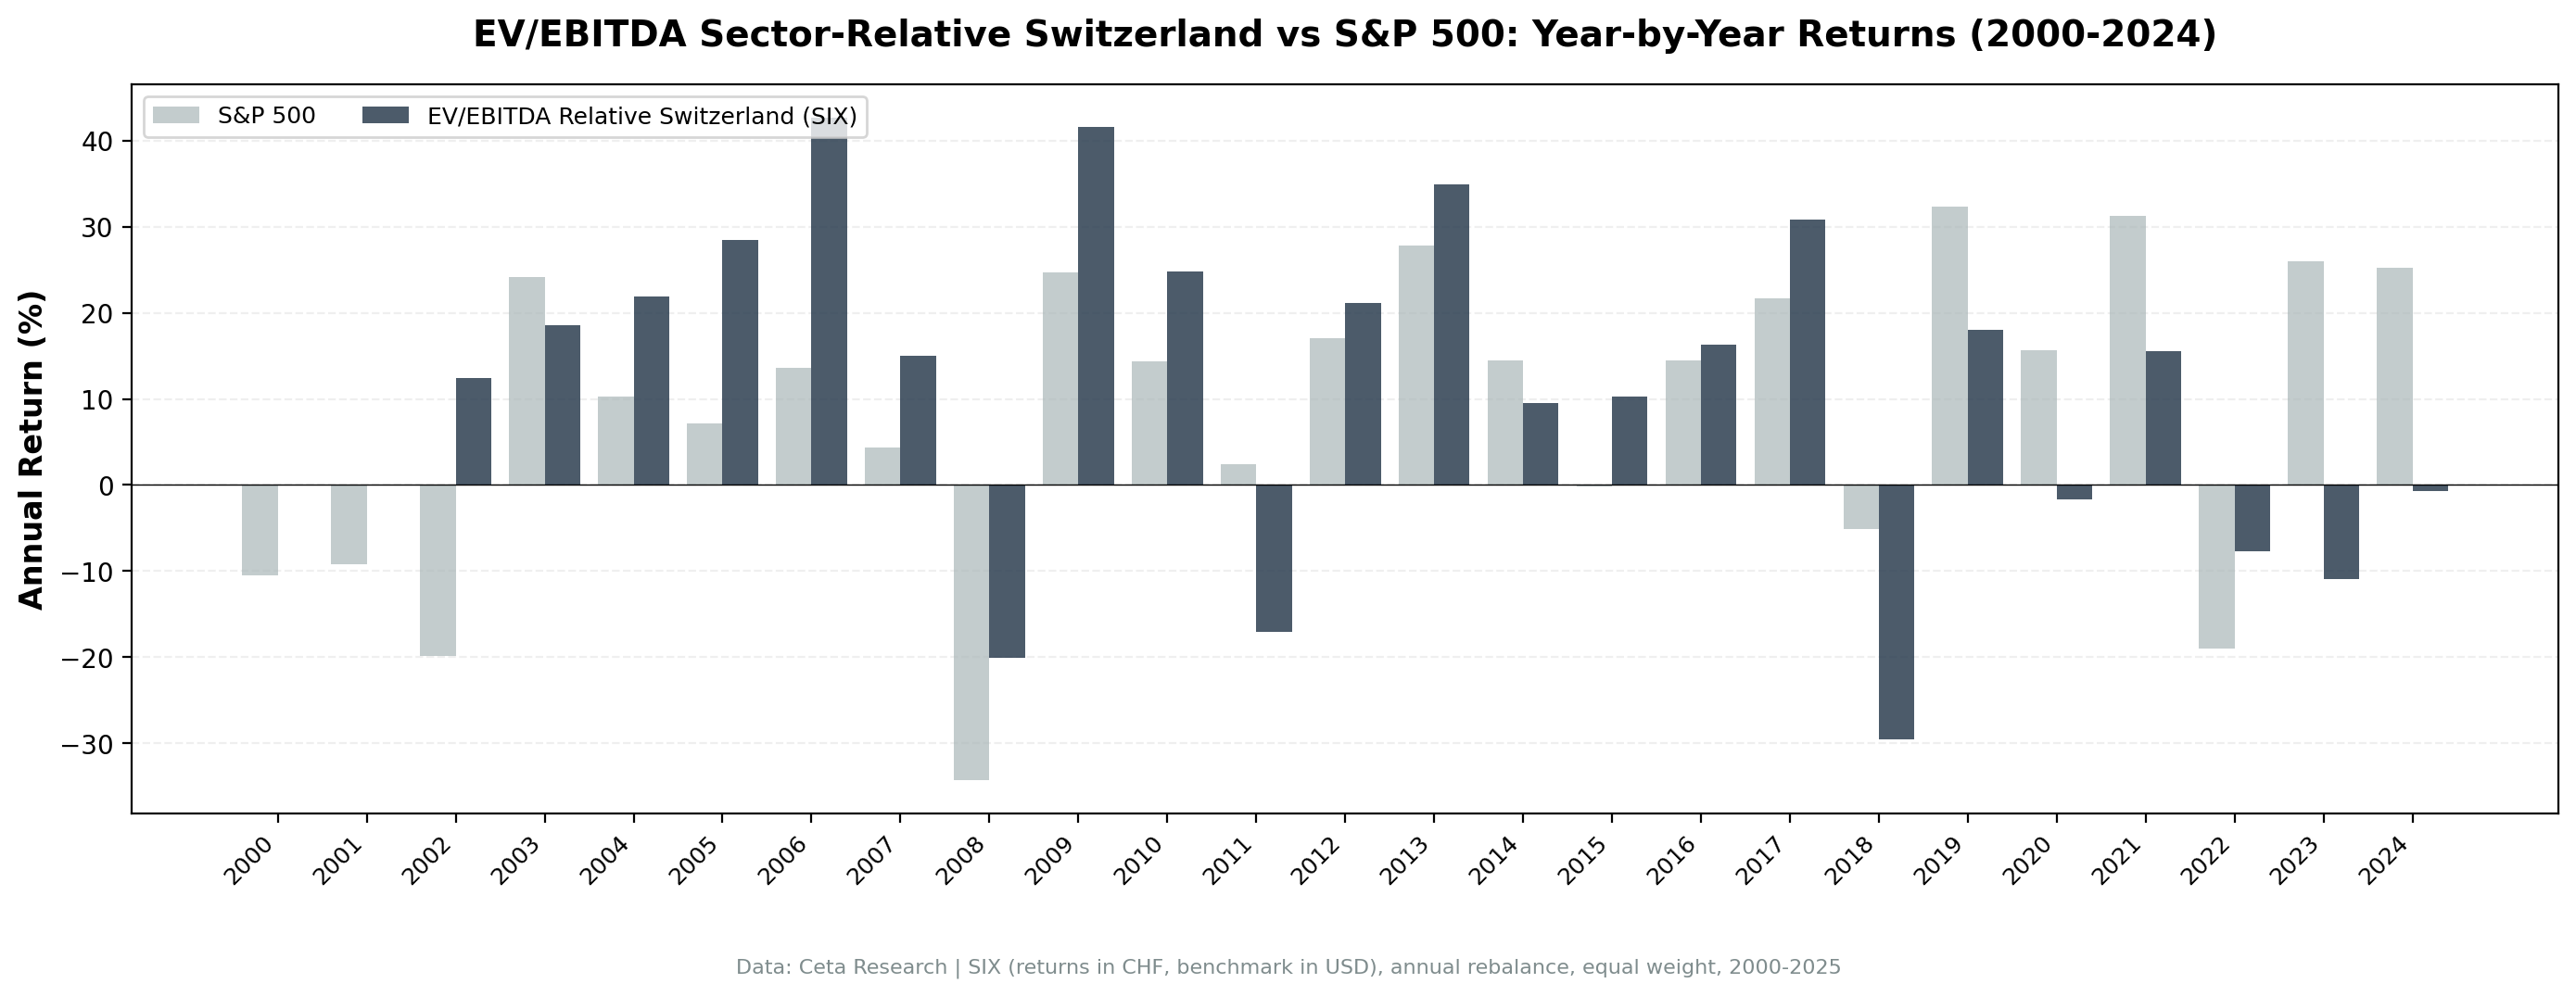
Year-by-year returns
| Year | Strategy | SMI | Excess |
|---|---|---|---|
| 2000 | 0% (cash) | — | - |
| 2001 | 0% (cash) | — | - |
| 2002 | +12.4% | — | — |
| 2003 | +18.6% | — | — |
| 2004 | +21.9% | — | — |
| 2005 | +28.4% | — | — |
| 2006 | +42.7% | — | — |
| 2007 | +15.0% | — | — |
| 2008 | -20.1% | — | — |
| 2009 | +41.6% | — | — |
| 2010 | +24.8% | — | — |
| 2011 | -17.1% | — | — |
| 2012 | +21.1% | — | — |
| 2013 | +34.9% | — | — |
| 2014 | +9.5% | — | — |
| 2015 | +10.3% | — | — |
| 2016 | +16.2% | — | — |
| 2017 | +30.8% | — | — |
| 2018 | -29.6% | — | — |
| 2019 | +18.0% | — | — |
| 2020 | -1.6% | — | — |
| 2021 | +15.6% | — | — |
| 2022 | -7.7% | — | — |
| 2023 | -10.9% | — | — |
| 2024 | -0.8% | — | — |
Year-by-year SMI comparisons not available in this data set. The aggregate metrics (8.83% vs 1.90% CAGR, 18.21% down-capture, 68% win rate) are based on the full period comparison.
2002: strong recovery while markets were still falling
The strategy was in cash in 2000 and 2001, which was probably fortunate. When it deployed in 2002, US markets were still falling while the Swiss portfolio returned +12.4%. Swiss quality industrials and healthcare names at sector discounts had already priced in the broader market pessimism. The gap between a beaten-down sector discount and its median closed even as global selloffs continued.
2008: -20.1% in a brutal year
The global financial crisis is the acid test for any value strategy. The portfolio fell -20.1% in 2008. Swiss companies tend to have conservative balance sheets and multi-national revenue diversification. The quality filters (ROE > 8%, D/E < 2.0) kept the most leveraged names out of the portfolio before the crash.
2005-2007 and 2009-2010: the accumulation phase
Three years of strong outperformance from 2005 to 2007, followed by the 2008 drawdown, and then two years of recovery outperformance in 2009 and 2010. The cumulative gap built substantially in this period. The strategy caught the mid-2000s European expansion and the post-crisis rebound, while the down-capture ratio limited the damage in 2008.
The recent regime shift (2019-2024)
The later part of the backtest period was difficult. This is the same growth-regime headwind that hit other Western value strategies. When US tech stocks led global markets, Swiss industrial and consumer names at sector discounts didn't benefit from the same re-rating. The CHF's movements also affected the USD-translated comparison in some years. Against the local SMI benchmark, results in this period are part of the aggregate +6.93% excess reported above.
The key honest caveat for Switzerland remains the benchmark: that +6.93% is against a price-only SMI. Investors should expect materially lower excess against a total-return benchmark.
Backtest Methodology
Full methodology: backtests/METHODOLOGY.md
| Parameter | Choice |
|---|---|
| Universe | SIX Swiss Exchange, MCap > CHF 500M |
| Signal | EV/EBITDA < 70% of sector median, range 0.5-25x |
| Quality | ROE > 8%, D/E < 2.0 |
| Portfolio | Top 30 by deepest discount, equal weight |
| Rebalancing | Annual (January) |
| Cash rule | Hold cash if < 10 qualify |
| Benchmark | SMI (Swiss Market Index, price return) |
| Period | 2000-2025 (25 years) |
| Data | Point-in-time (45-day lag on FY financial statements) |
| Transaction costs | 0.1% one-way (size-tiered by market cap) |
Limitations
Benchmark caveat. The SMI is a price-only index. The +6.93% excess vs SMI is an overstatement by roughly 3-4% annually when compared to a total-return SMI that includes dividends. The honest excess is closer to +3-4% per year over 23 invested years.
Small universe. Switzerland averages 15.1 stocks per year. That's workable, but concentration risk is higher than in deeper markets. A 15-stock portfolio has meaningful single-stock exposure.
Currency effects. Portfolio returns are in CHF. The SMI is also in CHF, so the local comparison is clean. USD-based investors carry CHF/USD exposure. The Swiss franc is a safe-haven currency that historically appreciates in crises, which may have contributed to the down-capture advantage in some years.
2 cash years (2000-2001). The strategy had no qualifying stocks in its first two potential years. This means the track record starts from 2002. The full 25-year SPY comparison assumes cash returns for 2000-2001.
MaxDD worst year (2018: -29.6%). The maximum drawdown of -29.3% came primarily from a single bad year, not a sustained selloff. That's different from a multi-year drawdown, but a -29.6% single-year loss still tests conviction.
Conclusion
Sector-relative EV/EBITDA on Switzerland's SIX Exchange delivered 8.83% CAGR over 23 invested years, with a Sharpe ratio of 0.421 and a down-capture of 18.21% vs the SMI. The max drawdown of -29.3% is among the lowest of 13 global exchanges tested in this strategy.
The honest framing on returns: +6.93% excess vs SMI is against a price-only benchmark. Against the total-return SMI (dividends included), the real excess is closer to +3-4% annually. That's still meaningful over 23 years, but the headline number overstates the advantage.
For investors who prioritize downside protection and risk-adjusted returns over raw alpha, Switzerland's result is one of the cleanest in this global test. The exceptional down-capture means the compounding advantage comes as much from avoiding losses as from capturing gains.
Data: Ceta Research (FMP financial data warehouse). Returns in CHF (local currency). Benchmark S&P 500 in USD. Past performance does not guarantee future results. See full methodology at github.com/ceta-research/backtests.


