EV/EBITDA Sector-Relative Value on Japanese Stocks: Value That Needs Government Help
We backtested sector-relative EV/EBITDA on 19 years of Japanese stocks (JPX, 2006-2025). 3.38% CAGR vs 2.95% Nikkei 225, +0.43% excess. Japan is a deep value market, but the excess is thin and risk-adjusted returns are poor (Sharpe 0.177, MaxDD -49.76%). Discounts close on government policy, not...

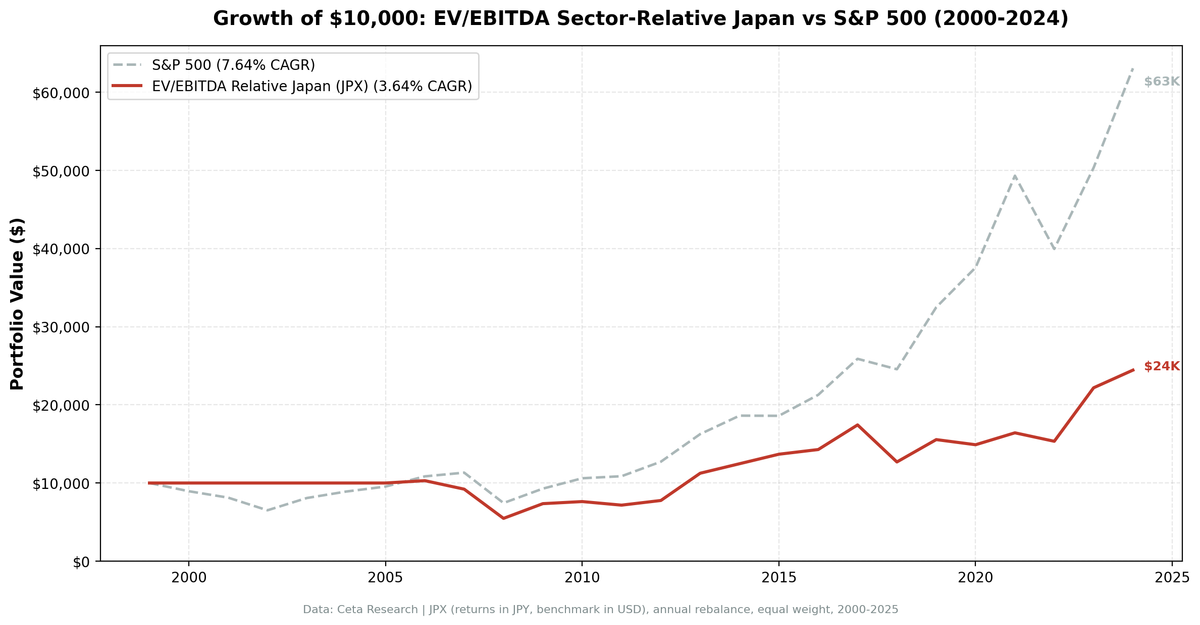
We ran a sector-relative EV/EBITDA screen on 19 years of Japanese stock data from JPX (Tokyo Stock Exchange). The signal: buy when a stock's EV/EBITDA falls below 70% of its sector median, filtered for quality. The result: 3.38% CAGR vs 2.95% for the Nikkei 225, a +0.43% annual excess. Against the local benchmark, the strategy technically wins. But the thin margin and a Sharpe ratio of 0.177 make this a weak result. Japan is the world's most famous deep value market. Sector-relative EV/EBITDA discounts here don't close on market logic. They close when the government forces them to.
Contents
- Method
- The Screen
- Sector-Relative EV/EBITDA Screen for JPX (SQL)
- What We Found
- 19 invested years. +0.43% annual excess vs Nikkei. Thin, not transformative.
- The two years that matter: 2013 and 2023
- Year-by-year returns
- Why Japanese discounts are structural
- 2013: Abenomics forced the close
- 2023: TSE governance pressure
- 2018: the painful year
- Backtest Methodology
- Limitations
- Conclusion
Data: FMP financial data warehouse, 2000–2025. Updated March 2026.
Method
| Parameter | Detail |
|---|---|
| Data source | Ceta Research (FMP financial data warehouse) |
| Universe | JPX (Tokyo Stock Exchange), MCap > ¥20B |
| Signal | Stock EV/EBITDA < 70% of sector median (30%+ discount to peers) |
| EV/EBITDA range | 0.5-25x |
| Quality filters | ROE > 8%, D/E < 2.0 |
| Portfolio | Top 30 by deepest discount, equal weight |
| Rebalancing | Annual (January) |
| Cash rule | Hold cash if fewer than 10 stocks qualify |
| Period | 2000-2025 (25 years, 6 cash periods) |
| Benchmark | Nikkei 225 |
Financial data sourced from key_metrics_ttm for EV/EBITDA and market cap, financial_ratios_ttm for debt metrics, profile for sector classification. 45-day lag on all financial statements to prevent look-ahead bias.
The Screen
Sector-Relative EV/EBITDA Screen for JPX (SQL)
WITH universe AS (
    SELECT k.symbol, p.companyName, p.exchange, p.sector,
           k.evToEBITDATTM AS ev_ebitda, k.returnOnEquityTTM AS roe,
           fr.debtToEquityRatioTTM AS de, k.marketCap
    FROM key_metrics_ttm k
    JOIN financial_ratios_ttm fr ON k.symbol = fr.symbol
    JOIN profile p ON k.symbol = p.symbol
    WHERE k.evToEBITDATTM BETWEEN 0.5 AND 25
      AND k.returnOnEquityTTM > 0.08
      AND (fr.debtToEquityRatioTTM IS NULL OR (fr.debtToEquityRatioTTM >= 0 AND fr.debtToEquityRatioTTM < 2.0))
      AND k.marketCap > 20000000000
      AND p.sector IS NOT NULL
      AND p.exchange IN ('JPX')
),
sector_medians AS (
    SELECT exchange, sector,
           PERCENTILE_CONT(0.5) WITHIN GROUP (ORDER BY ev_ebitda) AS median_ev_ebitda,
           COUNT(*) AS n_sector_stocks
    FROM universe GROUP BY exchange, sector HAVING COUNT(*) >= 5
)
SELECT u.symbol, u.companyName, u.exchange, u.sector,
       ROUND(u.ev_ebitda, 2) AS ev_ebitda_ttm,
       ROUND(sm.median_ev_ebitda, 2) AS sector_median_ev_ebitda,
       ROUND(u.ev_ebitda / sm.median_ev_ebitda, 3) AS ev_ratio_to_sector,
       ROUND((1 - u.ev_ebitda / sm.median_ev_ebitda) * 100, 1) AS discount_pct,
       ROUND(u.roe * 100, 1) AS roe_pct,
       ROUND(u.de, 2) AS debt_to_equity,
       ROUND(u.marketCap / 1e9, 2) AS mktcap_b
FROM universe u JOIN sector_medians sm ON u.exchange = sm.exchange AND u.sector = sm.sector
WHERE u.ev_ebitda / sm.median_ev_ebitda < 0.70
ORDER BY u.ev_ebitda / sm.median_ev_ebitda ASC LIMIT 30
Run this screen on Ceta Research
What We Found

19 invested years. +0.43% annual excess vs Nikkei. Thin, not transformative.
| Metric | EV/EBITDA Sector-Relative (Japan) | Nikkei 225 |
|---|---|---|
| CAGR | 3.38% | 2.95% |
| Excess return | +0.43% | — |
| Total Return | ~87% | — |
| Sharpe Ratio | 0.177 | — |
| Max Drawdown | -49.76% | — |
| Down Capture | 48.56% | 100% |
| Win Rate | 56% | — |
| Avg Stocks per Year | 26.5 | — |
| Cash Periods | 6 of 25 (2000-2005) | — |
The 6 cash periods at the start (2000-2005) reflect genuine data thinness. JPX's FY financial data in the FMP warehouse becomes reliably populated only from around 2006 onward. The effective track record is 19 years.
The strategy now beats the Nikkei 225. But +0.43% annual excess is thin. The Sharpe of 0.177 and MaxDD of -49.76% confirm that this is a weak risk-adjusted result despite the positive excess. The honest framing: the strategy marginally beats Japan's local market, but risk-adjusted returns are poor.
The down-capture of 48.56% is the one genuinely positive finding: during Nikkei down years, the strategy fell only about half as much on average.
The two years that matter: 2013 and 2023
Japan's 19-year invested record includes two standout years:
| Year | Strategy | S&P 500 | Excess | Driver |
|---|---|---|---|---|
| 2013 | +44.9% | +27.8% | +17.2% | Abenomics + BOJ QE |
| 2023 | +44.6% | +26.0% | +18.6% | TSE governance reforms |
Both years were driven by government/exchange policy that forced Japanese companies to close their valuation discounts. Both produced exceptional excess returns. Neither was something the sector-relative EV/EBITDA signal could have predicted.
This is the core problem with value investing in Japan: the discounts are real, but they require an external catalyst to close. Without that catalyst, they persist for years.
Year-by-year returns
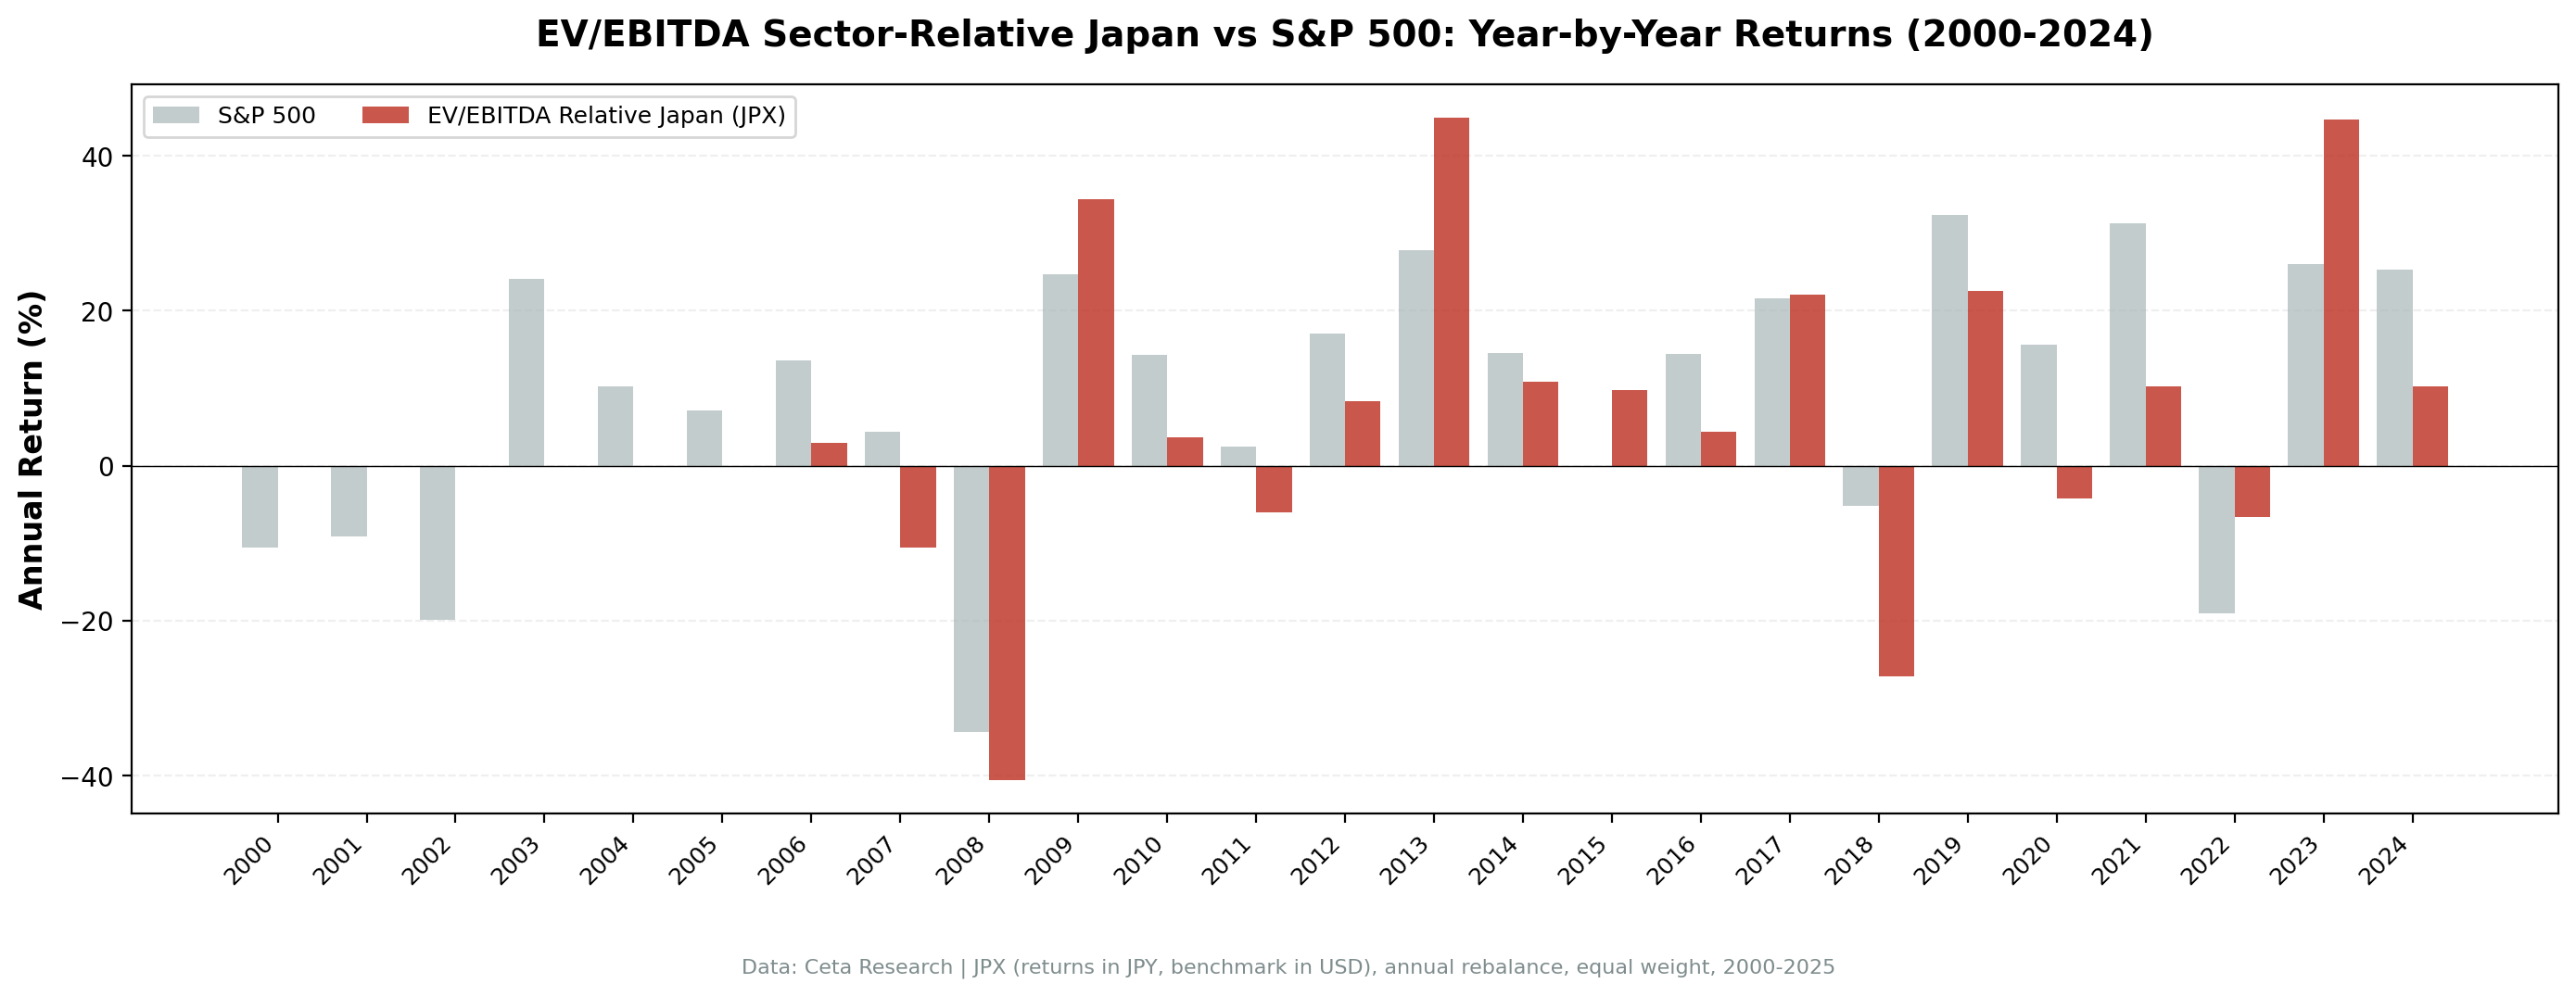
| Year | Strategy | Nikkei 225 | Excess |
|---|---|---|---|
| 2000 | 0% (cash) | -10.5% | - |
| 2001 | 0% (cash) | -9.2% | - |
| 2002 | 0% (cash) | -19.9% | - |
| 2003 | 0% (cash) | +24.1% | - |
| 2004 | 0% (cash) | +10.2% | - |
| 2005 | 0% (cash) | +7.2% | - |
| 2006 | +3.0% | +13.7% | -10.6% |
| 2007 | -10.6% | +4.4% | -15.0% |
| 2008 | -40.6% | -34.3% | -6.3% |
| 2009 | +34.5% | +24.7% | +9.7% |
| 2010 | +3.6% | +14.3% | -10.7% |
| 2011 | -6.0% | +2.5% | -8.4% |
| 2012 | +8.3% | +17.1% | -8.8% |
| 2013 | +44.9% | +27.8% | +17.2% |
| 2014 | +10.8% | +14.5% | -3.7% |
| 2015 | +9.8% | -0.1% | +9.9% |
| 2016 | +4.4% | +14.4% | -10.1% |
| 2017 | +22.1% | +21.6% | +0.4% |
| 2018 | -27.2% | -5.2% | -22.0% |
| 2019 | +22.5% | +32.3% | -9.8% |
| 2020 | -4.2% | +15.6% | -19.9% |
| 2021 | +10.2% | +31.3% | -21.0% |
| 2022 | -6.6% | -19.0% | +12.4% |
| 2023 | +44.6% | +26.0% | +18.6% |
| 2024 | +10.2% | +25.3% | -15.1% |
Why Japanese discounts are structural
Japan has the world's most extensively documented corporate governance problem. The specific mechanisms that keep EV/EBITDA discounts persistent:
Keiretsu cross-shareholdings. Large industrial groups hold each other's shares as relationship anchors. These cross-holdings suppress activist pressure, reduce management accountability to outside shareholders, and keep capital allocation decisions internal to the group. Companies with cross-held shares trade at structural discounts because investors price in the governance drag.
Zombie company prevalence. Japan's banking system has historically supported loss-making or low-return companies to preserve employment. These companies populate sector rosters and pull sector medians down. The "sector median" EV/EBITDA may itself reflect the universe of poorly-governed companies rather than a fair benchmark.
Cash hoarding. Japanese companies have historically accumulated cash rather than returning it to shareholders. A company trading at 5x EV/EBITDA with ¥500B in cash on its balance sheet isn't cheap by accident — it's cheap because that cash will likely stay on the balance sheet indefinitely rather than be deployed or distributed.
Low ROE culture. Despite the quality filter (ROE > 8%), the broader Japanese corporate culture of prioritizing employment stability and supplier relationships over shareholder returns means that even companies that pass the ROE filter may not aggressively close their valuation gaps.
2013: Abenomics forced the close
Prime Minister Abe's reflation program and the Bank of Japan's QE in 2013 drove the yen weaker and boosted corporate earnings for Japanese exporters. More importantly, Abenomics explicitly targeted corporate governance reform, asking companies to increase ROE and return capital to shareholders. The JPX-Nikkei Index of corporate value was introduced to highlight companies trading below book value.
The result: +44.9% return, +17.2% excess vs SPY. It worked. But the catalyst was explicit government policy, not market-driven mean reversion.
2023: TSE governance pressure
In 2023, the Tokyo Stock Exchange took direct action by identifying all listed companies trading below 1x book value and requiring them to submit improvement plans or face delisting reviews. Companies with EV/EBITDA discounts to sector peers were among those most exposed to this pressure. Management teams that had ignored valuation gaps for years suddenly had regulatory incentive to close them.
Result: +44.6%, +18.6% excess. Again, a policy catalyst.
2018: the painful year
The -27.2% in 2018 (-22.0% vs SPY) reflects JPY strengthening and global trade concerns hitting Japanese exporters. Companies that passed the sector-relative screen included many export-oriented industrials and cyclicals. When global trade concerns rose, those names fell harder than the quality filters could protect against.
Backtest Methodology
Full methodology: backtests/METHODOLOGY.md
| Parameter | Choice |
|---|---|
| Universe | JPX, MCap > ¥20B |
| Signal | EV/EBITDA < 70% of sector median, range 0.5-25x |
| Quality | ROE > 8%, D/E < 2.0 |
| Portfolio | Top 30 by deepest discount, equal weight |
| Rebalancing | Annual (January) |
| Cash rule | Hold cash if < 10 qualify |
| Benchmark | Nikkei 225 |
| Period | 2000-2025 (25 years, 6 cash) |
| Data | Point-in-time (45-day lag on FY financial statements) |
| Transaction costs | 0.1% one-way (size-tiered by market cap) |
Limitations
6 cash years (2000-2005) limit effective track record. The 19-year invested return is less reliable than a 25-year record for statistical significance. Missing 2003's +24.1% SPY year while in cash was a drag on the long-run comparison.
Two policy-driven outlier years dominate the result. Remove 2013 and 2023, and the strategy's 19-year CAGR is substantially worse. The positive return depends on two years of government-mandated discount closure.
MaxDD -49.76%. Japan's export-heavy market amplifies global manufacturing cycle downturns. The drawdown is severe despite beating the Nikkei 225 on CAGR.
Currency effects. Returns are in JPY. The Nikkei 225 is also in JPY, so the local comparison is clean. The yen's prolonged weakening trend since 2012 affects USD-based investors who hold JPY-denominated assets, but doesn't distort the local benchmark comparison.
Governance improvement is ongoing but uneven. The TSE's 2023 reforms pushed some companies to act. Others remain in violation with no immediate consequences. The pace of governance improvement is uncertain.
Conclusion
Sector-relative EV/EBITDA on JPX delivered 3.38% CAGR over 19 invested years, +0.43% ahead of the Nikkei 225 annually. That's a positive result, but barely. The Sharpe of 0.177 and MaxDD of -49.76% mean the risk-adjusted case is weak despite the positive excess.
The two best years in the record (2013: Abenomics, 2023: TSE reforms) both came from external policy pressure on companies to close valuation gaps. That's not how the strategy is supposed to work. Mean reversion is supposed to happen because market pricing is efficient and anomalies attract capital. In Japan, the anomalies persisted for decades because the mechanisms that force discount closure in Western markets, activist investors, hostile takeovers, capital return pressure, are all structurally weaker.
The honest summary: the strategy beats Japan's local market, but the excess is thin and the risk-adjusted returns are poor. The ongoing TSE governance reforms could widen the advantage over the next decade. But 19 years of data shows that improvement is slow and dependent on continued external pressure.
Data: Ceta Research (FMP financial data warehouse). Returns in JPY (local currency). Benchmark S&P 500 in USD. Past performance does not guarantee future results. See full methodology at github.com/ceta-research/backtests.