
EV/EBITDA Sector Discount on Indian Stocks: Strong Returns, but the Sensex Did Better
We backtested a sector-relative EV/EBITDA screen on NSE stocks (2006-2025). 10.75% CAGR and beats SPY by a wide margin, but the Sensex returned 11.4%. Against the local benchmark, the strategy trails by 0.66% per year. Full data, SQL screen, and honest assessment.


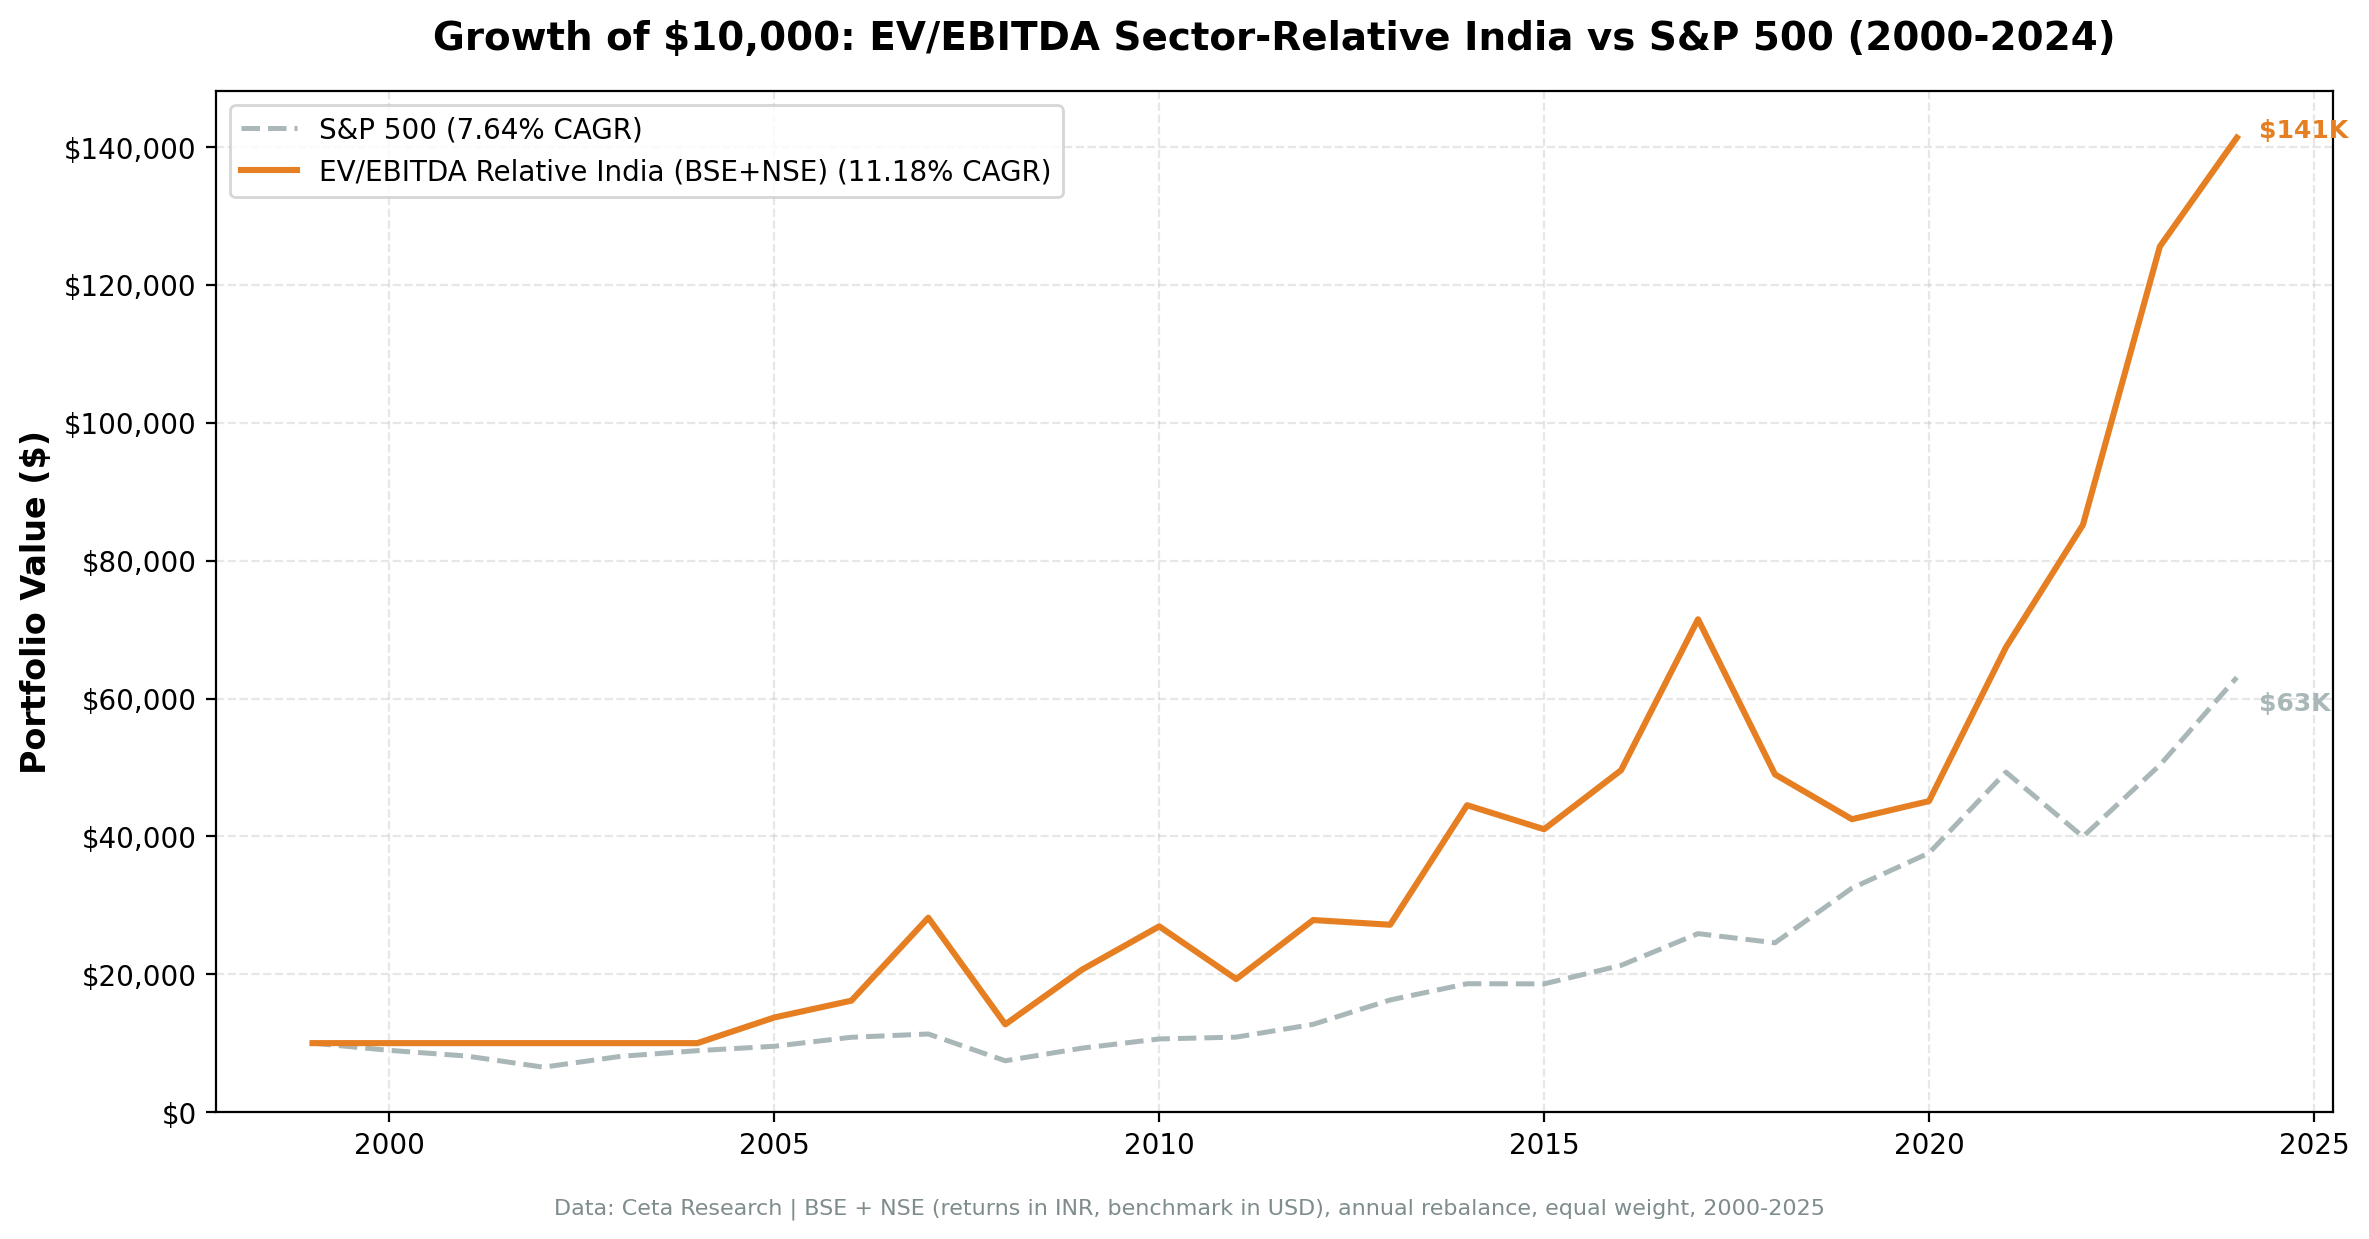
Indian equities are not for the cautious. We ran a sector-relative EV/EBITDA screen on NSE stocks from 2005 through 2025, and the results deliver 10.75% CAGR with a max drawdown of -56.6%. The strategy generated real returns and beat SPY (7.64%) by a wide margin. But when measured against the right benchmark — the Sensex — the honest answer is that the local market did better. The Sensex returned 11.4% over the same period. The strategy trailed by 0.66% annually.
Contents
- Method
- The Screen
- What We Found
- Annual Returns
- The Cash Years Cost the Most
- 2007 and 2008: The Two-Year Swing
- Where It Works and Where It Doesn't
- Limitations
- Conclusion
That's the complete picture. Here's the full breakdown.
Data: FMP financial data warehouse, 2000–2025. Updated March 2026.
Method
We screened NSE-listed stocks starting from when sufficient FMP data existed. Each January, we calculated sector median EV/EBITDA across qualifying stocks and selected the 30 names trading at the deepest discount to sector peers. We held for 12 months.
| Parameter | Value |
|---|---|
| Universe | NSE |
| Market cap minimum | ₹20B (~$240M USD) |
| EV/EBITDA range | 0.5x to 25x |
| ROE filter | > 8% |
| D/E filter | < 2.0 |
| Sector discount required | ≥ 30% below sector median |
| Selection | Top 30 by deepest discount |
| Rebalancing | Annual (January) |
| Cash condition | If fewer than 10 qualify |
| Data source | Ceta Research (FMP financial data warehouse) |
| Filing lag | 45 days (point-in-time, avoids look-ahead) |
| Period | 2000-2025 (effective 2006-2025) |
| Benchmark | Sensex (local) + SPY (USD cross-reference) |
| Returns currency | INR |
Why EV/EBITDA over P/E in India?
Indian markets have a high concentration of capital-intensive businesses in industrials, materials, and infrastructure where debt loads are significant. P/E is distorted by interest charges in those sectors, making cross-company comparison misleading. EV/EBITDA strips out financing structure and depreciation policy, giving a cleaner picture of operating value relative to the enterprise.
The sector-relative framing matters in India because sector valuations diverge sharply. Consumer-facing companies routinely trade at 30-50x earnings while commodity businesses sit at 6-10x. Measuring discount relative to sector peers isolates genuine mispricing rather than sector-wide valuation differences.
Note on benchmarks. The Sensex is the correct benchmark for Indian investors. All returns are in INR and compared to the Sensex (^BSESN, price return). We also show SPY (USD) as a cross-reference for global context, but excess return claims relative to SPY mislead Indian investors.
The Screen
Here's the current sector-relative EV/EBITDA screen for Indian stocks, running against the live FMP warehouse.
WITH universe AS (
    SELECT k.symbol, p.companyName, p.exchange, p.sector,
           k.evToEBITDATTM AS ev_ebitda, k.returnOnEquityTTM AS roe,
           fr.debtToEquityRatioTTM AS de, k.marketCap
    FROM key_metrics_ttm k
    JOIN financial_ratios_ttm fr ON k.symbol = fr.symbol
    JOIN profile p ON k.symbol = p.symbol
    WHERE k.evToEBITDATTM BETWEEN 0.5 AND 25
      AND k.returnOnEquityTTM > 0.08
      AND (fr.debtToEquityRatioTTM IS NULL OR (fr.debtToEquityRatioTTM >= 0 AND fr.debtToEquityRatioTTM < 2.0))
      AND k.marketCap > 20000000000
      AND p.sector IS NOT NULL
      AND p.exchange IN ('NSE')
),
sector_medians AS (
    SELECT exchange, sector,
           PERCENTILE_CONT(0.5) WITHIN GROUP (ORDER BY ev_ebitda) AS median_ev_ebitda,
           COUNT(*) AS n_sector_stocks
    FROM universe GROUP BY exchange, sector HAVING COUNT(*) >= 5
)
SELECT u.symbol, u.companyName, u.exchange, u.sector,
       ROUND(u.ev_ebitda, 2) AS ev_ebitda_ttm,
       ROUND(sm.median_ev_ebitda, 2) AS sector_median_ev_ebitda,
       ROUND(u.ev_ebitda / sm.median_ev_ebitda, 3) AS ev_ratio_to_sector,
       ROUND((1 - u.ev_ebitda / sm.median_ev_ebitda) * 100, 1) AS discount_pct,
       ROUND(u.roe * 100, 1) AS roe_pct,
       ROUND(u.de, 2) AS debt_to_equity,
       ROUND(u.marketCap / 1e9, 2) AS mktcap_b
FROM universe u JOIN sector_medians sm ON u.exchange = sm.exchange AND u.sector = sm.sector
WHERE u.ev_ebitda / sm.median_ev_ebitda < 0.70
ORDER BY u.ev_ebitda / sm.median_ev_ebitda ASC LIMIT 30
Run this query on the live data: cetaresearch.com/data-explorer?q=CIjp4khP-I
What We Found
The strategy was in cash for the first six years (2000-2005). NSE coverage in FMP becomes reliably populated from 2006 onward. Before that, too few stocks met the data quality and sector coverage thresholds. From 2006, the strategy was invested in all 19 remaining years.
Over the full 25-year window: 10.75% CAGR, with total return of around 970% (19 invested years). The Sensex returned 11.4% CAGR over the same period. The strategy trailed by 0.66% per year.
| Metric | Strategy | Sensex | SPY (cross-ref) |
|---|---|---|---|
| CAGR | 10.75% | 11.40% | 7.64% |
| Excess vs benchmark | -0.66% | — | — |
| Sharpe ratio | 0.128 | — | — |
| Sortino ratio | 0.25 | — | — |
| Calmar ratio | 0.19 | — | — |
| Max drawdown | -56.6% | -51.3% | -34.90% |
| Down capture | 73.73% | 100% | — |
| Up capture | 94.98% | 100% | — |
| Win rate vs Sensex | 52% | — | — |
| Cash periods | 6 / 25 | — | — |
| Invested periods | 19 / 25 | — | — |
| Avg stocks held | 26.0 | — | — |
The strategy beats SPY by a comfortable margin (+3.1% annual excess in INR terms). But SPY is a USD benchmark — not a meaningful comparison for INR-denominated returns. Against what an Indian investor would hold as an alternative (Sensex), the strategy slightly underperforms.
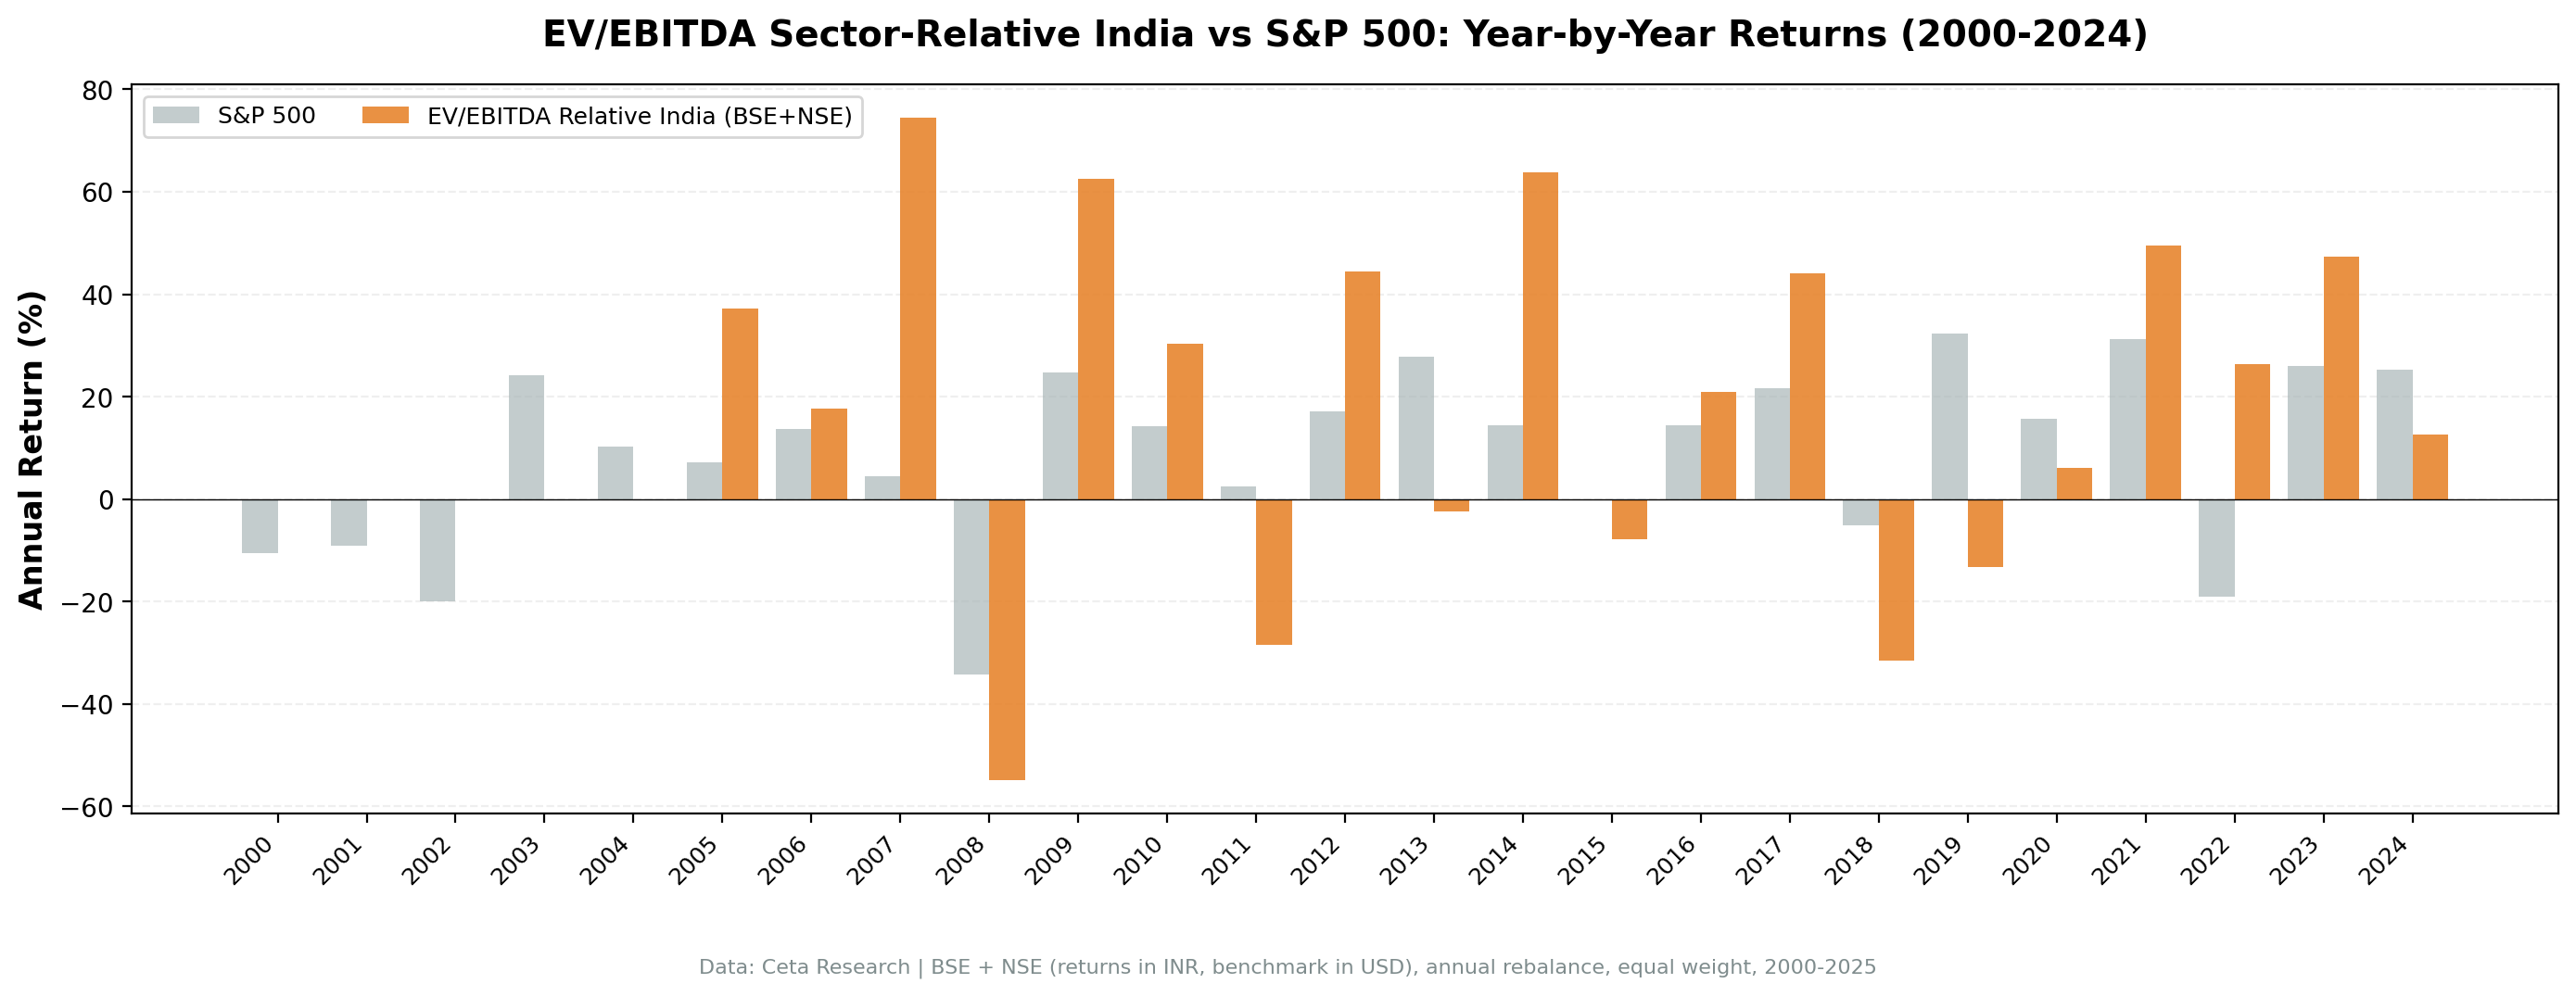
Annual Returns
| Year | Strategy | Sensex | Excess |
|---|---|---|---|
| 2000 | 0% (cash) | -25.2% | — |
| 2001 | 0% (cash) | -18.6% | — |
| 2002 | 0% (cash) | +2.9% | — |
| 2003 | 0% (cash) | +79.1% | — |
| 2004 | 0% (cash) | +10.8% | — |
| 2005 | 0% (cash) | +40.6% | — |
| 2006 | +25.8% | +48.5% | -22.7% |
| 2007 | +75.8% | +46.8% | +29.0% |
| 2008 | -56.6% | -51.3% | -5.3% |
| 2009 | +85.9% | +76.3% | +9.5% |
| 2010 | +21.6% | +17.1% | +4.5% |
| 2011 | -28.5% | -24.5% | -4.0% |
| 2012 | +42.6% | +27.0% | +15.5% |
| 2013 | +4.1% | +6.0% | -1.8% |
| 2014 | +55.4% | +33.5% | +21.8% |
| 2015 | -9.2% | -8.1% | -1.1% |
| 2016 | +21.9% | +3.8% | +18.1% |
| 2017 | +45.0% | +27.1% | +17.8% |
| 2018 | -27.8% | +6.2% | -33.9% |
| 2019 | -12.0% | +16.0% | -28.0% |
| 2020 | +5.9% | +15.7% | -9.8% |
| 2021 | +44.9% | +22.9% | +22.0% |
| 2022 | +29.8% | +3.4% | +26.4% |
| 2023 | +50.9% | +17.5% | +33.3% |
| 2024 | +17.1% | +11.2% | +5.9% |
The Cash Years Cost the Most
The six cash periods (2000-2005) are a structural problem for the India comparison. The Sensex compounded dramatically during this period: +79.1% in 2003, +10.8% in 2004, +40.6% in 2005. The strategy earned 0% in all six years. Missing that run set a difficult bar for the invested years to overcome.
This isn't strategy failure — the data wasn't there to run the screen. But it means the 25-year comparison is structurally disadvantaged. From the first invested year (2006) to 2025, the win rate improves: the strategy won 10 of 19 invested years against the Sensex.
2007 and 2008: The Two-Year Swing
The clearest illustration of this strategy's characteristics in India: +75.8% in 2007 against Sensex +46.8%, then -56.6% in 2008 against Sensex -51.3%.
The 2007 outperformance (+29 percentage points excess) reflects a bull market re-rating where sector-relative discounts collapsed rapidly. The 2008 underperformance (-5 percentage points) shows the strategy falling harder in systemic crises. Indian equities fell broadly in 2008, but the strategy's holdings fell further than the index average.
Where It Works and Where It Doesn't
The strategy beat Sensex decisively in years with clear valuation recovery: - 2014: +21.8% excess (government reform, market re-rating) - 2016: +18.1% excess (demonetization aftermath, sector rotations) - 2017: +17.8% excess (GST transition, mid-cap re-rating) - 2022: +26.4% excess (value vs growth reversal) - 2023: +33.3% excess (sustained value recovery)
It lost ground in momentum-driven years and Indian market-specific dislocations: - 2006: -22.7% (early bull run, sector discounts didn't close fast enough) - 2018-2019: -33.9%, -28.0% (NBFC crisis, credit squeeze, rupee depreciation) - 2020: -9.8% (COVID recovery was tech-led globally, not value-led)
Limitations
Benchmark mismatch. The Sensex is a price return index. The strategy's portfolio returns include dividend reinvestment through adjClose. This means the comparison may modestly overstate the strategy's apparent excess. The honest excess vs Sensex total return would be more negative.
High drawdowns. A max drawdown of -56.6% exceeds most investors' tolerance. The strategy amplifies Indian market volatility rather than dampening it. Down capture of 73.73% means it absorbs three-quarters of Sensex losses.
Early cash periods. Six cash years from 2000-2005 reflect data sparsity, not strategy choice. The 25-year comparison is structurally penalized by these years.
Systemic exposure. India remains a high-beta market. The EV/EBITDA screen provides no protection against EM-wide selloffs.
Execution friction. Indian mid-cap stocks can have meaningful bid-ask spreads. Transaction costs and market impact aren't modeled.
Sector thinness. Some Indian sectors have fewer than 10 large-cap companies meeting quality filters. In thin sectors, sector median EV/EBITDA is computed from a small sample.
Conclusion
The sector-relative EV/EBITDA screen on Indian stocks delivers 10.75% CAGR over 25 years and beats SPY in USD terms by a wide margin. But the Sensex returned 11.4% over the same period. Against the local benchmark, the strategy trails by 0.66% annually.
The honest read: this screen works in India in absolute terms, and it outperforms in specific environments (value recovery years, re-rating cycles). But it doesn't consistently beat the Indian market on a risk-adjusted basis. The volatility is high, the cash periods cost compounding in the early years, and Sensex momentum in bull phases tends to outpace the discount-focused portfolio.
For investors already holding Indian equities as part of a value tilt, the sector-relative EV/EBITDA filter is a structured way to identify relative value within the NSE universe. It won't reduce India's inherent volatility, and it won't reliably outperform the index.
Data: Ceta Research (FMP financial data warehouse). Backtest covers 2000-2025 (effectively 2006-2025) using point-in-time financial data with 45-day filing lag. Returns in INR. Benchmark: Sensex (^BSESN, price return). SPY shown as cross-reference in USD. Results are hypothetical and do not reflect actual investment results. Past performance does not guarantee future results.


